Clean Energy Systems and Experiences Part 2 potx
Bạn đang xem bản rút gọn của tài liệu. Xem và tải ngay bản đầy đủ của tài liệu tại đây (740.53 KB, 15 trang )
Clean Energy Systems and Experiences8
Output power, which depends on the load, is not only constant for certain specific
conditions but also is bounded, so that the boost converter must be controlled in order to
regulate the output voltage and makes sure to maintain the required output voltage at the
load. All this is made by using a sliding mode controller in order to introduce a good
dynamic response to the system (Sira-Ramirez & Rios-Bolivar, 1994). The sliding surface
considered allows avoiding the use of current sensors (Vazquez et al., 2003).
In spite of weather conditions, output power must be maintained, so that the system takes in
consideration the battery set in order to supply the required energy which allows feed the
load properly. Auxiliary switches are turned on and off depending on the availability of the
renewable source, in order to be able to do this a modified MPPT algorithm, which is
performed with a microcontroller, is considered.
Modified MPPT not only defines the maximum power point (MPP) for the renewable source
but also established when the energy must be taken either from the two voltage sources or
just from a single one. Algorithm determines when the renewable source delivers the
possible maximum power in order to optimise its use and the battery set provides the
complement. Sometimes when the required load power is lower than the maximum and the
demanded energy can be obtained from the renewable source, the maximum point is not
tracked.
The system is turned off for safety purposes when energy is not enough to maintain the
system operation because the battery set is discharged.
(a) Modified MPPT algorithm
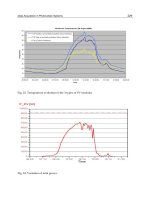
Figure 2 shows the renewable source behaviour for certain weather conditions, the output
power may be different depending on the load. The figure illustrates three points, where
each point represents a specific load power. If load requires power between points A and B,
then the photovoltaic/wind system is able to provide the total load power, this leads that
the system must be inside the curve behaviour of the renewable system and the maximum
point is not tracked. However, if load demands a power higher than the possible provided
from point B, as well it could be point C, then the battery provides the rest of power in order
to reach the total load power, especially at this point the renewable system must be operated
to track the MPP.
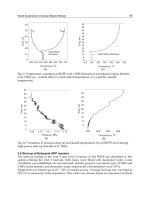
Operation mentioned before is achieved with aid of a modified MPPT algorithm; Figure 8
shows the flow chart. The method is based on the perturbation and observation technique,
voltage and power of the renewable source are used as inputs. Depending on system
conditions the duty cycle of auxiliary switch S
2
must be increased or decreased, it should be
notice that the other auxiliary switch (S
1
) has a complement operation in order to demand
the complement power from the battery set.
It is an important part of algorithm that duty cycle, due to its natural values, must be
bounded to a maximum and minimum value (1 and 0). Particularly when the duty cycle is
limited to a unity, the system is not tracking the MPP, then it operates inside the curve
behaviour (between points A and B). While algorithm is continuously sensing the voltage
and power, the duty cycle is set to the working condition.
For the case when the duty cycle is zero and a voltage variation is detected at the renewable
system, the duty cycle of S
2
is set to minimum value, to permit the operation of the system.
4.3 Controlling the dc/dc boost converter
A sliding mode controller is employed for controlling the dc/dc boost converter, the main
switch (S
m
) is used for this purpose and the output voltage is tighly regulated. The sliding
mode control offers good characteristics to the system: fast regulation and robustness under
input voltage and load variations (Sira-Ramirez and Rios-Bolivar ,1994). The following
sliding surface and control law are used:
0
1
ziypx
ekekes
(1)
0
0
0
1
If
If
u
(2)
V
os
up?
Inicialization
P
os
down?
d
S2
up
d
S2
up
d
S2
down
yes
yes
no
yes
To bound d between 0 and 1
no
V
os
up?
d
s2
=0?
d
S2
d
min
yes
no
V
os
up?
P
os
up?
V
os
up?
Inicialization
P
os
down?
d
S2
up
d
S2
up
d
S2
down
yes
yes
no
yes
To bound d between 0 and 1
no
V
os
up?
d
s2
=0?
d
S2
d
min
yes
no
V
os
up?
P
os
up?
F
i
g
. 8. Flow dia
g
ram of the modified MPPT algorithm.
A DC/DC converter for clean-energy applications 9
Output power, which depends on the load, is not only constant for certain specific
conditions but also is bounded, so that the boost converter must be controlled in order to
regulate the output voltage and makes sure to maintain the required output voltage at the
load. All this is made by using a sliding mode controller in order to introduce a good
dynamic response to the system (Sira-Ramirez & Rios-Bolivar, 1994). The sliding surface
considered allows avoiding the use of current sensors (Vazquez et al., 2003).
In spite of weather conditions, output power must be maintained, so that the system takes in
consideration the battery set in order to supply the required energy which allows feed the
load properly. Auxiliary switches are turned on and off depending on the availability of the
renewable source, in order to be able to do this a modified MPPT algorithm, which is
performed with a microcontroller, is considered.
Modified MPPT not only defines the maximum power point (MPP) for the renewable source
but also established when the energy must be taken either from the two voltage sources or
just from a single one. Algorithm determines when the renewable source delivers the
possible maximum power in order to optimise its use and the battery set provides the
complement. Sometimes when the required load power is lower than the maximum and the
demanded energy can be obtained from the renewable source, the maximum point is not
tracked.
The system is turned off for safety purposes when energy is not enough to maintain the
system operation because the battery set is discharged.
(a) Modified MPPT algorithm
Figure 2 shows the renewable source behaviour for certain weather conditions, the output
power may be different depending on the load. The figure illustrates three points, where
each point represents a specific load power. If load requires power between points A and B,
then the photovoltaic/wind system is able to provide the total load power, this leads that
the system must be inside the curve behaviour of the renewable system and the maximum
point is not tracked. However, if load demands a power higher than the possible provided
from point B, as well it could be point C, then the battery provides the rest of power in order
to reach the total load power, especially at this point the renewable system must be operated
to track the MPP.
Operation mentioned before is achieved with aid of a modified MPPT algorithm; Figure 8
shows the flow chart. The method is based on the perturbation and observation technique,
voltage and power of the renewable source are used as inputs. Depending on system
conditions the duty cycle of auxiliary switch S
2
must be increased or decreased, it should be
notice that the other auxiliary switch (S
1
) has a complement operation in order to demand
the complement power from the battery set.
It is an important part of algorithm that duty cycle, due to its natural values, must be
bounded to a maximum and minimum value (1 and 0). Particularly when the duty cycle is
limited to a unity, the system is not tracking the MPP, then it operates inside the curve
behaviour (between points A and B). While algorithm is continuously sensing the voltage
and power, the duty cycle is set to the working condition.
For the case when the duty cycle is zero and a voltage variation is detected at the renewable
system, the duty cycle of S
2
is set to minimum value, to permit the operation of the system.
4.3 Controlling the dc/dc boost converter
A sliding mode controller is employed for controlling the dc/dc boost converter, the main
switch (S
m
) is used for this purpose and the output voltage is tighly regulated. The sliding
mode control offers good characteristics to the system: fast regulation and robustness under
input voltage and load variations (Sira-Ramirez and Rios-Bolivar ,1994). The following
sliding surface and control law are used:
0
1
ziypx
ekekes
(1)
0
0
0
1
If
If
u
(2)
V
os
up?
Inicialization
P
os
down?
d
S2
up
d
S2
up
d
S2
down
yes
yes
no
yes
To bound d between 0 and 1
no
V
os
up?
d
s2
=0?
d
S2
d
min
yes
no
V
os
up?
P
os
up?
V
os
up?
Inicialization
P
os
down?
d
S2
up
d
S2
up
d
S2
down
yes
yes
no
yes
To bound d between 0 and 1
no
V
os
up?
d
s2
=0?
d
S2
d
min
yes
no
V
os
up?
P
os
up?
F
i
g
. 8. Flow dia
g
ram of the modified MPPT algorithm.
Clean Energy Systems and Experiences10
Where:
xix
ektfe )(
,
ry
xxe
22
,
rz
xxe
22
,
)1()(
2
uxwatf
o
,
s
1
, k
c
and k
i
are the controller parameters
The dc/dc boost converter model is:
)1(
)1(
102
201
uxwbx
uxwax
(3)
Where:
offturnS
onturnS
u
m
m
0
1
Lix
L
1
,
Cvx
o
2
,
LCw
o
1
,
LVa
in
,
Cib
o
batwindin
VuVuV **
12
,
u
2
and u
1
are the control signals of the auxiliary switches
In order to make sure that operation of the sliding mode controller, an existance of the
sliding mode and an stability analysis must be done.
(a) The sliding mode existance
In order to verify the existance condition the following condition must be fulfilled (Sira-
Ramirez & Rios-Bolivar ,1994):
0
(4)
This last expression must be fulfilled, therefore control law values of (2) are taken into
account together with (3), and it is obtained next:
0 ;01
0 ;01
thenuIf
thenuIf
(5)
Using equations (1), (3) and (5) is obtained:
0)(1
2
221121
0
ri
xxkbasuxxs
w
(6)
With expressions (5) and (6) existence conditions are:
0
0
1210
rxxsw
r
(7)
Where:
ri
xexkbasr
221
(b) The stability analysis
The analysis of stability for the controller is made with the equivalent control; which is
substituted into the system model, and is verified under that condition.
The equivalent control is the control law when the system is into the sliding surface, and it is
obtained from
0
, however changing the control law (u) for the equivalent control u
eq
is
obtained:
121
0
221
2
)(
1
xxs
w
xxkbas
u
ri
eq
(8)
This analysis is beyond purposes for this communication, so it is not included, but the result
has to fulfill the following inequality:
11
0
sk
i
(9)
The inequality (9) is an approximation, but establishes a region where system is stable.
(c) The implemented circuit
Figure 9 shows the circuit for implementing expressions (1) and (2). There are four important
parts represented in blocks. Block A is used to obtain the funtion f(t) which emulates the
inductor current, block B determines the variable e
x
, the circuit for implementing equations (1)
and (2) is shown in the block C; an operational amplifier and a comparator are used. The
operational amplifier is employed for proportional and integral operation of voltage error and
comparator in order to obtain the control law. A soft start was performed with a capacitor, this
allows to the reference initiate in zero voltage condition at the start up.
u’
R
R
R
R
Block a
R
i
Rx
C
Block b
f(t)
e
x
TL084
TL084
TL084
Vref
TL084
R
R
R
i
Ri
LM311
Block c
V
o
Vin
TL082
TL082
u
+V
Q
Q
+V
Q
Q
+V
Block d
4538
u’
R
R
R
R
Block a
R
i
Rx
C
Block b
f(t)
e
x
TL084
TL084
TL084
Vref
TL084
R
R
R
i
Ri
LM311
Block c
V
o
Vin
TL082
TL082
u
+V
Q
Q
+V
Q
Q
+V
Block d
4538
Fig. 9. Implemented controller for the dc/dc boost converter.
A DC/DC converter for clean-energy applications 11
Where:
xix
ektfe
)(
,
ry
xxe
22
,
rz
xxe
22
,
)1()(
2
uxwatf
o
,
s
1
, k
c
and k
i
are the controller parameters
The dc/dc boost converter model is:
)1(
)1(
102
201
uxwbx
uxwax
(3)
Where:
offturnS
onturnS
u
m
m
0
1
Lix
L
1
,
Cvx
o
2
,
LCw
o
1
,
LVa
in
,
Cib
o
batwindin
VuVuV **
12
,
u
2
and u
1
are the control signals of the auxiliary switches
In order to make sure that operation of the sliding mode controller, an existance of the
sliding mode and an stability analysis must be done.
(a) The sliding mode existance
In order to verify the existance condition the following condition must be fulfilled (Sira-
Ramirez & Rios-Bolivar ,1994):
0
(4)
This last expression must be fulfilled, therefore control law values of (2) are taken into
account together with (3), and it is obtained next:
0 ;01
0 ;01
thenuIf
thenuIf
(5)
Using equations (1), (3) and (5) is obtained:
0)(1
2
221121
0
ri
xxkbasuxxs
w
(6)
With expressions (5) and (6) existence conditions are:
0
0
1210
rxxsw
r
(7)
Where:
ri
xexkbasr
221
(b) The stability analysis
The analysis of stability for the controller is made with the equivalent control; which is
substituted into the system model, and is verified under that condition.
The equivalent control is the control law when the system is into the sliding surface, and it is
obtained from
0
, however changing the control law (u) for the equivalent control u
eq
is
obtained:
121
0
221
2
)(
1
xxs
w
xxkbas
u
ri
eq
(8)
This analysis is beyond purposes for this communication, so it is not included, but the result
has to fulfill the following inequality:
11
0
sk
i
(9)
The inequality (9) is an approximation, but establishes a region where system is stable.
(c) The implemented circuit
Figure 9 shows the circuit for implementing expressions (1) and (2). There are four important
parts represented in blocks. Block A is used to obtain the funtion f(t) which emulates the
inductor current, block B determines the variable e
x
, the circuit for implementing equations (1)
and (2) is shown in the block C; an operational amplifier and a comparator are used. The
operational amplifier is employed for proportional and integral operation of voltage error and
comparator in order to obtain the control law. A soft start was performed with a capacitor, this
allows to the reference initiate in zero voltage condition at the start up.
u’
R
R
R
R
Block a
Ri
Rx
C
Block b
f(t)
e
x
TL084
TL084
TL084
Vref
TL084
R
R
R
i
Ri
LM311
Block c
Vo
Vin
TL082
TL082
u
+V
Q
Q
+V
Q
Q
+V
Block d
4538
u’
R
R
R
R
Block a
Ri
Rx
C
Block b
f(t)
e
x
TL084
TL084
TL084
Vref
TL084
R
R
R
i
Ri
LM311
Block c
Vo
Vin
TL082
TL082
u
+V
Q
Q
+V
Q
Q
+V
Block d
4538
Fig. 9. Implemented controller for the dc/dc boost converter.
Clean Energy Systems and Experiences12
Since the ideal sliding mode controller has an infinite switching frequency, a circuit to limit
is employed. For this purpose the block D is employed. Two CMOS logic circuits are used,
the timer 4538 and the NAND gate 4011.
An important part for the implementation is block A, for the f(t) term. A multiplying factor is
involved in the expression, however it is also easy to implement. Actually the control law
operates as if it was an analogue gate, which allows voltage appears or disappears with control
law. For implementing this part, two operational amplifiers and a diode are employed; the
diode with an operational amplifier makes same function as an analogue gate.
Summarizing, five integrated circuits are used; six operational amplifiers build it up into the
TL084 and TL082, a comparator (LM311), and two CMOS logic circuits 4538 and 4011.
4.4 The complete system
A block diagram for the implemented control system and the dc/dc converter analyzed is
shown in Figure 10. A microcontrolloer is used for performing the modified MPPT
algorithm, voltage and current of the renewable source are measured; additionally a sliding
mode controller is considered for regulating the output voltage of the dc/dc boost
converter.
4.5 Simulation and experimental evaluation
System functionality was not only mathematically simulated but also an experimental
prototype was built, so that converter operation was validated. Battery set voltage was 48V,
and a low power wind system is considered, the dc/dc converter output voltage was 250V,
the output power was 300V. Figures 11 through 15 shows some simulation and
experimental results.
Figure 11 illustrates operation when wind system proportionate all the energy. Inductor
current, output voltage and also control signal for the main switch are shown.
Figure 12 shows opertation when energy is provided from both input voltages. Inductor
current, output voltage, control signal for the main switch and control signal of the auxiliary
switches are also shown. It should be noticed that the auxiliary switches are operating at
low frequency and the main switch at high frequency.
S
2
Battery
set
S
1
Renewable
source
S
m
D
D
1
D
2
MMPPT
Controller
To S
1
To S
2
Slinding Mode
Controller
Set point
To S
m
S
2
Battery
set
S
1
Renewable
source
S
m
D
D
1
D
2
MMPPT
Controller
To S
1
To S
2
Slinding Mode
Controller
Set point
To S
m
Fig. 10. Block diagram of the implemented system.
Figure 13 shows experimental results when wind system deliver all the energy to the load.
The inductor current, output voltage and also control signal for the main switch are shown.
Figure 14 illustrates operation when energy is taken from both voltage sources. Output
voltage, inductor current, and also auxiliary swithces are shown.
Figure 15 shows a test when wind turbine changes its MPP due to a variation on weather
conditions, it is easily seen how the system is being automatically adapted. Energy delivered
Fig. 11. Simulated waveforms when only one input voltage is available: the inductor curren
t
(I
L
), output voltage (V
o
) and duty cycle (D). (From top to bottom).
Fig. 12. Simulated waveforms when two inputs are in use: inductor current (I
L
), output
voltage (V
o
), control signal of the main switch (S
m
) and control si
g
nals of the auxiliar
y
switches (S
2
, S
1
). (From top to bottom).
Fig. 13. Experimental waveforms when the wind system is only operating: the inductor
current (I
L
), output voltage (V
o
) and duty cycle (D). (From top to bottom).
A DC/DC converter for clean-energy applications 13
Since the ideal sliding mode controller has an infinite switching frequency, a circuit to limit
is employed. For this purpose the block D is employed. Two CMOS logic circuits are used,
the timer 4538 and the NAND gate 4011.
An important part for the implementation is block A, for the f(t) term. A multiplying factor is
involved in the expression, however it is also easy to implement. Actually the control law
operates as if it was an analogue gate, which allows voltage appears or disappears with control
law. For implementing this part, two operational amplifiers and a diode are employed; the
diode with an operational amplifier makes same function as an analogue gate.
Summarizing, five integrated circuits are used; six operational amplifiers build it up into the
TL084 and TL082, a comparator (LM311), and two CMOS logic circuits 4538 and 4011.
4.4 The complete system
A block diagram for the implemented control system and the dc/dc converter analyzed is
shown in Figure 10. A microcontrolloer is used for performing the modified MPPT
algorithm, voltage and current of the renewable source are measured; additionally a sliding
mode controller is considered for regulating the output voltage of the dc/dc boost
converter.
4.5 Simulation and experimental evaluation
System functionality was not only mathematically simulated but also an experimental
prototype was built, so that converter operation was validated. Battery set voltage was 48V,
and a low power wind system is considered, the dc/dc converter output voltage was 250V,
the output power was 300V. Figures 11 through 15 shows some simulation and
experimental results.
Figure 11 illustrates operation when wind system proportionate all the energy. Inductor
current, output voltage and also control signal for the main switch are shown.
Figure 12 shows opertation when energy is provided from both input voltages. Inductor
current, output voltage, control signal for the main switch and control signal of the auxiliary
switches are also shown. It should be noticed that the auxiliary switches are operating at
low frequency and the main switch at high frequency.
S
2
Battery
set
S
1
Renewable
source
S
m
D
D
1
D
2
MMPPT
Controller
To S
1
To S
2
Slinding Mode
Controller
Set point
To S
m
S
2
Battery
set
S
1
Renewable
source
S
m
D
D
1
D
2
MMPPT
Controller
To S
1
To S
2
Slinding Mode
Controller
Set point
To S
m
Fig. 10. Block diagram of the implemented system.
Figure 13 shows experimental results when wind system deliver all the energy to the load.
The inductor current, output voltage and also control signal for the main switch are shown.
Figure 14 illustrates operation when energy is taken from both voltage sources. Output
voltage, inductor current, and also auxiliary swithces are shown.
Figure 15 shows a test when wind turbine changes its MPP due to a variation on weather
conditions, it is easily seen how the system is being automatically adapted. Energy delivered
Fig. 11. Simulated waveforms when only one input voltage is available: the inductor curren
t
(I
L
), output voltage (V
o
) and duty cycle (D). (From top to bottom).
Fig. 12. Simulated waveforms when two inputs are in use: inductor current (I
L
), output
voltage (V
o
), control signal of the main switch (S
m
) and control si
g
nals of the auxiliar
y
switches (S
2
, S
1
). (From top to bottom).
Fig. 13. Experimental waveforms when the wind system is only operating: the inductor
current (I
L
), output voltage (V
o
) and duty cycle (D). (From top to bottom).
Clean Energy Systems and Experiences14
to the load from the emulated renewable source is higher than energy available before
variation, particularly for this case the battery set is providing energy too.
(a) Testing the modified MPPT algorithm
In spite of the waveform shown in Figure 15, system performance was evaluated with other
circuit with a known MPP. Mainly the reason for doing this is explained because in a wind
turbine or photovoltaic panel the MPP cannot be determined accurately under real
performance.
System behaviour in a real situation is relatively difficult to verify because depends on
weather conditions. In order to avoid this situation a simple laboratory emulator was
implemented, as shown in Figure 16. Emulator circuits consists of a voltage source with an
inductace and resistance in series with it, and a capacitor, where inductor and capacitor are
included for filtering purpose. In steady state the output power is determined by:
s
sosos
os
R
Vvv
P
2
(10)
Fig. 14. Experimental waveforms when two inputs are in use: output voltage (V
o
), inductor
current (I
L
), and control signal of the auxiliary switches. (From top to bottom).
Fig. 15. Experimental waveforms under variation of climatic conditions: Auxiliary signal S
1
,
out
p
ut of the renewable source, and auxiliar
y
si
g
nal S
2
.
(
From to
p
to bottom
)
.
Where: v
os
is the emulated output voltage,
V
s
is the input voltage, R
s
is the series resistance
Maximum power point occurs at the half of V
s
, and the power is:
s
s
MPP
R
V
P
4
2
(11)
When a different maximum power point is required to evaluate the performance, it is just
necessary to change the series resistance or the input voltage (V
s
). Then the system can be
tested under controlled circumstances and with a known MPP.
Figure 17 shows converter operation when the emulated renewable source is not providing
all the energy to the load and suddenly a variation is made. The system is adapted to the
new condition, as the MPP are known in each case and the system reach them, then its
reliability was verified.
Renewable
source
V
s
R
s
v
os
Renewable
source
V
s
R
s
v
os
Fig. 16. Emulator as renewable source.
Fig. 17. Experimental waveforms under simulated variation of climatic conditions: output
of the renewable source.
A DC/DC converter for clean-energy applications 15
to the load from the emulated renewable source is higher than energy available before
variation, particularly for this case the battery set is providing energy too.
(a) Testing the modified MPPT algorithm
In spite of the waveform shown in Figure 15, system performance was evaluated with other
circuit with a known MPP. Mainly the reason for doing this is explained because in a wind
turbine or photovoltaic panel the MPP cannot be determined accurately under real
performance.
System behaviour in a real situation is relatively difficult to verify because depends on
weather conditions. In order to avoid this situation a simple laboratory emulator was
implemented, as shown in Figure 16. Emulator circuits consists of a voltage source with an
inductace and resistance in series with it, and a capacitor, where inductor and capacitor are
included for filtering purpose. In steady state the output power is determined by:
s
sosos
os
R
Vvv
P
2
(10)
Fig. 14. Experimental waveforms when two inputs are in use: output voltage (V
o
), inductor
current (I
L
), and control signal of the auxiliary switches. (From top to bottom).
Fig. 15. Experimental waveforms under variation of climatic conditions: Auxiliary signal S
1
,
out
p
ut of the renewable source, and auxiliar
y
si
g
nal S
2
.
(
From to
p
to bottom
)
.
Where: v
os
is the emulated output voltage,
V
s
is the input voltage, R
s
is the series resistance
Maximum power point occurs at the half of V
s
, and the power is:
s
s
MPP
R
V
P
4
2
(11)
When a different maximum power point is required to evaluate the performance, it is just
necessary to change the series resistance or the input voltage (V
s
). Then the system can be
tested under controlled circumstances and with a known MPP.
Figure 17 shows converter operation when the emulated renewable source is not providing
all the energy to the load and suddenly a variation is made. The system is adapted to the
new condition, as the MPP are known in each case and the system reach them, then its
reliability was verified.
Renewable
source
V
s
R
s
v
os
Renewable
source
V
s
R
s
v
os
Fig. 16. Emulator as renewable source.
Fig. 17. Experimental waveforms under simulated variation of climatic conditions: output
of the renewable source.
Clean Energy Systems and Experiences16
5. References
Carrasco, J.M.; Garcia, L.; Bialasiewicz, J. T.; Galván, E.; Portillo, R. C.; Martín, Ma. A.; León,
J. I. & Moreno-Alfonso N. (2006). Power-Electronic Systems for the Grid Integration
of Renewable Energy Sources: A Survey, IEEE Transactions on Industrial Electronics,
Vol. 53, No. 4, August, 2006, pp 1002-1016, ISSN 0278-0046
Chen, Y.M.; Liu, Y.C. & YuWu, F. (2002). Multi- Input DC/DC Converter Based on the
Multiwinding Transformer for Renewable Energy Applications, IEEE transactions
on industry applications, Vol. 38, No. 4, July/August, 2002, pp 1096-1104, ISSN 0093-
9994
Chen, Y.M.; Liu, Y.C. & Lin, S.H. (2006). Double-Input PWM DC/DC Converter for High-
/Low-Voltage Sources, IEEE Transactions on Industrial Electronics, Vol. 53, No. 5,
October, 2006, pp 1538-1545, ISSN 0278-0046
Chen, Y.M.; Liu, Y.C.; Hung, S.C. & Cheng, C.S. (2007). Multi-Input Inverter for Grid
Connected Hybrid PV/Wind Power System, IEEE transactions on power electronics,
Vol. 22, No. 3, May, 2007, pp. 1070-1077, ISSN 0885-8933
Ertl, H.; Kolar, J. W. & Zach, F.C. (2002). A Novel Multicell DC–AC Converter for
Applications in Renewable Energy Systems, IEEE Transactions on industrial
Electronics, Vol. 49, No. 5, October, 2002, pp 1048-1057, ISSN 0278-0046
Femia, N.; Petrone, G.; Spagnuolo, G. & Vitelli, M. (2009). A Technique for Improving P&O
MPPT Performances of Double-Stage Grid-Connected Photovoltaic Systems, IEEE
Transactions on Industrial Electronics, Vol. 56, No. 11, November, 2009, pp 4473-4482,
ISSN 0278-0046
Kim, I.S.; Kim, M.B. & Youn, M.J. (2006). New Maximum Power Point Tracker Using
Sliding-Mode Observer for Estimation of Solar Array Current in the Grid-
Connected Photovoltaic System, IEEE Transactions on Industrial Electronics, Vol. 53,
No. 4, August, 2006, pp 1027-1035, ISSN 0278-0046
Kobayashi, K.; Matsuo, H. & Sekine, Y. (2006). Novel Solar-Cell Power Supply System Using
a Multiple-Input DC–DC Converter, IEEE Transactions on Industrial Electronics,
Vol.53, No. 1, February, 2006, pp 281-286, ISSN 0278-0046
Kwon, J.M.; Nam, K.H. & Kwon, B.H. (2006). Photovoltaic Power Conditioning System with
Line Connection, IEEE Transactions on Industrial Electronics, Vol. 53, No. 4, August,
2006, pp 1048-1054, ISSN 0278-0046
Pacheco, V. M.; Freitas, L. C.; Vieira Jr., J.B.; Coelho, E.A.A. & Farias, V.J. (2002). A DC-DC
Converter Adequate for Alternative Supply System Applications, Proceedings of
IEEE Applied Power Electronics Conference and Exposition, pp. 1074-1080, ISBN 0-7803-
7404-5, USA, March 2002, IEEE, Dallas
Park, J.H.; Ahn, J.Y.; Cho, B.H. & Yu, G.J. (2006). Dual-Module-Based Maximum Power
Point Tracking Control of Photovoltaic Systems, IEEE Transactions on Industrial
Electronics, Vol. 53, No. 4, August, 2006, pp 1036-1047, ISSN 0278-0046
Sira-Ramirez, H. & Rios-Bolivar, M. (1994). Sliding Mode Control of DC-to-DC Power
Converters via Extended Linearization, IEEE Transactions on Circuits and Systems
Part I: Fundamental Theory and Applications, Vol. 41, No. 10, October, 1994, pp. 652-
661, ISSN 1057-7122
Song, Y.J. & Enjeti, P.N. (2004). A High Frequency Link Direct DC-AC Converter for
Residential Fuel Cell Power Systems, Proceedings of IEEE Power Electronics Specialists
Conference, pp. 4755-4761, ISBN 0-7803-8399-0, Germany, June 2004, IEEE, Aachen
Vazquez, N.; Hernandez, C.; Alvarez, J. & Arau, J. (2003). Sliding Mode Control for DC/DC
Converters: A new Sliding Surface, Proceedings of IEEE International Symposium on
Industrial Electronics, pp. 422-426, ISBN 0-7803-7912-8, Brasil, June 2003, IEEE, Rio
de Janeiro
Walker, G.R. & Sernia, P.C. (2004). Cascaded DC–DC Converter Connection of Photovoltaic
Modules, IEEE Transactions on Power Electronics, Vol. 19, No. 4, July, 2004, pp 1130-
1139, ISSN 0885-8933
A DC/DC converter for clean-energy applications 17
5. References
Carrasco, J.M.; Garcia, L.; Bialasiewicz, J. T.; Galván, E.; Portillo, R. C.; Martín, Ma. A.; León,
J. I. & Moreno-Alfonso N. (2006). Power-Electronic Systems for the Grid Integration
of Renewable Energy Sources: A Survey, IEEE Transactions on Industrial Electronics,
Vol. 53, No. 4, August, 2006, pp 1002-1016, ISSN 0278-0046
Chen, Y.M.; Liu, Y.C. & YuWu, F. (2002). Multi- Input DC/DC Converter Based on the
Multiwinding Transformer for Renewable Energy Applications, IEEE transactions
on industry applications, Vol. 38, No. 4, July/August, 2002, pp 1096-1104, ISSN 0093-
9994
Chen, Y.M.; Liu, Y.C. & Lin, S.H. (2006). Double-Input PWM DC/DC Converter for High-
/Low-Voltage Sources, IEEE Transactions on Industrial Electronics, Vol. 53, No. 5,
October, 2006, pp 1538-1545, ISSN 0278-0046
Chen, Y.M.; Liu, Y.C.; Hung, S.C. & Cheng, C.S. (2007). Multi-Input Inverter for Grid
Connected Hybrid PV/Wind Power System, IEEE transactions on power electronics,
Vol. 22, No. 3, May, 2007, pp. 1070-1077, ISSN 0885-8933
Ertl, H.; Kolar, J. W. & Zach, F.C. (2002). A Novel Multicell DC–AC Converter for
Applications in Renewable Energy Systems, IEEE Transactions on industrial
Electronics, Vol. 49, No. 5, October, 2002, pp 1048-1057, ISSN 0278-0046
Femia, N.; Petrone, G.; Spagnuolo, G. & Vitelli, M. (2009). A Technique for Improving P&O
MPPT Performances of Double-Stage Grid-Connected Photovoltaic Systems, IEEE
Transactions on Industrial Electronics, Vol. 56, No. 11, November, 2009, pp 4473-4482,
ISSN 0278-0046
Kim, I.S.; Kim, M.B. & Youn, M.J. (2006). New Maximum Power Point Tracker Using
Sliding-Mode Observer for Estimation of Solar Array Current in the Grid-
Connected Photovoltaic System, IEEE Transactions on Industrial Electronics, Vol. 53,
No. 4, August, 2006, pp 1027-1035, ISSN 0278-0046
Kobayashi, K.; Matsuo, H. & Sekine, Y. (2006). Novel Solar-Cell Power Supply System Using
a Multiple-Input DC–DC Converter, IEEE Transactions on Industrial Electronics,
Vol.53, No. 1, February, 2006, pp 281-286, ISSN 0278-0046
Kwon, J.M.; Nam, K.H. & Kwon, B.H. (2006). Photovoltaic Power Conditioning System with
Line Connection, IEEE Transactions on Industrial Electronics, Vol. 53, No. 4, August,
2006, pp 1048-1054, ISSN 0278-0046
Pacheco, V. M.; Freitas, L. C.; Vieira Jr., J.B.; Coelho, E.A.A. & Farias, V.J. (2002). A DC-DC
Converter Adequate for Alternative Supply System Applications, Proceedings of
IEEE Applied Power Electronics Conference and Exposition, pp. 1074-1080, ISBN 0-7803-
7404-5, USA, March 2002, IEEE, Dallas
Park, J.H.; Ahn, J.Y.; Cho, B.H. & Yu, G.J. (2006). Dual-Module-Based Maximum Power
Point Tracking Control of Photovoltaic Systems, IEEE Transactions on Industrial
Electronics, Vol. 53, No. 4, August, 2006, pp 1036-1047, ISSN 0278-0046
Sira-Ramirez, H. & Rios-Bolivar, M. (1994). Sliding Mode Control of DC-to-DC Power
Converters via Extended Linearization, IEEE Transactions on Circuits and Systems
Part I: Fundamental Theory and Applications, Vol. 41, No. 10, October, 1994, pp. 652-
661, ISSN 1057-7122
Song, Y.J. & Enjeti, P.N. (2004). A High Frequency Link Direct DC-AC Converter for
Residential Fuel Cell Power Systems, Proceedings of IEEE Power Electronics Specialists
Conference, pp. 4755-4761, ISBN 0-7803-8399-0, Germany, June 2004, IEEE, Aachen
Vazquez, N.; Hernandez, C.; Alvarez, J. & Arau, J. (2003). Sliding Mode Control for DC/DC
Converters: A new Sliding Surface, Proceedings of IEEE International Symposium on
Industrial Electronics, pp. 422-426, ISBN 0-7803-7912-8, Brasil, June 2003, IEEE, Rio
de Janeiro
Walker, G.R. & Sernia, P.C. (2004). Cascaded DC–DC Converter Connection of Photovoltaic
Modules, IEEE Transactions on Power Electronics, Vol. 19, No. 4, July, 2004, pp 1130-
1139, ISSN 0885-8933
Clean Energy Systems and Experiences18
A dual-input DC-DC converter using clean energy power supplies 19
A dual-input DC-DC converter using clean energy power supplies
Kei Eguchi
0
A dual-input DC-DC converter
using clean energy power supplies
Kei Eguchi
Shizuoka University
Japan
1. Introduction
For small color displays in portable devices, white LEDs have been used to provide one
of the most ideal back-light solutions. To drive white LEDs in portable devices, switched-
capacitor (SC) DC-DC converters (Bong (2009); Chung (2009); Doms (2009); Eguchi (2009a;
2010a;b); Gregoire (2006); Min (2002); Myono (2001); Park (2009); Starzyk (2001); Tanzawa
(1997); Wei (2008); Yamada (2004); Yamakawa (2008)) have been used, because the capacitor-
based converter can be designed without a magnetic element. Although the power efficiency
of capacitor-based converters is inferior to that of inductor-based converters such as buck
converters, boost converters, etc., inductor-less design enables capacitor-based converters to
realize thin circuit composition, light-weight, no flux of magnetic induction, and so on.
In previous studies, single-input SC converters realizing step-up conversion (Chung (2009);
Eguchi (2010b); Min (2002); Myono (2001); Park (2009); Starzyk (2001); Tanzawa (1997); Wei
(2008)) have been used as a driver circuit of white LEDs. However, the single-input SC power
converter is difficult to improve power efficiency by adjusting a voltage conversion ratio
1
,
because the ratio of voltage conversion is predetermined by circuit structure. Therefore, the
single-input SC converter is difficult to realize long battery runtime.
To solve this problem, multiple-input parallel converters (Eguchi (2009b); Ishikawa (2007);
Kabe (2007); Qiu (2006)) using battery power supplies and clean energy power supplies have
been proposed, where solar energy is usually used in mobile devices as a clean energy source.
By converting solar energy, the multiple-input parallel converter can achieve long battery
runtime. However, the hardware-cost of the parallel converter increases in proportion to the
number of converter blocks although the parallel converter can be designed easily by con-
necting single SC DC-DC converters. Moreover, the parallel converter which consists of same
converter blocks is difficult to achieve the wide range of clean energy inputs, because the ratio
of the voltage conversion is predetermined by circuit structure although the value of input
voltages from solar-cells changes depending on the weather conditions. To utilize solar en-
ergy for back-lighting applications effectively, the SC DC-DC converter which can realize not
only small hardware-cost but also wide input-range is required.
In this chapter, a switched-capacitor-based serial DC-DC converter is proposed. The con-
verter consists of 2 converter blocks, where the Block-1 is the step-up/step-down SC DC-DC
1
To adjust the output voltage, pulse width modulation (PWM) scheme or on-resistance control scheme
is usually employed in the SC DC-DC converter.
2
Clean Energy Systems and Experiences20
C
L
S4
S5
S2
C1
S1
C2
Vin
(Battery)
S6 S3S7
S
switch
Vout
Fig. 1. Conventional single-input converter
Ratio Phase On Off
2×
Charging S
3
, S
4
, S
5
, S
7
S
1
, S
2
, S
6
Transfer S
1
, S
3
, S
4
, S
6
S
2
, S
5
, S
7
1.5×
Charging S
2
, S
5
, S
7
S
1
, S
3
, S
4
, S
6
Transfer S
1
, S
3
, S
4
, S
6
S
2
, S
5
, S
7
Table 1. Setting of clock pulses
converter using battery energy and the Block-2 is a quasi-switched-capacitor cell (Pan (2007))
using solar energy. The hardware-cost of the quasi-SC cell (Pan (2007)) is much smaller than
that of the conventional single-input converter (Chung (2009); Eguchi (2010b); Min (2002); My-
ono (2001); Park (2009); Starzyk (2001); Tanzawa (1997); Wei (2008)). Therefore, the proposed
converter can realize small hardware-cost. Furthermore, unlike conventional SC DC-DC con-
verters, the output voltage of the proposed converter is generated by adding the output volt-
age of the SC-based circuit to the voltage of solar-cells. In the Block-1, the voltage conversion
ratio is controlled according to the variation of the voltage of solar cells. Therefore, the pro-
posed converter can realize wide input-range.
Concerning the proposed serial converter, theoretical analyses and SPICE simulations are per-
formed to investigate the circuit characteristics. Furthermore, to confirm the validity of circuit
design, experiments are performed concerning the experimental circuit fabricated with com-
mercially available transistors on a bread board.
2. Circuit Structure
2.1 Single-Input Converter
Figure 1 shows an example of the single-input converter. The converter of figure 1 is one of
the most famous converters and is adopted for MAX1910, MAX1912
2
, and so on. According
to the control rule shown in Table 1, power switches S
1
∼ S
7
in figure 1 are driven by 2-phase
clock pulses, synchronously. By controlling S
1
∼ S
7
, the conventional converter shown in fig-
ure 1 generates 1.5
× /2× stepped-up voltages. However, as Table 1 shows, the single-input
converter is difficult to improve power efficiency further by adjusting a voltage conversion
2
MAX1910 and MAX1912 are 1.5 × /2× step-up converters produced by Maxim Integrated Products. In
mobile back-lighting applications, the stepped-up voltage such as 4.75
∼ 6.5 V (Typ. =5V) is required
to drive some LEDs from the voltage of a lithium battery. The typical voltage of the lithium battery
used in the mobile equipments is about 3.7 V.
C
L
Vout
Converter block-1
using battery energy
Converter block-2
using solar energy
Vin2
(Solar cell)
V
in1
(Battery)
S4
S5
S2
C1
S1
C2
S6 S3S7
S
switch
Output
(Vout)
(Vin)
Input
(a) Block diagram (b) Converter block
Fig. 2. Conventional multiple-input parallel converter
ratio, because the ratio of the voltage conversion is predetermined by circuit structure. There-
fore, since the single-input converter only consumes energy stored in the battery, it is difficult
for the single-input converter to realize long battery runtime.
2.2 Parallel-Connected Converter
To realize long battery runtime, the multiple-input converter has been proposed (Ishikawa
(2007); Kabe (2007); Qiu (2006)). As described in (Ishikawa (2007); Kabe (2007); Qiu (2006)), the
multiple-input converter can be designed easily by connecting single-input DC-DC converters
in parallel.
Figure 2 shows an example of the multiple-input parallel converter designed by using
switched-capacitor (SC) techniques, where battery energy and solar energy are used as in-
put energy sources. The multiple-input converter can realize long battery runtime, because
the consumption of battery energy is suppressed by converting solar energy. However, the
hardware-cost of the parallel converter increases in proportion to the number of converter
blocks. Furthermore, the parallel converter which consists of same converter blocks is difficult
to realize the wide range
3
of clean energy inputs, because the ratio of the voltage conversion
is predetermined by the circuit structure of converter blocks although the voltage of solar-cells
changes depending on the weather conditions.
Of course, the parallel converters can achieve the wide input range by connecting different
kinds of converters according to input sources. However, although the wide input range is re-
alized by using different kinds of converters, the problem of hardware-cost cannot be solved.
To make matters worse, this approach not only causes the complexity of circuit control but
also ruins the simplicity of circuitry. To utilize solar energy effectively, the SC DC-DC con-
verter which can realize not only small hardware-cost but also wide input-range is required.
2.3 Proposed Converter
Figure 3 shows the proposed serial DC-DC converter. The converter consists of 2 converter
blocks, where the Block-1 is the step-up/step-down SC DC-DC converter using battery energy
and the Block-2 is a switched-capacitor-based converter using solar energy. Unlike conven-
tional converters, the output voltage of the proposed converter is generated by adding the
3
Only when V
in2
≥ V
tag
/2, the conventional converter of figure 2 can offer the stepped-up voltage V
tag
to drive some LEDs from clean energy power supplies. Concretely, the voltage from solar-cells, V
in2
,
must be more than 2.5 V when target output voltage V
tag
is 5 V.
A dual-input DC-DC converter using clean energy power supplies 21
C
L
S4
S5
S2
C1
S1
C2
Vin
(Battery)
S6 S3S7
S
switch
Vout
Fig. 1. Conventional single-input converter
Ratio Phase On Off
2
×
Charging S
3
, S
4
, S
5
, S
7
S
1
, S
2
, S
6
Transfer S
1
, S
3
, S
4
, S
6
S
2
, S
5
, S
7
1.5×
Charging S
2
, S
5
, S
7
S
1
, S
3
, S
4
, S
6
Transfer S
1
, S
3
, S
4
, S
6
S
2
, S
5
, S
7
Table 1. Setting of clock pulses
converter using battery energy and the Block-2 is a quasi-switched-capacitor cell (Pan (2007))
using solar energy. The hardware-cost of the quasi-SC cell (Pan (2007)) is much smaller than
that of the conventional single-input converter (Chung (2009); Eguchi (2010b); Min (2002); My-
ono (2001); Park (2009); Starzyk (2001); Tanzawa (1997); Wei (2008)). Therefore, the proposed
converter can realize small hardware-cost. Furthermore, unlike conventional SC DC-DC con-
verters, the output voltage of the proposed converter is generated by adding the output volt-
age of the SC-based circuit to the voltage of solar-cells. In the Block-1, the voltage conversion
ratio is controlled according to the variation of the voltage of solar cells. Therefore, the pro-
posed converter can realize wide input-range.
Concerning the proposed serial converter, theoretical analyses and SPICE simulations are per-
formed to investigate the circuit characteristics. Furthermore, to confirm the validity of circuit
design, experiments are performed concerning the experimental circuit fabricated with com-
mercially available transistors on a bread board.
2. Circuit Structure
2.1 Single-Input Converter
Figure 1 shows an example of the single-input converter. The converter of figure 1 is one of
the most famous converters and is adopted for MAX1910, MAX1912
2
, and so on. According
to the control rule shown in Table 1, power switches S
1
∼ S
7
in figure 1 are driven by 2-phase
clock pulses, synchronously. By controlling S
1
∼ S
7
, the conventional converter shown in fig-
ure 1 generates 1.5
× /2× stepped-up voltages. However, as Table 1 shows, the single-input
converter is difficult to improve power efficiency further by adjusting a voltage conversion
2
MAX1910 and MAX1912 are 1.5 × /2× step-up converters produced by Maxim Integrated Products. In
mobile back-lighting applications, the stepped-up voltage such as 4.75
∼ 6.5 V (Typ. =5V) is required
to drive some LEDs from the voltage of a lithium battery. The typical voltage of the lithium battery
used in the mobile equipments is about 3.7 V.
C
L
Vout
Converter block-1
using battery energy
Converter block-2
using solar energy
Vin2
(Solar cell)
V
in1
(Battery)
S4
S5
S2
C1
S1
C2
S6 S3S7
S
switch
Output
(Vout)
(Vin)
Input
(a) Block diagram (b) Converter block
Fig. 2. Conventional multiple-input parallel converter
ratio, because the ratio of the voltage conversion is predetermined by circuit structure. There-
fore, since the single-input converter only consumes energy stored in the battery, it is difficult
for the single-input converter to realize long battery runtime.
2.2 Parallel-Connected Converter
To realize long battery runtime, the multiple-input converter has been proposed (Ishikawa
(2007); Kabe (2007); Qiu (2006)). As described in (Ishikawa (2007); Kabe (2007); Qiu (2006)), the
multiple-input converter can be designed easily by connecting single-input DC-DC converters
in parallel.
Figure 2 shows an example of the multiple-input parallel converter designed by using
switched-capacitor (SC) techniques, where battery energy and solar energy are used as in-
put energy sources. The multiple-input converter can realize long battery runtime, because
the consumption of battery energy is suppressed by converting solar energy. However, the
hardware-cost of the parallel converter increases in proportion to the number of converter
blocks. Furthermore, the parallel converter which consists of same converter blocks is difficult
to realize the wide range
3
of clean energy inputs, because the ratio of the voltage conversion
is predetermined by the circuit structure of converter blocks although the voltage of solar-cells
changes depending on the weather conditions.
Of course, the parallel converters can achieve the wide input range by connecting different
kinds of converters according to input sources. However, although the wide input range is re-
alized by using different kinds of converters, the problem of hardware-cost cannot be solved.
To make matters worse, this approach not only causes the complexity of circuit control but
also ruins the simplicity of circuitry. To utilize solar energy effectively, the SC DC-DC con-
verter which can realize not only small hardware-cost but also wide input-range is required.
2.3 Proposed Converter
Figure 3 shows the proposed serial DC-DC converter. The converter consists of 2 converter
blocks, where the Block-1 is the step-up/step-down SC DC-DC converter using battery energy
and the Block-2 is a switched-capacitor-based converter using solar energy. Unlike conven-
tional converters, the output voltage of the proposed converter is generated by adding the
3
Only when V
in2
≥ V
tag
/2, the conventional converter of figure 2 can offer the stepped-up voltage V
tag
to drive some LEDs from clean energy power supplies. Concretely, the voltage from solar-cells, V
in2
,
must be more than 2.5 V when target output voltage V
tag
is 5 V.
Clean Energy Systems and Experiences22
C
L
Vout
Converter block-1
using battery energy
Converter block-2
using solar energy
Vin2
(Solar cell)
V
in1
(Battery)
(Quasi-SC cell)
(Stpe-up/step-down
SC converter)
(a) Block diagram
S4
C
3
C
1
C
2
S1
S2
S9
S10
S6
S3
S7
S8
S5
Vout
C
4
Quasi-SC cell
using solar energy
(Block-2)
Vin1
Step-up/step-down DC-DC converter
using battery input (Block-1)
Vin2
(b) Circuit structure
Fig. 3. Proposed dual-input serial converter
output voltage of an SC-based circuit to the voltage of solar-cells. According to the voltage of
solar-cells, the proposed converter changes the operation modes as shown in Table 2, where
V
tag
(Typ. =5V) denotes the target output voltage ( 3V
in1
/2) to drive LEDs.
To realize the operation modes shown in Table 2, power switches S
1
∼ S
10
in figure 3 are
driven by 2-phase clock pulses, synchronously. By controlling S
1
∼ S
10
, the proposed con-
verter performs a step-up DC-DC conversion. Table 3 shows the setting of clock pulses. In
Table 3, the interval of Charging
(= State − T1) and Trans fer (= State − T2) is set to
T
= T1 + T2,
T1
= DT,
and T2
= (1 − D)T, (1)
where D and T denote the duty factor and the period of the clock pulses, respectively.
Input voltage V
in2
Conversion ration
Block-1 Block-2
Mode-1
2V
tag
3
≤ V
in2
1
2
× 1×
Mode-2
V
tag
3
≤ V
in2
<
2V
tag
3
1
× 1×
Mode-3 V
in2
<
V
tag
3
3
2
× 0×
Table 2. Setting of conversion ratio
Phase On Off
Mode-1
Charging (State
− T1) S
1
, S
2
, S
3
, S
4
S
5
, S
6
, S
7
, S
8
, S
9
, S
10
Transfer (State − T2) S
5
, S
6
, S
7
, S
8
S
1
, S
2
, S
3
, S
4
, S
9
, S
10
Mode-2
Charging (State
− T1) S
1
, S
2
, S
3
, S
4
S
5
, S
6
, S
7
, S
8
, S
9
, S
10
Transfer (State − T2) S
2
, S
6
, S
7
S
1
, S
3
, S
4
, S
5
, S
8
, S
9
, S
10
Mode-3
Charging (State
− T1) S
1
, S
2
, S
3
S
4
, S
5
, S
6
, S
7
, S
8
, S
9
, S
10
Transfer (State − T2) S
7
, S
8
, S
9
, S
10
S
1
, S
2
, S
3
, S
4
, S
5
, S
6
Table 3. Setting of clock pulses
Figure 4 shows the comparison concerning the input range of figures 2 and 3. As figure 4
shows, the proposed converter can extend the input range of V
in2
from V
in2
≥ V
tag
/2 to
V
in2
≥ V
tag
/3. Concretely, in comparison with the conventional parallel converter using 1.5×
step-up converters, the proposed converter can achieve 16% extension of input range.
Furthermore, the proposed converter can realize small hardware-cost. Table 4 shows the com-
parison concerning the hardware-cost of figures 2 and 3. As Table 4 shows, the hardware-cost
of the proposed converter is less than 80 % of that of the conventional converter.
The circuit properties of the proposed serial converter will be described in the following sec-
tion.
3. Theoretical Analysis
First, the equivalent circuit of the proposed converter is analyzed. To save space, only the
analysis for Mode-1 is described in this section
4
. In the theoretical analysis, we assume that
1. parasitic elements are negligibly small and 2. time constant is much larger than the period
of clock pulses.
Figure 5 shows instantaneous equivalent circuits of the proposed converter. In figure 5, R
on
5
denotes the on-resistance of power switches.
4
The theoretical analysis for Mode-2 and Mode-3 will be described in Appendix.
5
SC power converters are known as an implementable converter, because they do not require magnetic
elements. In the converter block implemented into a chip, the direction of fluctuation in on-resistances
is almost the same. Therefore, to simplify the theoretical analysis, we assume that all the power switches
have the same on-resistances.