Wind Turbines Part 2 docx
Bạn đang xem bản rút gọn của tài liệu. Xem và tải ngay bản đầy đủ của tài liệu tại đây (2.12 MB, 40 trang )
Wind Turbines
30
under technology transfer arrangements started with a 20 percent local content requirement
and a goal of an increase to 80 percent as learning on the Chinese side progressed [25,32].
China’s recent large government wind tenders, referred to as wind concessions, have a local
content requirement that has been increased to 70 percent from an initial 50 percent
requirement when the concession program began in 2003. Local content is also required to
obtain approval of most other wind projects in the country, with the requirement recently
increased from 40 to 70 percent [25].
3. Wind market growth rates
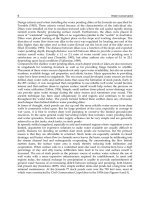
An important indicator for the vitality of the wind market is the growth rate in relation to
the installed capacity of the previous year. The growth rate went up steadily since the year
2004, reaching 29.0 % in 2008, after 26.6 % in 2007, 25.6 % in the year 2006 and 23.8 % in
2005. However, this increase in the average growth rate is mainly due to the fact that the
two biggest markets showed growth rates far above the average: USA 50 % and China 107 %
(Fig. 2). Bulgaria showed the highest growth rate with 177 %, however, starting from a low
level. Also Australia, Poland, Turkey and Ireland showed a dynamic growth far above the
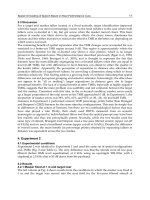
average [30]. Figure 3 shows that world wind market growth rate in 1999 was the highest
and then was decreased to the year 2004 which was the lowest. Since 2004 it has had a slight
increase. It is also interesting to know that growth rate for Turkey in 2007 was a lot more
than 2008.
Between 1991 and 1995 both the average list price of wind turbines and turnkey investment
costs of wind farms in Germany have declined steadily by about 8–9% per year. However,
average prices remained rather stable since 1995. In fact, the price of the cheapest turbine
available even increased during 1995–1999. There are a number of possible explanations for
these trends. In Germany, more and more wind parks are situated in inland areas with
Fig. 2. Top ten countries with highest growth rate [30].
Productivity and Development Issues of Global Wind Turbine Industry
31
Fig. 3. World market growth rate in % [30].
lower wind speeds, due to a lack of appropriate sites near the coast. While in 1993, 70% of all
new wind parks (in terms of capacity) were installed in coastal regions, this share has
dropped to a mere 10–15% in 1999 [36,37]. The wind energy sector is one of the fastest-
growing energy sectors in the world. From 1991 until the end of 2002, global installed
capacity has increased from about 2GW [38] to over 31GW [39], with an average annual
growth rate of about 26%. During this period, both prices of wind turbines and cost of wind-
generated electricity have been reduced. In spite of these developments, electricity derived
from wind is not yet able to fully compete with electricity produced from fossil fuel.
However, this may change in the near future [36, 40].
In terms of countries, the ‘big five’ (Germany, Spain, Denmark, the USA and India) have
been at the top for the last decade (from 1995 to 2005). In these countries over 80% of the
worldwide wind-based power generation capacity was installed in 2005 [36, 39]. The
expansion of renewable energies requires additional investments into production facilities
as well as into the transportation and distribution grid .Since the majority of renewable
energy technologies is not profitable at current energy prices, its furtherance is not only
associated with production and employment effects but with increasing cost as well. It is
apparent that the cost disadvantage of renewable compared to conventional energies is
crucially dependent on future prices of energies used in power plants as well as on the
amount of CO
2
emission permits [63, 64].
4. Installed wind turbines worldwide (2007- 2008)
The share of new installed capacity for USA and China with 31.62% and 23.83% respectively
accounts for more than half of the other countries in the world for 2008 (Fig 4).
The USA and China took the lead, USA taking over the global number one position from
Germany and China getting ahead of India for the first time, taking the lead in Asia. The
USA and China accounted for 50.8 % of the wind turbine sales in 2008 and the eight leading
markets represented almost 80 % of the market for new wind turbines. One year ago, still
only five markets represented 80 % of the global sales. The pioneer country Denmark fell
Wind Turbines
32
back to rank 9 in terms of total capacity, whilst until four years ago it held the number 4
position during several years (Fig. 5). However, with a wind power share of around 20 % of
the electricity supply, Denmark is still a leading wind energy country worldwide [30].For
the year 2008, USA was in top position following by Germany, Spain, China, India, Italy,
France, UK, Denmark and Portugal. But Germany was in top position in 2007.
Fig. 4. Share of countries new installed capacity for 2008 [30]
Fig. 5. Top ten wind turbine installed countries (MW) [30].
Productivity and Development Issues of Global Wind Turbine Industry
33
5. World installation of wind turbines for 2006
The global wind energy market experienced yet another record year in 2006, demonstrating
a growth of 32% over 2005 figures. According to the statistics (Table 2) issued by the Global
Wind Energy Council (GWEC), 2006 saw the installation of 15197 megawatts (MW) of new
capacity, taking total installed wind energy capacity to 74,223 MW. In terms of economic
value, the wind energy sector is now established as an important player in the energy
market, the GWEC says. The total value of new generating equipment installed in 2006 was
worth €18 billion (US$23 billion). The countries with the highest total installed capacity are
Germany (20,621 MW), Spain (11,615 MW), the USA (11,603 MW), India (6,270 MW) and
Denmark (3,136 MW). Thirteen countries around the world have now passed 1000 MW level
for installed capacity. In terms of new capacity added in 2006, the USA led the way with
2,454 MW, followed by Germany (2,233 MW), India (1,840 MW), Spain (1,587 MW), China
(1,347 MW) and France (810 MW). These figures show that new players such as China and
France are gaining ground [41]. By the end of 2006, cumulative installed wind capacity of
China had reached 2.6GW; the average annual growth rate over the past ten years has been
46%. Between 2004 and 2006, China's ranking in the world wind energy league moved up
from the top 10 to the top 6, and the country is planning to host some of the biggest wind
farms in the world. At the present growth rate, the 2010 target will be reached two years
earlier. Wind power has not just contributed to supplying electricity but has lowered supply
costs, reduced carbon emissions and helped to limit air pollution [42].
New capacity MW Market share (%)
USA 2454 16.1
Germany 2233 14.7
India 1840 12.1
Spain 1587 10.4
China 1347 8.9
France 810 5.3
Canada 776 5.1
Portugal 694 4.6
UK 634 4.2
Italy 417 2.7
Top 10 total 12 792 84.2
Rest of world 2405 15.8
World total 15 197
Table 2. Installed capacity of top countries for January-December 2006 [41].
5.1 Europe
Europe was the leading player in the market, with 48,545 MW of installed capacity at the
end of 2006 – 65% of the global total. In 2006, European wind capacity grew by 19%,
producing approximately 100 TWh of electricity, equal to 3.3% of total European Union (EU)
electricity consumption in an average wind year. “While Germany and Spain still
represented 50% of the EU market, there was healthy trend towards less reliance on these
two countries," says Christian Kjaer, the European Wind Energy Association’s (EWEA)
CEO. "In the EU, 3,755 MW was installed outside of Germany, Spain and Denmark in 2006.
Wind Turbines
34
In 2002, this figure still stood at only 680 MW [41].The figures show that most of the
European countries were serious about investing into wind market.
Following the agreement reached in March 2008 by the Heads of State [43], the European
Union has committed itself to achieving, by 2020, that 20% of the energy it consumes comes
from renewable energies and that its CO
2
emissions are cut by 20% in comparison with 1990
levels (30% if other developed countries join the effort) [44].Wind is the most dynamic
renewable energy in Europe and in the world; it already covers 3% of electricity demand in
the EU—up to 23% in Denmark and around 8% in Spain and Germany [45] and is the
second largest attractor of energy investments after natural gas [44,46]. Germany with total
amount of 20,622 MW, Spain with 11,615 MW and Denmark with 3,136 MW installed wind
power capacity were in top positions in Europe. It shows that there was a tremendous need
for renewable energies like wind in order to combat high price of fossil fuel. Europe with
48,545 MW of installed wind power capacity in 2006 was in top position which is admirable.
5.2 Asia
Asia experienced the strongest increase in installed capacity outside of Europe, with an
addition of 3,679 MW. This took the continent's total to over 10,600 MW. In 2006, wind
capacity in Asia grew by 53% and accounted for 24% of new installations. The strongest
market remains India, which installed over 1,840 MW of new capacity in 2006, increasing its
total to 6,270 MW. China more than doubled its total installed capacity in 2006, taking it up
to 2,604 MW by installing 1,347 MW of capacity, making it the sixth largest market
worldwide. The Chinese market was boosted by the country’s new Renewable Energy Law,
which entered into force on 1 January 2006 [41].
In 2006, the burning of coal produced two-thirds of the primary energy consumed in China.
Even with improvements in end-use energy efficiency, energy demand continues to grow
and so does the air pollution. In China, pollution is causing serious health problems; crop
damage and acid rain, all of which are taking a social and economic toll [42]. Air pollution
has been a very serious problem in China, therefore government has implemented new
regulations toward using renewable energies in order to decrease co
2
.They plan to have
5,000 MW of wind energy by the year 2010. India with total amount of 6,270 MW, China
with 2604 MW and Japan with 1394 MW installed wind power capacity were in top
positions in Asia. It shows that there was a great effort and attention in these countries
toward using wind energy. The reason might be high cost of fossil fuel which was imported
from Persian Gulf countries.
5.3 North America
North America accounted for 22% of the world’s new installed wind capacity in 2006. For
the second year running, the US wind energy industry installed nearly 2,500 MW, making it
the country with the most new wind power. “Wind’s exponential growth reflects the
nation’s increasing demand for clean, safe and domestic energy, and continues to attract
both private and public sources of capital,” comments Randy Swisher, president of the
American Wind Energy Association (AWEA). “New generating capacity worth US $4 billion
was installed in 2006, billing wind as one of the largest sources of new power generation in
the country – second only to natural gas – for the second year in a row.” Canada also had a
record year, with the installed capacity more than doubling from 683 MW in 2005 to 1459
MW at the end of 2006. “Wind energy is an emerging Canadian success story and 2006 will
Productivity and Development Issues of Global Wind Turbine Industry
35
be remembered as the year that our country first began to seriously capture its economic
and environmental benefits,” according to Robert Hornung, president of the Canadian Wind
Energy Association (CanWEA). “Canada’s on the cusp of a wind energy boom as provincial
governments are now targeting to have a minimum of 10,000 MW of installed wind energy
capacity in place by 2015” [41]. USA with total amount of 11,603 MW and Canada with 1,459
MW installed wind power capacity were only countries in North America.
5.4 Latin America and Caribbean
Brazil with total amount of 237 MW, Mexico with 88 MW and Costa Rica with 74 MW
installed wind power capacity were in top positions in Latin America & Caribbean. It shows
that there was not tendency for wind turbine installation in this part of the world. Reason
could be high resources of fossil fuel in countries like Mexico and also great attention
toward manufacturing of methanol in Brazil.
5.5 Rest of the world
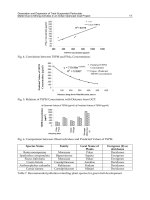
According to table 3, growth in the relatively young African and Middle Eastern market
picked up considerably in 2006, with 172 MW of new installed capacity, bringing the total
up to 441 MW. This represents a 63% growth. The main countries experiencing increases
are Egypt, Morocco and Iran. Compared to previous years, the Australian market only
experienced slow growth in 2006 [41].Egypt with total amount of 230 MW , Morocco with
124 MW and Iran with 48 MW installed wind power capacity were in top positions in
Africa and Middle East. It shows that there was not too much attention in other countries in
theses regions toward using wind energy. Australia with total amount of 817 MW, New
Zealand with 171 MW and Pacific Island with 12 MW installed wind power capacity were in
top positions in Pacific Region. Australia has been active in field of wind energy.
Country Total end 2005 New 2006 Total end 2006
Africa & middle east
Egypt 145 85 230
Morocco 64 60 124
Iran 23 27 48
Tunisia 20 0 20
Other 11 0 11
Total 271 172 441
Asia
India 4430 1840 6270
China 1260 1347 2604
Japan 1061 333 1394
Taiwan 104 84 188
South Korea 98 75 173
Philippines 25 0 25
Other 13 0 13
Total 6990 3679 10667
Europe
Germany 18415 2233 20622
Spain 10028 1587 11615
Wind Turbines
36
Country Total end 2005 New 2006 Total end 2006
Denmark 3128 12 3136
Italy 1718 417 2123
UK 1332 634 1963
Portugal 1022 694 1716
France 757 810 1567
Netherland 1219 356 1560
Austria 819 146 965
Greece 573 173 746
Ireland 496 250 745
Sweden 510 62 572
Norway 267 47 314
Belgium 167 26 193
Poland 83 69 153
Rest of Europe 364 192 556
Total Europe 40898 7708 48545
Out of which UE- 27 40512 7611 48062
Latin America & Caribbean
Brazil 29 208 237
Mexico 3 85 88
Costa Rica 71 3 74
Caribbean (w/o Jamaica) 35 - 35
Argentina 27 - 27
Colombia 20 - 20
Jamaica 20 - 20
Other 7 - 7
Total 212 296 508
North America
USA 9149 2454 11603
Canada 683 776 1459
Total 9832 3230 13062
Pacific region
Australia 708 109 817
New Zealand 169 3 171
Pacific island 12 - 12
Total 889 112 1000
Word total 59091 15197 74223
Table 3. Global installed wind power capacity (MW)- regional distribution[41].
6. World installation of wind turbines for 2008
In terms of continental distribution, a continuous diversification process can be watched as
well: In general, the focus of the wind sector moves away from Europe to Asia and North
America. Europe (Fig 6) decreased its share in total installed capacity from 65.5 % in 2006 to
61 % in the year 2007 further down to 54.6 % in 2008. Only four years ago Europe dominated
the world market with 70.7 % of the new capacity. In 2008 the continent lost this position
Productivity and Development Issues of Global Wind Turbine Industry
37
and, for the first time, Europe (32.8 %), North America (32.6 %) and Asia (31.5 %) account
for almost similar shares in new capacity. However, Europe is still the strongest continent
while North America and Asia are increasing rapidly their shares. The countries in Latin
America and Africa counted for respectively only 0.6 % and 0.5 % of the total capacity and
fell back in terms of new installations down to respectively only 0.4 % and 0.3 % of the
additional capacity installed worldwide in the year 2008[30]. Wind energy generating
capacity in the US increased from about 2,500 MW in 1999 to about 21,000MW in mid 2008
and about 28,000MW in early 2009. At the same time, the costs of installed utility- scale
wind projects (in constant $/kW) declined until the early 2000s and then generally increased
[21, 47, 48]. Mass production is likely to play a significant role for future cost reductions. In
the last 5 years, wind farms of several hundred MW capacities have been realized in Spain
and the USA [36]. Since the majority of renewable energy technologies are not profitable at
current energy prices, its furtherance is not only associated with production and
employment effects but with increasing cost as well. It is apparent that the cost
disadvantage of renewable compared to conventional energies is crucially dependent on
future prices of energies used in power plants as well as on the amount of CO
2
emission
permits [19, 20].Australian share in this regards is more than share of both Latin America
and Africa.
Fig. 6. Continental share of total installed capacity 2008[30].
6.1 Europe
Europe lost its dominating role as new market but kept its leading position in terms of total
installation with 66’160 MW. Germany and Spain maintained as leading markets, both
showing stable growth. The most dynamic European markets were Ireland (adding 440 MW,
55 % growth) and Poland (196 MW added, 71 % growth), the first Eastern European country
with a substantial wind deployment. All in all, the European wind sector showed almost
stagnation with a very small increase in added capacity from 8,607 MW to 8,928 MW. The
biggest market Germany is expected, after the amendment of the renewable energy law EEG,
to show bigger market growth in 2009. An encouraging change happened in the UK where the
Wind Turbines
38
government announced the introduction of a feed-in tariff for community based renewable
energy projects. However, the cap of 5 MW represents a major hurdle so that the UK wind
market will still grow at moderate rates. However, without additional incentives for wind
power in more EU member states, such as improved feed-in legislation, the European Union
may not be able to achieve its 2020 targets for renewable energy [30].It goes without saying
that most of the European countries were in top positions in 2008. Germany and Spain were in
second and third position with total capacity installed of 23,902.8 and 16740.3 MW
respectively. But Germany with 22,247.4 MW and Spain with 15,147.4 MW of total capacity
installed for 2007 were in first and third positions. Italy, France, United Kingdom, Denmark
and Portugal were in position of six to ten respectively for 2008.It shows great effort of
European countries toward using wind energy for electricity production. Recently, because of
the global economic crisis, some wind turbine manufacturing companies in Europe dismissed
the workers and decreased production lines in order to combat the crisis.
6.2 Asia
Asia with the two leading wind countries China and India and 24,439 MW of installed
capacity is in a position of becoming the worldwide locomotive for the wind industry. China
has again doubled its installations and Chinese domestic wind turbine manufacturers have
started for the first time to export their products. It can be expected that in the foreseeable
future Chinese and Indian wind turbine manufacturers will be among the international top
suppliers.
The Indian market has shown robust and stable growth in the year 2008. It has already a well-
established wind industry which already plays a significant and increasing role on the world
markets. Further countries like South Korea (already with 45 % growth rate in 2008) start
investing on a larger scale in wind energy and it can be observed that more and more
companies are developing wind turbines and installing first prototypes. In parallel with the
market growth in the country, it can be expected that also new manufacturers will be able to
establish themselves. The World Wind Energy Conference held on Jeju Island in June 2009 is
expected to push the development in the region. Pakistan installed its first wind farm in the
year 2008 and the Government of the country aims at further wind farms in the near future
[30]. China has chosen wind power as an important alternative source in order to rebalance the
energy mix, combat global warming and ensure energy security. Supportive measures
have been introduced. In order to encourage technical innovation, market expansion and
commercialization, development targets have been established for 2010 and 2020, concession
projects offered and policies Introduced to encourage domestic production [42].
China with 12,210.0 MW and India with 9,587.0 MW of total capacity installed in 2008 were
in positions of fourth and fifth in the world. Japan, South Korea and Iran with total installed
capacities of 1,880.0 MW, 278 MW and 823 MW respectively were in positions of 13, 27 and
35 in the world for 2008(Table 3). The positions of Japan and South Korea for year 2007 were
same as 2008, but Iran had position of 34 in 2007. Philippine, Israel, Pakistan, Jordan,
Indonesia, Mongolia, Kazakhstan, Syria and South Korea were among the Asian countries
with wind turbine activities in 2008.
6.3 North America
North America showed very strong growth in the year 2008, more than doubling its
capacity since 2006 to 27,539 MW. Breaking two world records, the USA became the new
number one worldwide in terms of added as well as in terms of total capacity. More and
Productivity and Development Issues of Global Wind Turbine Industry
39
more US states are establishing favorable legal frameworks for wind energy and try to
attract investors in manufacturing facilities. It can be expected that the new President
Obama administration will improve substantially the political frameworks for wind power
in the country, especially for those types of investors that have practically been excluded
from the production tax credit scheme, like farmers, smaller companies or community based
projects. The credit crunch, however, may lead to delays in project development in the short
term. The Canadian government has rather been hesitating. However, among the Canadian
provinces Quebec and Ontario are showing increasing commitment towards an accelerated
deployment of wind energy. In Quebec, contracts for new projects were signed for a total of
2000 MW, the first to be operational by 2011[30].USA with total installed capacity of 25,170
MW and Canada with 2369 MW in 2008 were in positions of 1
st
and 11
th
in the world. But for
the year 2007, USA was in position of 2
nd
and Canada in position of 11
th
.
6.4 Latin America
Many Latin American markets still showed stagnation in the year 2008 and the overall
installed capacity (667 MW) in the region accounts for only 0.5 % of the global capacity.
Only Brazil and Uruguay installed major wind farms in the year 2008. This slow wind
deployment is especially dangerous for the economic and social prospects of the region as in
many countries people are already suffering from power shortages and sometimes do not
have access to modern energy services at all. However, in some countries like Argentina,
Brazil, Chile, Costa Rica or Mexico many projects are under construction thus putting lights
in the forecast for 2009[30]. Brazil with 338.5 MW and Mexico with 85.0 MW of total capacity
installed in 2008 were in positions of 24
th
and 34
th
in the world. Costa Rica, Argentina,
Uruguay and Chile with total installed capacities of 74.0 MW, 29.8 MW, 20.5 MW and 20.1
MW respectively were in positions of 37,41, 46 and 47 in the world for 2008(Table 4).
6.5 Africa
In spite of the huge potentials all over the continent, with world’s best sites in the North and
South of the continent, wind energy plays still a marginal role on the continent with 563
MW of total capacity. Several major wind farms can be found in some of the North African
countries like Morocco, Egypt or Tunisia. In the year 2009 and 2010, substantial increases
can be expected from projects which are already in the development stage. However, so far,
the emergence of domestic wind industry in African countries is only in a very early stage.
However, it is interesting to see that companies from the region are showing an increasing
interest and have started investing in the wind sector. In Sub-Saharan Africa, the installation
of the first wind farm in South Africa operated by an Independent Power Producer can be
seen as a major breakthrough. The South African government prepares the introduction of a
feed-in tariff which would create a real market, enable independent operators to invest and
thus play a key role in tackling the country’s power crisis. In the mid-term, small,
decentralized and stand-alone wind energy systems, in combination with other renewable
energies, will be key technologies in rural electrification of huge parts of so far unserved
areas of Africa. [30]. Egypt with 390.0 MW and Morocco with 125.2 MW of total capacity
installed in 2008 were in positions of 21
st
and 32
nd
in the world (Table 4). South Africa,
Tunisia, Nigeria, Eritrea and Namibia with total installed capacities of 21.8 MW, 20.0MW ,
2.2 MW, 0.8 MW and 0.5 MW respectively were in positions of 43, 48 , 64, 69 and 72 in the
world for 2008.
Wind Turbines
40
6.6 Australia and Oceania
The region showed encouraging growth rates, reaching 1,819 MW by the end of 2008, most of
it thanks to Australia. Commitments made by the Australian government to increase their
efforts in climate change mitigation and expansion of renewable energies create the
expectation that the Australian wind energy market will show further robust growth also in
the coming years. New Zealand, after a change in government, may, however, face major
delay in its switch to renewable energy [30]. Australia with 1494 MW and New Zealand with
325.3 MW of total capacity installed in 2008 were in positions of 14
th
and 26
th
in the world.
Australia was in position of 16
th
and New Zealand was in position of 20
th
for the year 2007.
Position
2008
Country
Total
Capacity
installed
end 2008
Added
Capacity
2008
Growth
Rate
2008
Position
2007
Total
Capacity
installed
end 2007
Total
Capacity
installed
end 2006
Total
Capacity
installed
end 2005
[MW] [MW] [%] [MW] [MW] [MW]
1 USA 25170.0 8351.2 49.7 2 16818.8 11603.0 9149.0
2 Germany 23902.8 1655.4 7.4 1 22247.4 20622.0 18427.5
3 Spain 16740.3 1595.2 10.5 3 15147.4 11630.0 10027.9
4 China 12210.0 6298.0 106.5 5 5912.0 2599.0 1266.0
5 India 9587.0 1737.0 22.1 4 7850.0 6270.0 4430.0
6 Italy 3736.0 1009.9 37.0 7 2726.1 2123.0 1718.0
7 France 3404.0 949.0 38.7 8 2455.0 1567.0 757.2
8 United kingdom 3287.9 898.9 37.6 9 2389.0 2123.4 1353.0
9 Denmark 3160.0 35.0 1.1 6 3125.0 1567.0 3128.0
10 Portugal 2862.0 732.0 34.4 10 2130.0 1962.0 1022.0
11 Canada 2369.0 523.0 28.3 11 1846.0 3136.0 638.0
12 The Netherlands 2225.0 478.0 27.4 12 1747.0 1716.0 1224.0
13 Japan 1880.0 352.0 23.0 13 1528.0 1460.0 1040.0
14 Australia 1494.0 676.7 82.8 16 817.3 1559.0 579.0
15 Ireland 1244.7 439.7 54.6 17 805.0 1309.0 495.0
16 Sweden 1066.9 235.9 28.4 18 831.0 817.3 509.0
17 Austria 994.9 13.4 1.4 14 981.5 746.0 819.0
18 Greece 989.7 116.5 13.3 15 873.3 964.5 573.3
19 Poland 472.0 196.0 71.0 24 276.0 757.6 73.0
20 Norway 428.0 95.1 28.5 19 333.0 153.0 268.0
21 Egypt 390.0 80.0 25.8 21 310.0 230.0 145.0
22 Belgium 383.6 78.3 33.7 22 286.9 194.3 167.4
23 Chinese Taipei 358.2 96.7 28.0 23 297.9 187.7 103.7
24 Brazil 338.5 91.5 37.0 25 247.1 236.9 28.6
25 Turkey 333.4 126.6 61.2 26 206.8 64.6 20.1
26 New Zealand 325.3 3.5 1.1 20 321.8 171.0 168.2
27 Korea (south) 278.0 85.9 44.7 27 192.1 176.3 119.1
28 Bulgaria 157.5 100.6 176.7 33 56.9 36.0 14.0
29 Czech Republic 150.0 34.0 29.3 28 116.0 56.5 29.5
30 Finland 140.0 30.0 30.3 29 110.0 86.0 82.0
31 Hungary 127.0 62.0 95.4 35 65.0 60.9 17.5
32 Morocco 125.2 0.0 0.0 36 125.2 64.0 64.0
33 Ukraine 90.0 1.0 1.1 30 89.0 85.6 77.3
34 Mexico 85.0 0.0 0.0 31 85.0 84.0 2.2
35 Iran 823.0 15.5 23.3 34 66.5 47.4 31.6
36 Estonia 78.3 19.7 33.6 37 58.6 33.0 33.0
Productivity and Development Issues of Global Wind Turbine Industry
41
Position
2008
Country
Total
Capacity
installed
end 2008
Added
Capacity
2008
Growth
Rate
2008
Position
2007
Total
Capacity
installed
end 2007
Total
Capacity
installed
end 2006
Total
Capacity
installed
end 2005
37 Costa Rica 74.0 0.0 0.0 32 74.0 74.0 71.0
38 Lithuania 54.4 2.1 4.0 38 52.3 55.0 7.0
39 Luxembourg 35.3 0.0 0.0 39 35.3 35.3 35.3
40 Latvia 30.0 2.6 9.5 41 27.4 27.4 27.4
41 Argentina 29.8 0.0 0.0 40 27.8 27.8 27.8
42 Philippines 25.2 0.0 0.0 42 25.2 25.2 25.2
43 South Africa 21.8 5.2 31.4 49 16.6 16.6 16.6
44 Jamaica 20.7 0.0 0.0 43 20.7 20.7 20.7
45 Guadeloupe 20.5 0.0 0.0 44 20.5 20.5 20.5
46 Uruguay 20.5 19.9 3308.3 68 0.6 0.2
47 Chile 20.1 0.0 0.0 46 20.1 2.0 2.0
48 Tunisia 20.0 0.0 0.0 45 20.0 20.0 20.0
49 Colombia 19.5 0.0 0.0 47 19.5 19.5 19.5
50 Croatia 18.2 1.0 5.8 48 17.2 17.2 6.0
51 Russia 16.5 0.0 0.0 50 16.5 15.5 14.0
52 Switzerland 13.8 2.2 19.2 53 11.6 11.6 11.6
53 Guyana 13.5 0.0 0.0 51 13.5 13.5 13.5
54 Curacao 12.0 0.0 0.0 52 12.0 12.0 12.0
55 Romania 7.8 0.0 0.0 54 7.8 2.8 0.9
56 Israel 6.0 0.0 0.0 55 6.0 7.0 7.0
57 Pakistan 6.0 0.0 New New 0.0 0.0 0.0
58 Slovakia 5.1 6.0 2.8 56 0.5 5.0 5.0
59 Faroe Islands 4.1 0.1 0.0 57 4.1 4.1 4.1
60 Ecuador 4.0 0.9 3.7 58 3.1 0.0 0.0
61 Cuba 3.2 5.1 242.9 61 2.1 0.5 0.5
62 Cape Verde 2.8 0.0 0.0 59 2.8 2.8 2.8
63 Mongolia 2.4 2.4 new New 0.0 0.0 0.0
64 Nigeria 2.2 0.0 0.0 60 2.2 2.2 2.2
65 Jordan 2.0 0.0 0.0 62 2.0 1.5 1.5
66 Indonesia 1.2 0.2 20.0 65 1.0 0.8 0.8
67 Martinique 1.1 0.0 0.0 63 1.1 1.1 1.1
68 Belarus 1.1 0.0 0.0 64 1.1 1.1 1.1
69 Eritrea 0.8 0.0 0.0 66 0.8 0.8 0.8
70 Peru 0.7 0.0 0.0 67 0.7 0.7 0.7
71 Kazakhstan 0.5 0.0 0.0 69 0.5 0.5 0.5
72 Namibia 0.5 0.0 6.4 70 0.3 0.3 0.3
73 Netherland Antilles 0.3 0.0 0.0 71 0.0 0.0 0.0
74 Syria 0.3 0.0 0.0 72 0.03 0.03 0.03
75 North Korea 0.2 0.2 2010.0 73 0.01 0.01 0.01
76 Bolivia 0.01 0.0 0.0 74 0.0 0.0 0.0
Total 121187.9 27261.1 29.0 93926.8 74150.8 59024.1
Table 4. Total capacity installed and position of countries [30].
7. Employment issues regarding wind energy
Wind energy is often said to have positive effects on employment, but few studies have
systematically dealt with this matter [26]. The development of renewable energy industries
Wind Turbines
42
and saving energy technologies became a way to achieve environmental objectives and a
means of increasing energy self-sufficiency and employment (e.g. [49 and 50 to 55]. The use
of renewable energies offers the opportunity to diminish energy dependence, reduce the
emission of CO2 and create new employment. The involvement of local agents is highly
important for the future development in this field, especially in regions whose industrial
mix was based on traditional energy sources [49]. Wind industry in Europe is a
predominantly male business with 78% employment, where men make up majority of the
labor in fields of construction, production and engineering.
One fundamental advantage of wind energy is that it replaces expenditure on mostly
imported fossil or nuclear energy resources by human capacities and labor. Wind energy
utilization creates many more jobs than centralized, non-renewable energy sources. The
wind sector (Fig. 7) worldwide has become a major job generator: Within only three years,
the wind sector worldwide almost doubled the number of jobs from 235,000 in 2005 to
440’000 in the year 2008. These 440,000 employees in the wind sector worldwide, most of
them highly skilled jobs, are contributing to the generation of 260 TWh of electricity [30].
Fig. 7. Wind energy jobs worldwide [30].
The wind energy sector has grown exponentially since the end of the 1990s, especially
within the European Union (EU), and this has affected the employment levels of the regions
involved[26]. The expansion of renewable energies requires additional investments into
production facilities as well as into the transportation and distribution grid [19].
Unemployment rates around 10% shifted the focus of the analysis of the economic effects of
the German Renewable Energy Sources Act (EEG) on labor market effects, and several
studies have analyzed these effects [56 to 59] These earlier studies either focused on the
effects of electricity only, or modeled the end of the German feed-in tariff system and focus
on the development until 2010 [60]. Wind energy represents an attractive source of
employment in Europe. Since a number of activities (construction, O&M, legal and
environmental studies) are best dealt with at local level, there will always be a positive co-
relation between the location of the wind farm and the number of jobs it creates. The
Productivity and Development Issues of Global Wind Turbine Industry
43
decision of where to locate large manufacturing centers, however, seems to rely on other,
often microeconomic factors, and this is where regional and municipal authorities have a
role to play. Another relevant point is that wind energy employment is following the
opposite trend to the general energy sector, particularly coal extraction and electricity
generation, and measures that encourage the transfer of workers from general energy to
wind energy will be highly beneficial from both social and economic point of view
[26].Manufacturers and component manufacturers (Fig. 8) with 37% and 22% respectively
make up the highest share of direct jobs in wind energy .Service companies are the third
largest category, followed by project developers. Operation and Maintenance (O&M) with
11% is in next category.
Fig. 8. Direct employment by type of company in EU [26].
The development of any new industry, including wind power, can create new domestic job
opportunities, and wind development is often credited with creating more jobs per dollar
invested and per kilowatt-hour generated than fossil fuel power generation [61]. Direct jobs
are typically created in three areas: manufacturing of wind power equipment, constructing
and installing the wind projects, and operating and maintaining the projects over their
lifetime [25].
In addition, there are limited global locales possessing a skilled labor force in wind power,
with Denmark still representing a unique hub of skilled laborers and an experienced
network of key components suppliers to support turbine manufacturers. Suzlon recently
decided to base its international headquarters in Denmark to take advantage of this
knowledge base, even though it has stated that it is unlikely to sell its turbines to the Danish
market [25, 62].Wind energy companies in the EU employed around 104,350 people in 2008.
This represents a growth of 226% with respect to 2003 [26]. Germany with total No. of 38,000
persons employed directly in wind industry is leader in Europe (Table 5). Spain and
Denmark are also countries with high employment rates in wind energy business too.
Wind Turbines
44
Country No. of Direct Jobs
Austria 750
Belgium 2000
Bulgaria 100
Czech 100
Denmark 17000(23500)
Finland 800
France 6000
Germany 38000
Greece 1800
Hungary 100
Ireland 1500
Italy 3000
Netherlands 2000
Poland 800
Portugal 3000
Spain 20500
Sweden 2000
UK 4500
Rest of world 400
Table 5. Summary of employment profiles (direct jobs) in different EU member states [26, 50
to 55]
8. Implementation of wind turbines in buildings
A new design of a Darrieus turbine in buildings is known as Crossflex [Fig. 9 & 10] which
has an innovative system for the blades. This turbine can be located on corners and ridges of
the buildings which creates an interesting aesthetic view.
Most iterations of the Darrieus form have placed the turbine on a mast. Its disadvantage is
requirement for a rigid foundation, because it causes bending stress on the shaft. Also, it
causes high localized loads on the building structure when mounted on buildings [65].
To maximize the number of potential locations that may be exploited, and to enable variable
positioning to exploit augmented airflows, the design of the cowl also allows considerable
flexibility in the positioning of the turbine. Fig. 11 shows a variety of positions on a 90◦
corner. This could be horizontal mounting on roof pitches from flat to 45º; horizontal
mounting on parapet edges; or vertical mounting on building corners in plan. This enables
placement where concentration of wind occurs, for example, rising flow up vertical surfaces,
or toward the prevailing wind direction on building corners or ridges. A significant
development of the Crossflex concept is the new design and placement of the turbine within
a cowling and the general arrangement is shown in Fig. 12. Omitting the shaft is an
advantage of this system [65]. There are numerous advantages of Crossflex over
conventional Darrieus turbines in terms of performance and usability. This system is at its
early stage, but needs more future work. It is a promising technique for future buildings.
Productivity and Development Issues of Global Wind Turbine Industry
45
Fig. 9. Architectural integration corner [65].
Fig. 10. Architectural integration parapet and ridge [65].
Wind Turbines
46
Fig. 11. Variable placement options [65].
Fig. 12. Front and side elevations [65].
9. Conclusion
Renewable energy sources have been facing a growing attention in global energy markets
due to many benefits associated with their importance. During past few years, a great
attention was paid toward using wind energy in many countries around the world.USA;
Germany, India and China were among the countries which were more successful in order
to install wind turbines in recent years. It should be noted that other countries like Bulgaria
Productivity and Development Issues of Global Wind Turbine Industry
47
and Turkey had the highest growth rate for 2008 and 2007 respectively. In general, the focus
of the wind sector moves away from Europe to Asia and North America. Europe decreased
its share in total installed capacity from 65.5 % in 2006 to 61 % in the year 2007 further down
to 54.6 % in 2008. Only four years ago Europe dominated the world market with 70.7 % of
the new capacity. In 2008 the continent lost this position and, for the first time, Europe (32.8
%), North America (32.6 %) and Asia (31.5 %) account for almost similar shares in new
capacity. Europe lost its dominating role as new market but kept its leading position in
terms of total installation with 66,160 MW. Asia with the two leading wind countries China
and India and 24,439 MW of installed capacity is in a position of becoming the worldwide
locomotive for the wind industry. In spite of the huge potentials all over the Africa, with
world’s best sites in the North and South of the continent, wind energy plays still a marginal
role on the continent with 563 MW of total capacity. Australia showed encouraging growth
rates, reaching 1,819 MW by the end of 2008. Many Latin American markets still showed
stagnation in the year 2008 and the overall installed capacity (667 MW) in the region
accounts for only 0.5 % of the global capacity. North America showed very strong growth in
the year 2008, more than doubling its capacity since 2006 to 27,539 MW. The wind sector
worldwide has become a major job generator. Within only three years, the wind sector
worldwide almost doubled the number of jobs from 235,000 in 2005 to 440,000 in the year
2008.Wind energy represents an attractive source of employment in many countries in the
world. There are some activities like operation and maintenance (O&M), research and
development (O&M), manufacturing and construction which are able to create jobs in wind
industries.
10. References
[1] Held A, Faber T, Panzer C, Toro F, Haas R, Resch G. Potentials and prospects for
renewable energies at global scale. Energy Policy 2008; 36: 4048–56.
[2] Ozer S, Tosun M. Feasibility study of wind farms: A case study for Izmir, Turkey Baris
Ozerdem. Journal of Wind Engineering and Industrial Aerodynamics 2006; 94: 725–
43.
[3] Usha Rao K, Kishore VVN. Wind power technology diffusion analysis in selected states
of India. Renewable Energy 2009; 34: 983–88.
[4] Pullen A. Global wind 2005 report. Global Wind Energy Council. <www.gwec. net>;
2005; 1–50.
[5] Breton SP, Moe G. Status, plans and technologies for offshore wind turbines in Europe
and North America. Renewable Energy 2009; 34: 646–54.
[6] National Wind Energy Coordinating Committee, Permitting Wind Energy Facilities—A
Handbook, NWCC Siting Subcommittee. <www.nationalwind.org>; March 1998.
[7] Honnery D, Moriarty P. Estimating global hydrogen production from wind.
International journal o f hydrogen energy 2009; 34: 727–36.
[8] De Vries BJ, Van Vuuren D, Hoogwijk MM. Renewable energy sources: their potential for
the first half of the 21st century at a global level: an integrated approach. Energy
Policy 2007; 35: 2590–610.
[9] Moriarty P, Honnery D. Can renewable energy avert global climate change?.
International clean air conference, Hobart, Tasmania. Clean Air Society of Australia
and New Zealand; May 2005.
Wind Turbines
48
[10] BTM Consult ApS. International Wind Energy Development, World Market Update
2004; March 2005.
[11] Intergovernmental Panel on Climate Change (IPCC). Climate change 2001: mitigation.
Cambridge, UK: Cambridge University Press; 2001.
[12] Seyit A, Akdaga, Dinler A. A new method to estimate Weibull parameters for wind
energy applications. Energy Conversion and Management 2009; 50: 1761–66.
[13] World Wind Energy Association. Wind turbines generate more than 1% of the global
electricity. <http:// www.wwindea.org>: Press Release: February 2008.
[14] Carta JA, Ramírez P, Velázquez S. A review of wind speed probability distributions
used in wind energy analysis. Renewable and Sustainable Energy Reviews 2009;
13(5): 933–55.
[15] Petersen LE. Wind power meteorology. Roskilde (Denmark): Risoe National Laboratory
Press; 1997.
[16] Ohlhorst D, Bruns E, Schon S, Koppel J. Wind energie boomin Deutsch land. Peter Lang
publishing; 2008, p. 5–60
[17] Nitsch J. ‘‘Leitstudie 2008: Weiterentwicklung der ‘‘Ausbaustrategie Erneuer- bare
Energien’’ vor dem Hintergrund der aktuellen Klimaschutzziele Deutsch- lands
und Europas,’’. Berlin; 2008.
[18] Portman ME, Duff JA, Koppel J, Reisert J, Higgins ME. Offshore wind energy
development in the exclusive economic zone: Legal and policy supports and
impediments in Germany and the US. Energy Policy 2009; 37: 3596–607.
[19] Hillebrand_B, Buttermann HG, Behringer JM, Bleuel M. The expansion of renewable
energies and employment effects in Germany. Energy Policy 2006; 34: 3484–94.
[20] European Parliament. Directive 2004/101/EC of the European Parliament and the
Council of 27 October 2004 amending directive 2003/87/EC establishing a scheme
for greenhouse gas emission allowance trading within the Community, in respect
of the Kyoto Protocol’s project mechanisms. L 338/18. Brussels; 2004.
[21] Berry D. Innovation and the price of wind energy in the US. Energy Policy 2009, doi:
10.1016/ j.enpol.2009.05.071.
[22] Thresher R, Robinson M, Veers P. Wind Energy Technology: Current Status and R&D
Future. National Renewable Energy Laboratory. Golden, CO (NREL/CP- 500-
43374); 2008.
[23] International Energy Agency (IEA). Wind energy annual report 2003. <
www.ieawind.org/iea >; 2004.
[24] Zhao ZU, Hua J, Zuo J. Performance of wind power industry development in China: A
Diamond Model study. Renewable Energy 2009; 34: 2883–91.
[25] Lewisa JI, Wiserb RH. Fostering a renewable energy technology industry: An
international comparison of wind industry policy support mechanisms. Energy
Policy 2007; 35: 1844–57.
[26] Blanco MI, Rodriguez G. Direct employment in the wind energy sector: An EU study.
Energy Policy 2009; 37: 2847–57.
[27] Global wind energy outlook 2008. Green Peace International, DLR and Ecofys; October
2008.
[28] Investing in Renewable Technologies: Wind, Solar, Geothermal, Hydro, Biomass.
Renewable Energy Reports <www.energybusinessreports.com>; September 9, 2009.
Productivity and Development Issues of Global Wind Turbine Industry
49
[29] The 8th World Wind Energy Conference 2009 (WWEC2009) on Jeju island/South Korea
the World Wind Energy Association (WWEA); 2009.
[30] World Wind Energy Association (WWEA); 2008.
[31] Cavaliero C, DaSilva E. Electricity generation: regulatory mechanisms to incentive
renewable alternative energy sources in Brazil. Energy Policy 2005; 33: 1745–52.
[32] Lew D. Alternatives to coal and candles: wind power in China. Energy Policy 2000; 28:
271–86.
[33] Rogner H H. Energy resources. In: World Energy Assessment—2004 update. United
Nations Development Programme, United Nations Department of Economic and
Social Affairs, World Energy Council, chapter 5; 2004.
[34] Grubb M, Meyer N. Resources, systems and regional strategies. Renewable Energy.
Sources for Fuels and Electricity. Island Press, Washington, DC. Wind energy 1993:
157–212.
[35] Haefele W. Energy in a finite world: a global systems analysis. Report by the Energy
Systems Group of the International Institute for Applied Systems Analysis.
Ballinger Publishing Company, Vol. 2, Cambridge, MA: 1981.
[36] Junginger M, Faaij A, Turkenburg WC. Global experience curves for wind farms.
Energy Policy 2005; 33: 133–150.
[37] Durstewitz M, Hoppe-Kilpper M. Bericht zur Markt- und Kosten entwicklung bei
Windenergie anlagen. Kassel, Institut fur Solare Energie versorgungs technik e.V.
(ISET); 2002.
[38] EWEA (European Wind Energy Association). Wind Energy: The Facts. London; 1997.
[39] Milborrow D, Tishler C, Harrison L, O’Bryant M. The Windicator. Wind power
Monthly, April 2003.
[40] Turkenburg WC, Beurskens J, Faaij A, Fraenkel P, Fridleifsson I, Lysen E, Mills D,
Moreira JR, Nilsson LJ, Schaap A, Sinke WC. World Energy Assessment. Chapter 7:
Renewable energy technologies. World Energy Assessment. Goldemberg J.
Washington, DC, UND; 2000, P. 220–72.
[41] Global Wind Energy Council (GWEC). <www.gwec.net >; April 2007.
[42] China Renewable Energy Market Outlook.
< >; May 2008.
[43] Council of the European Union, 7224/1/07 Rev: Brussels European Council, 8–9 March
2007. Presidency Conclusions. <www.consilium.europa.eu >; 2007.
[44] Blanco MI, Rodriguez G. Can the future EU ETS support wind energy investments?
.Energy Policy 2008; 36: 1509–20.
[45] European Wind Energy Association (EWEA). Wind Map in Europe, 2006.
< www.ewea.org>; 2007.
[46] Platts. Platts Power Vision; March 2007.
[47] Lemming J. Cost reduction potentials in wind. Presentation at the IEA Technology
Learning and Deployment Workshop, Paris; 2007.
[48] Wiser R, Bolinger M. Annual report on US wind power installation, cost, and
performance trends: 2007. Energy Efficiency and Renewable Energy, US
Department of Energy, Washington, DC; 2008.
[49] Moreno B, Lopez AJ. The effect of renewable energy on employment. The case of
Asturias (Spain). Renewable and Sustainable Energy Reviews 2008; 12: 732–51.
Wind Turbines
50
[50] Connor PM. UK renewable energy policy: a review. Renewable and Sustainable Energy
Reviews 2003; 7:65–82.
[51] Dincer I. Renewable energy and sustainable development: a crucial review. Renewable
and Sustainable Energy Reviews 2000; 4:157–75.
[52] Hillebrand B, Buttermann HG, Behringer JM, Bleuel M. The expansion of renewable
energies and employment effects in Germany. Energy Policy 2006; 34:3484–94.
[53] Laitner S, Bernow B, Cicco JD. Employment and other macroeconomic benefits of an
innovation-led climate strategy for the United States. Energy Policy 1998; 26: 425–
32.
[54] Lenzen M, Dey CJ. Economic, energy and greenhouse emissions impacts of some
consumer choice, technology and government outlay options. Energy Econom
2002; 24: 377–403.
[55] Thothathri R. The wind brought jobs and prosperity. New Energy 1999; 4: 28–30.
[56] Pfaffenberger W. Wertscho¨ pfung und Bescha¨ ftigung durch gru¨ ne
Energieproduktion? Energiewirtschaftliche tagesfragen ; 2006, p. 22–6.
[57] Pfaffenberger W, Nguyen K, Gabriel J. Ermittlung der Arbeitspla¨ tze und Bescha¨
ftigungswirkungen im Bereich erneuerbarer Energien. Studie des bremer energie
instituts im Auftrag der Hans- Bo¨ ckler-Stiftung; 2003.
[58] Hillebrand B, Buttermann HG, Behringer JM, Bleuel M. The expansion of renewable
energies and employment effects in Germany. Energy Policy 2006; 34 (18): 3484–94.
[59] Fahl U, Kuster R, Ellersdorfer I. Jobmotor O¨ kostrom? Bescha¨ ftigungseffekte der Fo¨
rderung von erneuerbaren Energien in Deutschland. Energiewirtschaftliche
Tagesfragen 2005; 55 (7):476–81.
[60] Lehr U, Nitsch J, Kratzat M, Lutz C, Edler D. Renewable energy and employment in
Germany. Energy Policy 2008; 36: 108–17.
[61] Singh V, Fehrs J. The Work that Goes into Renewable Energy. Renewable Energy Policy
Project Research Report 14, November 2001.
[62] Wind power Monthly (WPM). Denmark picked for global headquarters. Wind power
Monthly News Magazine A/S, Denmark. October 2004:25.
[63] Stern N. The economics of climate change. American Economic Review 2008; 98 (2): 1–
37.
[64] Mc Kinsey Global Institute. The carbon productivity challenge; 2008.
[65] Sharpea T, Proven G. Crossflex: Concept and early development of a true building
integrated wind Turbine. Energy and Buildings 2010; 42: 2365–2375.
[66] US Wind power < >; 2010.
3
Adaptive Bend-Torsional Coupling Wind
Turbine Blade Design Imitating the Topology
Structure of Natural Plant Leaves
Wangyu Liu and Jiaxing Gong
South China University of Technology
China
1. Introduction
In the wind turbine system, the size of the blade is determined by the level of single output
power. With the rise of offshore wind turbines (Breton & Moe, 2009), the output power of
commercial blade has reached 5MW, and the length of the blade is over 100m. The design
and manufacture limit of large-scale wind turbine is facing severe challenges, and as a
result, wind turbine blade has become a research focus of scholars from all over the world.
In a poor working environment, the problems of large blades in the following two aspects,
which occur in the process of operation, will become more and more prominent.
1. In the operation, the blade should bear a good rigidity in order to minimize the
destruction that random wind load and gust may cause to the blade (Bishop et al, 1999).
Knut (1999) points out that due to the increasing length of wind turbine blade, the blade
becomes more vulnerable to the unpredictable destruction caused by random gusts and
ultimate wind load. And since the fatigue test of the blade has its limitations, therefore,
he proposed a kind of random probability model based on bad working conditions to
predict the fatigue life and reliability of the series of blades (Ronold & Larsen, 2000).
Christoph (2006)
points out that the length and weight of large-scale blade have an
increasing impact on the bending load withstood internally. Meanwhile, it becomes
more and more difficult for the large blades, which are subjected to wind, rain,
moisture, and other adverse environmental effects, to meet the design requirements of a
20-year basic fatigue life. In order to predict the fatigue life of blade more accurately,
apart from the unidirectional fiber, he has also made some research on the S-N curve of
the off-axis fiber which bears the shear load. In addition, the research on the blade
fatigue and damage mechanism has also been attached importance to by domestic and
foreign researchers. For example, Daniel (2008), Raif (2008)
and other scholars have
delved into the fatigue and destruction data and the interlayer destruction mechanism
of glass fiber and carbon fiber. They point out that both the technology of blade fiber
manufacture and the adaptability of the blade have an important impact on the fatigue
and destruction of the blade.
Thus with the wind turbine blade becoming lager and larger, it becomes more and more
difficult to maintain the rigidity of the blade. Even within the rated wind speed, the
instability of the wind speed produces a serious varied load to the blade, increasing the
Wind Turbines
52
possibility of cyclic fatigue damage of the blade. When subjected to gusts or ultimate
wind load, the blade, failing to adapt to the change immediately, becomes more
vulnerable to invalid breakage, and thus its fatigue life is reduced. Therefore, it is very
important to increase the blade flexibility as well as to improve its unloading effects.
2. The longer the blade is, the higher the tower holder is, and the more unstable the
direction of the wind speed will be. As a result, the attack angle of the blade will vary in
accordance with the change of the wind speed more easily, which in turn results in the
increase of the instability of the power output. At the same time, with the increase of the
blade cost, to increase wind turbine efficiency in order to lower the cost of wind power
by designing adaptive blade has become the research focus (Lobitz & Veers,1999
).
As mentioned above, thus to reduce the impact of the instability of wind speed such as
gusts on the blade, to improve the reliability and antifatigue merits of the large-scale
blade as well as the stability of power output, and to broaden the scope of running
wind speed have become the research hotspots that the current wind power field is
concerned about. The existing technology is to improve the stability (Bao et al.,2007;
Lin,2005) of the power output of the wind turbine blade by stalling, varying pitch angle
and other methods, and some researchers also try to realize this in the ultra-large blade
by reducing the area of the blade trailing edge strip (Lackner & Kuik, 2010). However,
for those blades which are similar to slender cantilever beam, when the wind load is not
fixed and the inertia force becomes larger and larger, the blade structure and the
instability of the power output can hardly be regulated and controlled by the
electromechanical system. And the feedback effect and the governing response speed
can not meet the requirements of real-time control. As a result, the cost will increase
accordingly. Therefore, to improve the adaptivity of the blade and reduce the reliance
on the control system to achieve the stability of output power can meanwhile enhance
the unloading function of the blade and improve its fatigue life, which is thus of
research value.
2. Review of the development of adaptive blade
In fact, the tailorability and designability of the composite aeroelasticity has long been
widely used (Büter & Breitbach, 2000) in the military and aviation fields, etc. Till 1990s,
relevant researchers had begun to try to develop an intelligent blade which bears a good
adaptability to the wind load from outside by designing a laminated blade material.
Karaolis and other researchers have realized the blade twisting and the coupling of the
relevant acting force through the mirror symmetry laminated design of the FRP composite
of small blades. That is to say, with the change of the acting force, the twist angle of each
section of the blade will change accordingly thus to unload some force and control the
power output (Jeronimidis & Musgrove, 1989) of the blade. Joose and others have designed
a kind of structure in which axial tensile deformation and twist deformation are coupled to
adjust the rotation angle of the blade tip, and have analyzed the stability of power output
and its protective capability for the blade in the cases of over-rated wind speed. DON
(Lobitz & Veers, 1999) discussed about the tension, shear and twist coupling algorithm of
the linear beam units and verified it through a set of combined experiments, figuring out the
coupling factors of the blade tip in different twist angles. They have done a preliminary
research on the contribution (Joosse et al., 1996) of coupling factors to the stability of the
power. Andrew for the first time applied twist coupling effect design to the 50kW blade
Adaptive Bend-Torsional Coupling Wind Turbine
Blade Design Imitating the Topology Structure of Natural Plant Leaves
53
systematically, and proposed a design idea of intelligent blade to enhance the blade’s power
control and lower the blade’s fatigue loss (Andrew et al.,1999). So far, the blade with twist
coupling effect is still at the stage of preliminary design, with some verifying experiments
on some small blades.
Till early 21th century, as great importance had been attached to renewable energy by the
countries all over the world, technology of wind power generation and the blade design
theory has been developed rapidly. Researchers in this field have reached a common view to
design an intelligent blade that bears a good adaptability to the bad environment. The
Sandia National Laboratories of the United States had also begun to do some independent
research as well as to fund developing the adaptive blade with torsion coupling property.
Don applied torsion coupling design to medium-sized blades of 300kW, and proved in
detail in his report that adaptive blades are improved blades in terms of wind capturing
efficiency, which are therefore able to increase the annual wind power catch. Although in
the case of stalling, the chances of fatigue and destruction may be increased for adaptive
blades, in the process of operation, its antifatigue property (Lobitz et al., 2001) is actually
increased. Due to the complexity of the structure and the shape of wind turbine blade, it is
difficult to obtain an accurate solution to the mechanical problem of wind turbine structure
by applying the normal numerical analysis theory. However, with the maturity of the finite
element analysis technology, it is also widely applied in the mechanical calculation of wind
turbine blade structure. For instance, Ladean attains the bending stiffness and the shearing
rigidity of the blade through the finite element technology, and also gains the static and
dynamic mechanical property and the buckling frequency (McKittrick et al., 2001)
under the
circumstance of rated wind speed and ultimate wind load, which is of great reference value
for further study.
The increase of the size of the blade calls for some material better than glass fibers which can
now hardly meet the requirements of structure reliability. While carbon fibers, with its light
weight and good comprehensive mechanical property, have become the first choice to
replace glass fiber. In recent years, some scholars are dedicated to the study (Griffin &
Ashwill, 2003) of the hybrid fibers mixed by glass fibers and carbon fibers, and have applied
(Mohamed & Wetzel, 2006) them to the large scale commercial blade constantly. However,
in terms of the hybrid fibers, there is still a problem of manufacture and cost constraints.
And due to the complexity of the mechanism of fracture of the composite material itself, it
will certainly be more difficult to predict and grasp the failure mode of hybrid fibers. In
order to better grasp the fatigue and destruction mechanism of the hybrid fibers, John has
made about 10
10
experimental research on the fatigue property and strength reliability of
different glass fibers and hybrid fibers samples in different stress ratio, which provides a
good reference for the fracture mechanism of the fibers. The research results show that
sewed epoxy hybrid fibers is better than the knitted hybrid fibers in terms of compression
ratio intensity and antifatigue property (Mandell et al., 2003). Don (2001), under fatigue
load, delves into the interlayer destruction mechanism of the hybrid fibers of glass fibers
with variable cross-section and carbon fibers, and the result shows that interlayer stress and
strain have great impact on the destruction of the fiber layer. Compared with glass fibers,
under the maximum stress and strain in the bottom layer, carbon fibers are more susceptible
to interlayer separation failure. Selwin used the finite element method to analyze the cause
for the fatigue failure of the broken blade, and discovered that the estimated results agreed
with the improved fatigue failure criteria (Rajadurai et al., 2008), which applies to all kinds