Properties and Applications of Silicon Carbide Part 7 potx
Bạn đang xem bản rút gọn của tài liệu. Xem và tải ngay bản đầy đủ của tài liệu tại đây (1.34 MB, 30 trang )
Properties and Applications of Silicon Carbide172
The Ni-Si equilibrium phase diagram (Nash & Nash, 1992) predicts six stable intermetallic
compounds: Ni
3
Si, Ni
31
Si
12
, Ni
2
Si, Ni
3
Si
2
, NiSi and NiSi
2
. Only three of compounds melt
congruently namely Ni
31
Si
12
, Ni
2
Si and NiSi. The others form via the peritectic reaction. The
synthesis method of the nickel silicides in Ni-Si system includes conventional melting and
casting and solid state reaction between Ni and Si, the latter of which has been realised in
two different ways; thin films and bulk diffusion couples. Other techniques such as ion
beam mixing (Hsu & Liang, 2005) and mechanical alloying (Lee et al., 2001) can also be used.
In the case of thin film reactions, (Ottaviani, 1979; Zheng et al, 1983; Chen et al, 1985; Lee et
al, 2000; Yoon et al, 2003), the formation of the compounds depends on the relative amounts
of the Ni and Si available for the reactions, the annealing temperature, the atmosphere, and
impurities contained in the layers. Important characteristics include sequential appearance
of phases, i.e. one compound is formed first and the second starts to form later on, and the
absence of certain phases. Ni
2
Si is always the first phase to form and Ni
3
Si
2
is always absent
in thin film experiments. After one of the elements is consumed, the next compound is
richer in the remaining element.
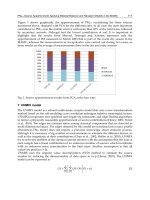
Fig. 1. Normalized XPS core level spectra from different silicides. Surface silicides were
prepared by means of thin film solid-state reactions controlling the heating procedure in
vacuum and the right sample preparation. (Cao et al., 2009)
XPS (X-ray photoelectron spectroscopy) can be used as a fingerprint for correct phase
identification at the surface. The XPS core level spectra of Ni 2p
3/2
in different silicides are
shown in Fig. 1. In comparison to the Ni 2p
3/2
peak (852.7 eV) representing the metal, the
core level shift ΔEc are 0.1 eV for Ni
3
Si, 0.3 eV for Ni
31
Si
12
, 0.7 eV for Ni
2
Si, 1.2 eV for NiSi
and 1.9 eV for NiSi
2
, respectively. With higher amount of Si in the silicides, higher binding
energy position and more symmetrical line shape (see insert in Fig. 1) are obtained. The
shakeup satellite is shifted to higher binding energy upon increasing Si content as well.
868 864 860 856 852 848
NiSi
2
NiSi
Ni
2
Si
Ni
31
Si
12
Ni
3
Si
Ni
Binding energy (eV)
Shake-up satellite
Intensity (a.u.)
Binding Energy (eV)
850852854856
a) Ni
c) Ni
31
Si
12
850852854856
d) Ni
2
Si
851853855857
e) NiSi
852854856858
f) NiSi
2
851853855857859
850852854856
b) Ni
3
Si
Intensity (a.u.)
Binding Energy (eV)
850852854856
a) Ni
c) Ni
31
Si
12
850852854856
d) Ni
2
Si
851853855857
e) NiSi
852854856858
f) NiSi
2
851853855857859
850852854856
b) Ni
3
Si
Ni 2p
3/2
Intensity (a.u.)
Meanwhile, this structure is weaker and is actually smeared out over a larger binding
energy region in the spectrum in the case of NiSi
2
.
Fig. 2. Depth profiles of a) NiSi
2
; b) NiSi and c) Ni
2
Si derived from successive ion etchings
and analysis of the Si 2p and Ni 2p
3/2
levels in XPS. The content of C, O and Si from the
surface contamination is not shown here. d) Evolution of XPS Ni 2p
3/2
peaks in NiSi
2
during
the process of argon ion etching. The spectra are normalized. e) Comparison of normalized
Ni 2p
3/2
peaks after 6 min argon ion etching in different silicides. The etch rate calibrated on
Ta
2
O
5
under these conditions is 4.7 nm /min. Ar ion beam energies of 4 keV are used.
Depth profiling by argon ion etching is a widespread method in studies of film structure
and composition. Argon ion etching is a collisional process involving particle-solid
865 860 855 850
Binding energy (eV)
480 s
360 s
240 s
120 s
60 s
30 s
0 s
d) NiSi
2
, Ni 2p
3/2
Intensity (a.u.)
1 eV
868 866 864 862 860 858 856 854 852 850 848
Binding energy (eV)
NiSi
2
NiSi
Ni
2
Si
Ni
31
Si
12
Ni
3
Si
Ni
852.7
Intensity (a.u.)
e)
20
40
60
80
0 2 4 6 8
20
40
60
80
Etch time (min)
c) Ni
2
Si
20
40
60
80
0 2 4 6 8
Atomic percent (%)
a ) NiSi
2
Ni
Si
b) NiSi
Contact Formation on Silicon Carbide by Use
of Nickel and Tantalum from a Materials Science Point of View 173
The Ni-Si equilibrium phase diagram (Nash & Nash, 1992) predicts six stable intermetallic
compounds: Ni
3
Si, Ni
31
Si
12
, Ni
2
Si, Ni
3
Si
2
, NiSi and NiSi
2
. Only three of compounds melt
congruently namely Ni
31
Si
12
, Ni
2
Si and NiSi. The others form via the peritectic reaction. The
synthesis method of the nickel silicides in Ni-Si system includes conventional melting and
casting and solid state reaction between Ni and Si, the latter of which has been realised in
two different ways; thin films and bulk diffusion couples. Other techniques such as ion
beam mixing (Hsu & Liang, 2005) and mechanical alloying (Lee et al., 2001) can also be used.
In the case of thin film reactions, (Ottaviani, 1979; Zheng et al, 1983; Chen et al, 1985; Lee et
al, 2000; Yoon et al, 2003), the formation of the compounds depends on the relative amounts
of the Ni and Si available for the reactions, the annealing temperature, the atmosphere, and
impurities contained in the layers. Important characteristics include sequential appearance
of phases, i.e. one compound is formed first and the second starts to form later on, and the
absence of certain phases. Ni
2
Si is always the first phase to form and Ni
3
Si
2
is always absent
in thin film experiments. After one of the elements is consumed, the next compound is
richer in the remaining element.
Fig. 1. Normalized XPS core level spectra from different silicides. Surface silicides were
prepared by means of thin film solid-state reactions controlling the heating procedure in
vacuum and the right sample preparation. (Cao et al., 2009)
XPS (X-ray photoelectron spectroscopy) can be used as a fingerprint for correct phase
identification at the surface. The XPS core level spectra of Ni 2p
3/2
in different silicides are
shown in Fig. 1. In comparison to the Ni 2p
3/2
peak (852.7 eV) representing the metal, the
core level shift ΔEc are 0.1 eV for Ni
3
Si, 0.3 eV for Ni
31
Si
12
, 0.7 eV for Ni
2
Si, 1.2 eV for NiSi
and 1.9 eV for NiSi
2
, respectively. With higher amount of Si in the silicides, higher binding
energy position and more symmetrical line shape (see insert in Fig. 1) are obtained. The
shakeup satellite is shifted to higher binding energy upon increasing Si content as well.
868 864 860 856 852 848
NiSi
2
NiSi
Ni
2
Si
Ni
31
Si
12
Ni
3
Si
Ni
Binding energy (eV)
Shake-up satellite
Intensity (a.u.)
Binding Energy (eV)
850852854856
a) Ni
c) Ni
31
Si
12
850852854856
d) Ni
2
Si
851853855857
e) NiSi
852854856858
f) NiSi
2
851853855857859
850852854856
b) Ni
3
Si
Intensity (a.u.)
Binding Energy (eV)
850852854856
a) Ni
c) Ni
31
Si
12
850852854856
d) Ni
2
Si
851853855857
e) NiSi
852854856858
f) NiSi
2
851853855857859
850852854856
b) Ni
3
Si
Ni 2p
3/2
Intensity (a.u.)
Meanwhile, this structure is weaker and is actually smeared out over a larger binding
energy region in the spectrum in the case of NiSi
2
.
Fig. 2. Depth profiles of a) NiSi
2
; b) NiSi and c) Ni
2
Si derived from successive ion etchings
and analysis of the Si 2p and Ni 2p
3/2
levels in XPS. The content of C, O and Si from the
surface contamination is not shown here. d) Evolution of XPS Ni 2p
3/2
peaks in NiSi
2
during
the process of argon ion etching. The spectra are normalized. e) Comparison of normalized
Ni 2p
3/2
peaks after 6 min argon ion etching in different silicides. The etch rate calibrated on
Ta
2
O
5
under these conditions is 4.7 nm /min. Ar ion beam energies of 4 keV are used.
Depth profiling by argon ion etching is a widespread method in studies of film structure
and composition. Argon ion etching is a collisional process involving particle-solid
865 860 855 850
Binding energy (eV)
480 s
360 s
240 s
120 s
60 s
30 s
0 s
d) NiSi
2
, Ni 2p
3/2
Intensity (a.u.)
1 eV
868 866 864 862 860 858 856 854 852 850 848
Binding energy (eV)
NiSi
2
NiSi
Ni
2
Si
Ni
31
Si
12
Ni
3
Si
Ni
852.7
Intensity (a.u.)
e)
20
40
60
80
0 2 4 6 8
20
40
60
80
Etch time (min)
c) Ni
2
Si
20
40
60
80
0 2 4 6 8
Atomic percent (%)
a ) NiSi
2
Ni
Si
b) NiSi
Properties and Applications of Silicon Carbide174
interactions. It induces structural and chemical rearrangement for all the silicides at the
surface. Figure 2 a)-c) shows the apparent atomic concentrations of Ni and Si in the silicides
vs. etch time (Cao et al., 2009) derived from successive ion etchings and analysis of the Si 2p
and Ni 2p
3/2
levels in XPS. During the initial time period of argon ion etching, the surface
composition for all the Ni silicides changes with increasing etching time; preferential
sputtering of Si occurs, resulting in enrichment of the heavier element Ni. The effect of
preferential sputtering decreases with increasing ion beam energy (Cao & Nyborg, 2006).
After the prolonged ion etching, the Ni level becomes constant and reaches saturation level
(Cao et al., 2009). The smallest preferential sputtering of Si occurs for Ni
3
Si, whereas it is
most evident for NiSi
2
. Clearly, the preferential sputtering effect increases with increasing Si
content. Moreover, during the process of argon ion etching, all the Ni 2p
3/2
XPS peaks from
silicides are moved to a lower binding energy positions until the steady state is reached. For
NiSi
2
, the Ni 2p
3/2
peak is moved downwards in binding energy as much as 1 eV compared
to that of the peak without argon ion etching, as shown in Fig. 2d). The corresponding
values for NiSi, Ni
2
Si and Ni
31
Si
12
are 0.6, 0.4 and 0.2 eV, respectively. The steady state
position of Ni 2p
3/2
peak for ion etched Ni
3
Si is also shifted downwards slightly. Therefore,
not only the surface composition is changed with the ion etching, but also the surface
chemical states are apparently modified. The comparison of peaks recorded after 6 min
argon ion etching of the different silicides is illustrated in Fig. 2e). Clearly, the modified Ni
2p
3/2
line position for ion etched NiSi
2
, NiSi and Ni
2
Si in the steady state can still be used as
a fingerprint for correct phase identification. However, the Ni 2p
3/2
peak shifts with respect
to that of metallic Ni are different in these two cases, i.e. with and without argon ion
etching.
2.2 Thermodynamics of Ni-Si-C system
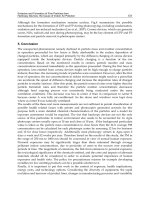
Fig. 3. Isothermal section of the Ni-Si-C at 850°C (La Via et al.; 2002).
Figure 3 shows the equilibrium isothermal section of the ternary Ni-Si-C phase diagram at
850ºC, which is characterised by the absence of both Ni-C compounds and ternary phase.
Furthermore, only Ni
2
Si can be in equilibrium with both C and SiC.
The elements Si and Ni have a strong affinity to one another. The thermodynamic driving
force for the Ni/SiC reactions originates from the negative Gibb’s free energy of nickel
silicide formation. However, the strong Si-C bond provides an activation barrier for silicide
formation. It is necessary to break the Si-C bonds before the reaction. Moreover, the
interfacial energy of C/Ni-silicide is also positive and need to be overcome. Silicide
formation can therefore only be expected at higher temperatures when enough thermal
energy is available, and the activation barrier can be overcome completely.
The expressions for the Gibb’s energies ∆G (Lim et al., 1997) for the various reactions within
the Ni-Si-C system are illustrated in Table 1. Considering the reaction between SiC and Ni
from room temperature to ~ 1600K, the formation of Ni
2
Si shows the most negative ∆G
value, and can thus occur by solid state reaction relatively more easily. Free C is liberated at
the same time.
Possible reactions Gibb’s energy as a function of temperature T
(kJ/mol Ni)
Ni+
1
3
SiC→
1
3
Ni
3
C+
1
3
Si
30.793 + 0.0018·T·logT - 0.0103·T
Ni+2SiC→NiSi
2
+2C 22.990 + 0.0108·T·logT - 0.0454·T
Ni+SiC→NiSi+C -30.932 + 0.0054·T·logT - 0.0195·T
Ni+
2
3
SiC→
1
3
Ni
3
Si+
2
3
C
-38.317 + 0.0036·T·logT - 0.0158·T
Ni+
1
2
SiC→
1
2
Ni
2
Si+
1
2
C
-41.8 + 0.0027·T·logT - 0.0119·T
Table 1. Possible reactions and their Gibb’s free energies (∆G
T
) for the reaction between SiC
and Ni. (Lim et al., 1997)
2.3. Bulk Ni-SiC diffusion couple
The interface reactions between bulk SiC and bulk Ni metal diffusion couples have been
studied by several authors (see e.g. refs. Backhaus-Ricoult, 1992; Bhanumurthy & Schmid-
Fetzer, 2001; Park, 1999). In the reaction zone, it has been observed that the diffusion couple
shows alternating layers of C and Ni-silicides (900C, 24 h or 40 h) (Bhanumurthy & Schmid-
Fetzer, 2001; Park et al., 1999), or alternating silicide bands and silicide bands with
embedded C (950C, 1.5 h) (Backhaus-Ricoult, 1992). From the back-scattered electron
imaging (BSE) (Park et al., 1999) of a Ni/SiC reaction couple annealed at 900°C for 40 h, the
sequence of phases in bulk diffusion couples was observed to be Ni/Ni
3
Si/Ni
5
Si
2
+C/Ni
2
Si
+C/SiC. The approximate width of the bands was about 5-10 μm
. A schematic BSE image
of SiC/Ni reaction couple annealed at 900°C is shown in Fig. 4.
NiSi
2
is not observed
because of the positive Gibb’s free energies for its formation at the temperature studied, see
Table 1. The absence of NiSi phase, however, is probably due to the insufficient annealing
Contact Formation on Silicon Carbide by Use
of Nickel and Tantalum from a Materials Science Point of View 175
interactions. It induces structural and chemical rearrangement for all the silicides at the
surface. Figure 2 a)-c) shows the apparent atomic concentrations of Ni and Si in the silicides
vs. etch time (Cao et al., 2009) derived from successive ion etchings and analysis of the Si 2p
and Ni 2p
3/2
levels in XPS. During the initial time period of argon ion etching, the surface
composition for all the Ni silicides changes with increasing etching time; preferential
sputtering of Si occurs, resulting in enrichment of the heavier element Ni. The effect of
preferential sputtering decreases with increasing ion beam energy (Cao & Nyborg, 2006).
After the prolonged ion etching, the Ni level becomes constant and reaches saturation level
(Cao et al., 2009). The smallest preferential sputtering of Si occurs for Ni
3
Si, whereas it is
most evident for NiSi
2
. Clearly, the preferential sputtering effect increases with increasing Si
content. Moreover, during the process of argon ion etching, all the Ni 2p
3/2
XPS peaks from
silicides are moved to a lower binding energy positions until the steady state is reached. For
NiSi
2
, the Ni 2p
3/2
peak is moved downwards in binding energy as much as 1 eV compared
to that of the peak without argon ion etching, as shown in Fig. 2d). The corresponding
values for NiSi, Ni
2
Si and Ni
31
Si
12
are 0.6, 0.4 and 0.2 eV, respectively. The steady state
position of Ni 2p
3/2
peak for ion etched Ni
3
Si is also shifted downwards slightly. Therefore,
not only the surface composition is changed with the ion etching, but also the surface
chemical states are apparently modified. The comparison of peaks recorded after 6 min
argon ion etching of the different silicides is illustrated in Fig. 2e). Clearly, the modified Ni
2p
3/2
line position for ion etched NiSi
2
, NiSi and Ni
2
Si in the steady state can still be used as
a fingerprint for correct phase identification. However, the Ni 2p
3/2
peak shifts with respect
to that of metallic Ni are different in these two cases, i.e. with and without argon ion
etching.
2.2 Thermodynamics of Ni-Si-C system
Fig. 3. Isothermal section of the Ni-Si-C at 850°C (La Via et al.; 2002).
Figure 3 shows the equilibrium isothermal section of the ternary Ni-Si-C phase diagram at
850ºC, which is characterised by the absence of both Ni-C compounds and ternary phase.
Furthermore, only Ni
2
Si can be in equilibrium with both C and SiC.
The elements Si and Ni have a strong affinity to one another. The thermodynamic driving
force for the Ni/SiC reactions originates from the negative Gibb’s free energy of nickel
silicide formation. However, the strong Si-C bond provides an activation barrier for silicide
formation. It is necessary to break the Si-C bonds before the reaction. Moreover, the
interfacial energy of C/Ni-silicide is also positive and need to be overcome. Silicide
formation can therefore only be expected at higher temperatures when enough thermal
energy is available, and the activation barrier can be overcome completely.
The expressions for the Gibb’s energies ∆G (Lim et al., 1997) for the various reactions within
the Ni-Si-C system are illustrated in Table 1. Considering the reaction between SiC and Ni
from room temperature to ~ 1600K, the formation of Ni
2
Si shows the most negative ∆G
value, and can thus occur by solid state reaction relatively more easily. Free C is liberated at
the same time.
Possible reactions Gibb’s energy as a function of temperature T
(kJ/mol Ni)
Ni+
1
3
SiC→
1
3
Ni
3
C+
1
3
Si
30.793 + 0.0018·T·logT - 0.0103·T
Ni+2SiC→NiSi
2
+2C 22.990 + 0.0108·T·logT - 0.0454·T
Ni+SiC→NiSi+C -30.932 + 0.0054·T·logT - 0.0195·T
Ni+
2
3
SiC→
1
3
Ni
3
Si+
2
3
C
-38.317 + 0.0036·T·logT - 0.0158·T
Ni+
1
2
SiC→
1
2
Ni
2
Si+
1
2
C
-41.8 + 0.0027·T·logT - 0.0119·T
Table 1. Possible reactions and their Gibb’s free energies (∆G
T
) for the reaction between SiC
and Ni. (Lim et al., 1997)
2.3. Bulk Ni-SiC diffusion couple
The interface reactions between bulk SiC and bulk Ni metal diffusion couples have been
studied by several authors (see e.g. refs. Backhaus-Ricoult, 1992; Bhanumurthy & Schmid-
Fetzer, 2001; Park, 1999). In the reaction zone, it has been observed that the diffusion couple
shows alternating layers of C and Ni-silicides (900C, 24 h or 40 h) (Bhanumurthy & Schmid-
Fetzer, 2001; Park et al., 1999), or alternating silicide bands and silicide bands with
embedded C (950C, 1.5 h) (Backhaus-Ricoult, 1992). From the back-scattered electron
imaging (BSE) (Park et al., 1999) of a Ni/SiC reaction couple annealed at 900°C for 40 h, the
sequence of phases in bulk diffusion couples was observed to be Ni/Ni
3
Si/Ni
5
Si
2
+C/Ni
2
Si
+C/SiC. The approximate width of the bands was about 5-10 μm
. A schematic BSE image
of SiC/Ni reaction couple annealed at 900°C is shown in Fig. 4.
NiSi
2
is not observed
because of the positive Gibb’s free energies for its formation at the temperature studied, see
Table 1. The absence of NiSi phase, however, is probably due to the insufficient annealing
Properties and Applications of Silicon Carbide176
(kinetic reason) used by the author since the thermodynamic conditions are met. NiSi has
been observed in the thin film Ni-SiC system.
The formation of Ni
2
Si follows the parabolic rate law d = kt
1/2
(d: thickness of silicide, k:
parabolic rate constant, t: time) with k = 6.27 × 10
-8
cm
2
/s at 950
o
C (Backhaus-Ricoult, 1992).
This means that the global reaction is diffusion-controlled. Nickel is the mobile species in Ni
2
Si
and its diffusion via its own sub-lattice by the vacancy mechanism is supposed to control the
Ni
2
Si growth (Ciccariello et al., 1990). The activation energies for Ni lattice and grain boundary
diffusion have been found to be 2.48 eV and 1.71 eV, respectively. The diffusion of Ni along
grain boundary is thus more important in the formation of Ni
2
Si. The formation of NiSi is also
diffusion controlled, while that of NiSi
2
is nucleation controlled (Lee et al., 2000).
Fig. 4. Schematic BSE image of SiC/Ni reaction couple annealed at 900°C for 40 h (Park et
al., 1999)
The formation mechanism of periodic bands is not very clear, but it is generally accepted
that it depends on the diffusivities of the reacting elements. Metal is the most dominant
diffusing species and C atoms are practically immobile (Bhanumurthy & Schmid-Fetzer,
2001; Park et al., 1999). After the formation of silicide, the Ni concentration at the SiC
reaction interface decreases [Chou et al., 1990]. In order to further decompose SiC, the
critical concentration level of Ni has to be satisfied. At the same time, the C, in front of the
SiC reaction interface, forms small clusters and aggregates as a layer to minimize the
interfacial energy. The continuation of this process will give rise to the formation of
alternating Ni-silicide and C layers. The systems which show the tendency of the formation
of periodic bands have relatively large parabolic rate constant k and k
0
values (intercept of
the linear ln k versus 1/T plot) (Bhanumurthy & Schmid-Fetzer, 2001).
2.4. Ni film on SiC
2.4.1. Reaction products
A number of studies of the interfacial reactions between a Ni film and SiC have been
reported (see e.g. Ohi et al., 2002; Gasser et al., 1997; Roccaforte et al., 2001; Madsen et al.,
1998; Litvinov et al., 2002; Marinova et al., 1996 & Cao et al., 2006). The dominant phase
formed is almost independent of the polytype, the polarity of the SiC and the details of the
annealing cycle.
In the Ni/SiC system, Ni reacts with SiC to form Ni silicides and C. Dissociation of SiC
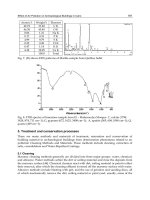
occurs at around 500ºC (Kurimoto & Harima, 2002). Generally, Ni
2
Si is the dominant species
in a large temperature range between 600 and 950°C (Ohi et al., 2002; Gasser et al., 1997; La
Via et al. 2002; Abe et al., 2002; Roccaforte et al., 2001; Cao et al., 2006 & Kestle et al., 2000),
as shown in the X-ray diffraction (XRD) spectra in Fig. 5. Similar as thin film Ni-Si system,
silicides is formed sequentially, i.e. one compound is formed first and the second starts to
form later on during the annealing. The phase sequence is Ni
23
Si
2
+Ni
31
Si
12
→ Ni
31
Si
12
→
Ni
31
Si
12
+Ni
2
Si → Ni
2
Si (Madsen et al., 1998 & Bächli et al., 1998). This is the reason why
Ni
31
Si
12
has been found at the surface in some cases, see eg. Refs. (Han & Lee, 2002; Han et
al., 2002). Silicon rich silicides can be observed at the interface of Ni
2
Si and SiC (Cao et al.,
2005). Increasing temperature to above 1000°C results in the formation of a NiSi thin film
(Litvinov et al., 2002; Kestle et al., 2000 & Marinova et al., 1996).
Fig. 5. XRD spectra of samples with ~ 100 nm Ni thickness on 4H-SiC after annealing.
Glancing angle 3
o
with Cr k
α
radiation (λ = 2.29Å)
2.4.2. Formation of Ni
2
Si and its mechanisms
In the Ni/SiC system, the formation of Ni
2
Si through the reaction 2Ni+SiC = Ni
2
Si+C may
consist of two stages (Cao et al., 2006) which are controlled by reaction and diffusion rate
respectively.
The thermodynamic driving force for the Ni/SiC reaction originates from the negative
Gibb’s energy of Ni-silicide formation (Table 1). Before the formation of Ni
2
Si by solid state
reaction, however, it is necessary to break SiC bonds. The existence of Ni may help the
dissociation of SiC at the temperatures lower than its dissociation value. It is known that the
thermal expansion coefficient of SiC is 3-4 times higher than that of Ni (Adachi, 2004). This
expansion difference results in thermal strain at higher temperatures for SiC sample coated
with Ni, which corresponds to compression at the Ni side and tensile at the SiC side. It is
thus possible that some Ni atoms slightly penetrate into the SiC side at the interface with the
40 60 80 100 120
a) 800
o
C
b) 950
o
C
Intensity (a.u.)
graphite
2
(
o
)
Ni
2
Si
Contact Formation on Silicon Carbide by Use
of Nickel and Tantalum from a Materials Science Point of View 177
(kinetic reason) used by the author since the thermodynamic conditions are met. NiSi has
been observed in the thin film Ni-SiC system.
The formation of Ni
2
Si follows the parabolic rate law d = kt
1/2
(d: thickness of silicide, k:
parabolic rate constant, t: time) with k = 6.27 × 10
-8
cm
2
/s at 950
o
C (Backhaus-Ricoult, 1992).
This means that the global reaction is diffusion-controlled. Nickel is the mobile species in Ni
2
Si
and its diffusion via its own sub-lattice by the vacancy mechanism is supposed to control the
Ni
2
Si growth (Ciccariello et al., 1990). The activation energies for Ni lattice and grain boundary
diffusion have been found to be 2.48 eV and 1.71 eV, respectively. The diffusion of Ni along
grain boundary is thus more important in the formation of Ni
2
Si. The formation of NiSi is also
diffusion controlled, while that of NiSi
2
is nucleation controlled (Lee et al., 2000).
Fig. 4. Schematic BSE image of SiC/Ni reaction couple annealed at 900°C for 40 h (Park et
al., 1999)
The formation mechanism of periodic bands is not very clear, but it is generally accepted
that it depends on the diffusivities of the reacting elements. Metal is the most dominant
diffusing species and C atoms are practically immobile (Bhanumurthy & Schmid-Fetzer,
2001; Park et al., 1999). After the formation of silicide, the Ni concentration at the SiC
reaction interface decreases [Chou et al., 1990]. In order to further decompose SiC, the
critical concentration level of Ni has to be satisfied. At the same time, the C, in front of the
SiC reaction interface, forms small clusters and aggregates as a layer to minimize the
interfacial energy. The continuation of this process will give rise to the formation of
alternating Ni-silicide and C layers. The systems which show the tendency of the formation
of periodic bands have relatively large parabolic rate constant k and k
0
values (intercept of
the linear ln k versus 1/T plot) (Bhanumurthy & Schmid-Fetzer, 2001).
2.4. Ni film on SiC
2.4.1. Reaction products
A number of studies of the interfacial reactions between a Ni film and SiC have been
reported (see e.g. Ohi et al., 2002; Gasser et al., 1997; Roccaforte et al., 2001; Madsen et al.,
1998; Litvinov et al., 2002; Marinova et al., 1996 & Cao et al., 2006). The dominant phase
formed is almost independent of the polytype, the polarity of the SiC and the details of the
annealing cycle.
In the Ni/SiC system, Ni reacts with SiC to form Ni silicides and C. Dissociation of SiC
occurs at around 500ºC (Kurimoto & Harima, 2002). Generally, Ni
2
Si is the dominant species
in a large temperature range between 600 and 950°C (Ohi et al., 2002; Gasser et al., 1997; La
Via et al. 2002; Abe et al., 2002; Roccaforte et al., 2001; Cao et al., 2006 & Kestle et al., 2000),
as shown in the X-ray diffraction (XRD) spectra in Fig. 5. Similar as thin film Ni-Si system,
silicides is formed sequentially, i.e. one compound is formed first and the second starts to
form later on during the annealing. The phase sequence is Ni
23
Si
2
+Ni
31
Si
12
→ Ni
31
Si
12
→
Ni
31
Si
12
+Ni
2
Si → Ni
2
Si (Madsen et al., 1998 & Bächli et al., 1998). This is the reason why
Ni
31
Si
12
has been found at the surface in some cases, see eg. Refs. (Han & Lee, 2002; Han et
al., 2002). Silicon rich silicides can be observed at the interface of Ni
2
Si and SiC (Cao et al.,
2005). Increasing temperature to above 1000°C results in the formation of a NiSi thin film
(Litvinov et al., 2002; Kestle et al., 2000 & Marinova et al., 1996).
Fig. 5. XRD spectra of samples with ~ 100 nm Ni thickness on 4H-SiC after annealing.
Glancing angle 3
o
with Cr k
α
radiation (λ = 2.29Å)
2.4.2. Formation of Ni
2
Si and its mechanisms
In the Ni/SiC system, the formation of Ni
2
Si through the reaction 2Ni+SiC = Ni
2
Si+C may
consist of two stages (Cao et al., 2006) which are controlled by reaction and diffusion rate
respectively.
The thermodynamic driving force for the Ni/SiC reaction originates from the negative
Gibb’s energy of Ni-silicide formation (Table 1). Before the formation of Ni
2
Si by solid state
reaction, however, it is necessary to break SiC bonds. The existence of Ni may help the
dissociation of SiC at the temperatures lower than its dissociation value. It is known that the
thermal expansion coefficient of SiC is 3-4 times higher than that of Ni (Adachi, 2004). This
expansion difference results in thermal strain at higher temperatures for SiC sample coated
with Ni, which corresponds to compression at the Ni side and tensile at the SiC side. It is
thus possible that some Ni atoms slightly penetrate into the SiC side at the interface with the
40 60 80 100 120
a) 800
o
C
b) 950
o
C
Intensity (a.u.)
graphite
2 (
o
)
Ni
2
Si
Properties and Applications of Silicon Carbide178
help of the thermal energy. The theoretical calculation on the chemical bonding in cubic SiC
(Yuryeva & Ivanovskii, 2002) has shown that Ni impurities weaken the covalent character of
the SiC crystal, resulting in a decrease in the stability of the SiC adjacent to the Ni layer. The
decomposition of SiC, which starts at the interface, is therefore possible at a temperature
lower than its dissociation value. However, the stability of SiC must be lowered to certain
degree before the decomposition of SiC. In other words, an incubation period exists.
Following the decomposition of the SiC, Si and C released will diffuse into the Ni due to the
expected low diffusion coefficient of the Ni in SiC. This has been proved by the expansion of
metal Ni lattice prior to the appearance of Ni silicides in ultra thin Ni/SiC system (Su et al.,
2002; Iwaya et al., 2006). The opposite Ni flux into the SiC may not be dominant in this stage.
The mixture of Si and Ni occurs very rapidly, provided Si atoms are available. In fact, an
amorphous interlayer (~ 3.5 nm) which is a mixture of Ni and Si has been observed in the
Ni/Si system even at room temperature by solid-state diffusion (Sarkar, 2000). Therefore,
the formation of new phase Ni
2
Si in the first stage is determined by the speed of bond
breakage, i.e., by the supply of Si from the decomposition of SiC. This is a reaction-rate
controlled process.
With the progress of the reaction, heat is released by the formation of Ni
2
Si. More SiC is then
decomposed and more Si atoms become available. The supply of Si atoms is then no longer
the dominant factor in the formation of Ni
2
Si, because Ni is the dominant diffusing species
through Ni
2
Si (Ciccariello et al., 1990). The growth of thin Ni
2
Si films is controlled mainly by
the diffusion of Ni along the silicide grain boundaries. Nickel is then provided at the
Ni
2
Si/SiC interface where the silicide formation takes place. This interface advances by the
arrival of new Ni atoms. The formation obeys the parabolic rate law. In this case, the Ni flux
increases relative to fluxes of Si and C from SiC and the mechanism of reaction changes to a
diffusion controlled one, corresponding to the second stage of the reaction.
In addition, the Ni
2
Si formed by annealing possesses textured structure to some degree,
which was confirmed by XRD [Cao et al., 2006].
2.4.3. Formation of C and its chemical states
After the reaction between Ni and SiC, C present in the consumed SiC layer should
precipitate. A number of studies of the chemical state of C after annealing have been
reported (Gasser et al., 1997; La Via et al, 2003; Han & Lee, 2002; Marinova et al, 1996;
Marinova et al, 1997). Figure 6a) shows the C1s XPS region spectra at the surface after heat
treatment at 800°C and 950°C in vacuum. It is seen that C is mainly in the chemical state
analogous to that of graphite in the surface region for both temperatures (Cao et al. 2006). To
investigate further the chemical states of the C species inside the contact, C1s XPS peaks
have been recorded after successive Ar ion etchings, as shown in Fig. 6b. It is revealed that
the C1s binding energy value recorded from the sample heated at 950ºC was slightly higher
than that from lower temperature, implying the possible difference of the chemical state.
Considering binding energy of C1s XPS peak decreases with decreasing structure order in C
species (Rodriguez et al, 2001), a less ordered structure below the surface could be possible
in the case of 800ºC heat treatment. Further evidence can be obtained by means of Raman
spectroscopy, as shown in Fig. 7. Compared with graphite standard, the broadened and
shifted G and 2D peaks as well as the appearance of an additional D peak indicate the
formation of nanocrystalline graphite cluster in annealed Ni-SiC samples (Cao et al, 2006).
This is consistent with the result of Kurimoto and Harima (Kurimoto & Harima, 2002). Close
examination of line position and shape of G and 2D Raman peaks together with the intensity
ratio I
D
/I
G
obtained at different temperatures indicate that more highly graphitised and less
disordered carbon is promoted by a higher annealing temperature at 950
o
C. Similar results
have been reported in ref. (Ohi et al, 2002; Kurimoto & Harikawa, 2002). For temperatures of
600 and 800°C, Ohi et al. found the formation of C with modified π bonds when compared
to graphite. The π sub-band has different density of states from that of graphite.
Fig. 6. a). C1s XPS spectra at the surface; b) C1s XPS peak position recorded by successive Ar
ion etchings. Ni/4H-SiC samples annealed in vacuum. t
Ni
= 50 nm. The etch rate calibrated
on Ta
2
O
5
under the experimental condition is 5.6 nm /min.
Fig. 7. Raman first-order a) and second-order b) spectra of graphite and vacuum annealed
Ni-4H SiC samples. t
Ni
= 200 nm.
In the process of formation of C, Ni acts as an effective catalyst for graphitisation (Lu et al,
2003). In fact, once silicide has formed, not only can Ni act as mediating agent but also the
reaction product, the silicides (Hähne & Woltersdorf, 2004), can do so. The driving force for
1100 1200 1300 1400 1500 1600 1700
Raman shift (cm
-1
)
800
o
C, 30 min
950
o
C, 30 min
Intensity (a.u.)
a)
Graphite
G
D
2200 2400 2600 2800 3000 3200
950
o
C, 30 min
Intensity (a.u.)
800
o
C, 30 min
Raman shift (cm
-1
)
b)
Graphite
2D
290 288 286 284 282 280
Binding energy (eV)
a) 50 nm, 800
o
C, 20 min
b) 50 nm, 950
Intensity (a.u.)
c) Graphite standard
a)
0 500 1000 1500 2000
283,2
283,4
283,6
283,8
284,0
284,2
284,4
800
o
C, 20 min
b)
Etch time (s)
950
o
C, 20 min
0.15 eV
Binding energy (ev)
Contact Formation on Silicon Carbide by Use
of Nickel and Tantalum from a Materials Science Point of View 179
help of the thermal energy. The theoretical calculation on the chemical bonding in cubic SiC
(Yuryeva & Ivanovskii, 2002) has shown that Ni impurities weaken the covalent character of
the SiC crystal, resulting in a decrease in the stability of the SiC adjacent to the Ni layer. The
decomposition of SiC, which starts at the interface, is therefore possible at a temperature
lower than its dissociation value. However, the stability of SiC must be lowered to certain
degree before the decomposition of SiC. In other words, an incubation period exists.
Following the decomposition of the SiC, Si and C released will diffuse into the Ni due to the
expected low diffusion coefficient of the Ni in SiC. This has been proved by the expansion of
metal Ni lattice prior to the appearance of Ni silicides in ultra thin Ni/SiC system (Su et al.,
2002; Iwaya et al., 2006). The opposite Ni flux into the SiC may not be dominant in this stage.
The mixture of Si and Ni occurs very rapidly, provided Si atoms are available. In fact, an
amorphous interlayer (~ 3.5 nm) which is a mixture of Ni and Si has been observed in the
Ni/Si system even at room temperature by solid-state diffusion (Sarkar, 2000). Therefore,
the formation of new phase Ni
2
Si in the first stage is determined by the speed of bond
breakage, i.e., by the supply of Si from the decomposition of SiC. This is a reaction-rate
controlled process.
With the progress of the reaction, heat is released by the formation of Ni
2
Si. More SiC is then
decomposed and more Si atoms become available. The supply of Si atoms is then no longer
the dominant factor in the formation of Ni
2
Si, because Ni is the dominant diffusing species
through Ni
2
Si (Ciccariello et al., 1990). The growth of thin Ni
2
Si films is controlled mainly by
the diffusion of Ni along the silicide grain boundaries. Nickel is then provided at the
Ni
2
Si/SiC interface where the silicide formation takes place. This interface advances by the
arrival of new Ni atoms. The formation obeys the parabolic rate law. In this case, the Ni flux
increases relative to fluxes of Si and C from SiC and the mechanism of reaction changes to a
diffusion controlled one, corresponding to the second stage of the reaction.
In addition, the Ni
2
Si formed by annealing possesses textured structure to some degree,
which was confirmed by XRD [Cao et al., 2006].
2.4.3. Formation of C and its chemical states
After the reaction between Ni and SiC, C present in the consumed SiC layer should
precipitate. A number of studies of the chemical state of C after annealing have been
reported (Gasser et al., 1997; La Via et al, 2003; Han & Lee, 2002; Marinova et al, 1996;
Marinova et al, 1997). Figure 6a) shows the C1s XPS region spectra at the surface after heat
treatment at 800°C and 950°C in vacuum. It is seen that C is mainly in the chemical state
analogous to that of graphite in the surface region for both temperatures (Cao et al. 2006). To
investigate further the chemical states of the C species inside the contact, C1s XPS peaks
have been recorded after successive Ar ion etchings, as shown in Fig. 6b. It is revealed that
the C1s binding energy value recorded from the sample heated at 950ºC was slightly higher
than that from lower temperature, implying the possible difference of the chemical state.
Considering binding energy of C1s XPS peak decreases with decreasing structure order in C
species (Rodriguez et al, 2001), a less ordered structure below the surface could be possible
in the case of 800ºC heat treatment. Further evidence can be obtained by means of Raman
spectroscopy, as shown in Fig. 7. Compared with graphite standard, the broadened and
shifted G and 2D peaks as well as the appearance of an additional D peak indicate the
formation of nanocrystalline graphite cluster in annealed Ni-SiC samples (Cao et al, 2006).
This is consistent with the result of Kurimoto and Harima (Kurimoto & Harima, 2002). Close
examination of line position and shape of G and 2D Raman peaks together with the intensity
ratio I
D
/I
G
obtained at different temperatures indicate that more highly graphitised and less
disordered carbon is promoted by a higher annealing temperature at 950
o
C. Similar results
have been reported in ref. (Ohi et al, 2002; Kurimoto & Harikawa, 2002). For temperatures of
600 and 800°C, Ohi et al. found the formation of C with modified π bonds when compared
to graphite. The π sub-band has different density of states from that of graphite.
Fig. 6. a). C1s XPS spectra at the surface; b) C1s XPS peak position recorded by successive Ar
ion etchings. Ni/4H-SiC samples annealed in vacuum. t
Ni
= 50 nm. The etch rate calibrated
on Ta
2
O
5
under the experimental condition is 5.6 nm /min.
Fig. 7. Raman first-order a) and second-order b) spectra of graphite and vacuum annealed
Ni-4H SiC samples. t
Ni
= 200 nm.
In the process of formation of C, Ni acts as an effective catalyst for graphitisation (Lu et al,
2003). In fact, once silicide has formed, not only can Ni act as mediating agent but also the
reaction product, the silicides (Hähne & Woltersdorf, 2004), can do so. The driving force for
1100 1200 1300 1400 1500 1600 1700
Raman shift (cm
-1
)
800
o
C, 30 min
950
o
C, 30 min
Intensity (a.u.)
a)
Graphite
G
D
2200 2400 2600 2800 3000 3200
950
o
C, 30 min
Intensity (a.u.)
800
o
C, 30 min
Raman shift (cm
-1
)
b)
Graphite
2D
290 288 286 284 282 280
Binding energy (eV)
a) 50 nm, 800
o
C, 20 min
b) 50 nm, 950
Intensity (a.u.)
c) Graphite standard
a)
0 500 1000 1500 2000
283,2
283,4
283,6
283,8
284,0
284,2
284,4
800
o
C, 20 min
b)
Etch time (s)
950
o
C, 20 min
0.15 eV
Binding energy (ev)
Properties and Applications of Silicon Carbide180
the graphitisation process is the decrease of free energy by the conversion of amorphous C
to graphite. The graphitisation process is a gradual disorder-order transformation. It
includes the rearrangement of disordered C atoms, released from the formation of silicide,
to hexagonal planar structures and the formation of ordered stacking structures along c axis.
The structure of C is less complete at lower temperature.
2.4.4. Distribution of phases in the reaction products
and the effect of pre-treatment and Ni layer thickness
Carbon is released from the SiC during the silicide formation. The redistribution of C after
annealing is one of the most controversial aspects in studying the Ni/SiC reactions. The
main opinions are: a) Carbon atoms are distributed through the contact layer and
accumulated at the top surface (Kurimoto & Harima, 2002; Han & Lee, 2002; Bächli et al.,
1998; Han et al., 2002). b) Carbon in graphite state is present in the whole contact layer with
a maximum concentration at the contact/SiC interface (Marinova et al., 1997). c). Carbon
agglomerates into a thin layer far from the silicide/SiC interface after annealing (La Via et
al., 2003). d). Carbon is almost uniformly distributed inside the silicide layer (Roccaforte et
al., 2001).
To authors’ opinion, the C distribution is dependent on several factors, such as annealing
environment, pre-treatment on SiC substrate and Ni layer thickness. The in-situ depth
profiles by XPS study for vacuum annealed Ni/SiC sample without exposure to the air
reveal that there is a C layer at the external surface in all cases, as shown in Fig. 8 and 9 (Cao
et al., 2005; Cao et al, 2006, Cao & Nyborg, 2006). The carbon diffuses mainly through the
non-reacted Ni film towards the external surface at the beginning of reaction. The external
surface acted as an effective sink for C accumulation. According to the Ellingham diagram,
the equilibrium partial pressure of oxygen for reaction 2C + O
2
= 2CO at 800ºC is ~ 10
-20
atm
(Shifler, 2003), which is much lower than the partial pressure of oxygen in the normal
vacuum annealing furnace (~10
-9
-10
-10
atm). The driving force for the C moving to the free
surface is thus provided. In the equilibrium state, the C at the free surface will disappear by
reacting with oxygen to form CO. However, some C still exists and is thus in a metastable
state. Besides the experimental error, one possible reason for the discrepancies in the
literature regarding C distribution could be the annealing atmosphere having different
reactivity with C. The use of unsuitable analysis methods, such as EDX, could also be a
cause.
The surface pre-treatment of the SiC substrate has certain influence on the C distribution
(Cao et al., 2005; Cao et al., 2006). In the case of SiC substrate without pre-treatment or with
chemical cleaning, the in-situ depth profile obtained is illustrated in Fig. 8. For very thin Ni
layers (less than ~ 10 nm), a C-depleted zone separates a thin C surface layer from the SiC
substrate (Fig. 8a). For thicker Ni layers, a further accumulation of C is also observed below
the surface region (Fig. 8b). The maximum C concentration is away from the silicide/SiC
interface at a certain distance. The reason is as follows. After a continuous layer of silicide
with certain thickness has formed, the rate of accumulation of C to the free surface decreases
due to the expected low diffusivity of C in silicide. It is known that the diffusion coefficient
of C in Ni at 800ºC is 1.610
8
cm
2
s
1
(Smithells, 1967). However, the diffusivity of C in
Ndoped ntype hexagonal SiC at 800ºC extrapolated from the data at 1850-2180
o
C is as low
as 1.110
31
cm
2
s
1
(Matzke & Rondinella, 1999). Carbon is therefore much more mobile in
metal Ni than in 4HSiC. As the Ni
2
SiSiC interface advances, C phase is also buried within
the silicide. To minimize the total interfacial energy between C and Ni-silicide, the C phase
would tend to form clusters in the direction opposite to the external surface as well (Fig. 8b).
Fig. 8. In-situ depth profiles of samples with Ni layer thickness a) 6 nm and b) 50 nm (Cao et
al., 2006). The samples were heated at 800°C for 20 min in vacuum. The SiC substrate is in
the as-delivered state from manufacturer. The etch rate calibrated on Ta
2
O
5
under the
experimental condition is 5.6 nm /min.
However, for the sample experiencing Ar ion etching before the Ni deposition there is a
different phase distribution in the reaction product (Fig. 9). The argon ion bombardment
deposited a large amount of energy on the surface and created many excitations, including
ionization of secondary ions and neutral particles and ejection of electrons. All these
energetic particles could in principle transfer energy into SiC and facilitate its dissociation.
The energetic particles mentioned above might also provide energy to enhance the diffusion
of the Ni atoms into the bulk. It is known that nickel is the dominant diffusion species in
nickel silicides and controls the rate of Ni
2
Si formation in the second reaction stage. As a
result of fast dissociation of SiC and enhanced diffusion of Ni, Ni
2
Si is formed quicker under
the action of argon ion pre-treatment. Consequently, there is less C agglomerated at the
surface because C is much less mobile in Ni
2
Si than in metal Ni.
For the thinnest Ni layer (d
Ni
= 3 nm), heat treatment lead to the formation of surface graphitic
carbon layer and silicide below with low carbon content (Fig. 9a). With the Ni thickness
doubled to 6 nm (Fig.9b), there is a carbon rich layer below the surface region, which is clearly
different from Fig. 8a. In Fig. 9c (d
Ni
= 17 nm), a silicide layer with carbon deficiency develops
adjacent to the interface. The maximum C content is ~ 4 nm away from the silicide/SiC
interface. Increasing Ni thickness even more results in a repeated maximum of carbon
intensity corresponding to the minimum of the nickel intensity, i.e., a multi-layer structure,
consisting of silicide rich layer/ carbon rich layer / silicide rich layer /···· (Fig. 9d). The
silicide layer adjacent to the interface is deficient of C.
The depth profiles indicate that
there is a minimum Ni thickness (~ 15 nm) for the formation of such multi-layer structure.
The development of such a structure can be explained by the quicker formation of Ni
2
Si
under such a condition. It is then difficult for free C released from the SiC to move long
distance due to the low diffusivity and low solid solubility of C in silicide. In order to
0 500 1000 1500 2000
b) 50 nm
C
Si
Ni
Etch time (s)
O
0 200 400 600 800
0
20
40
60
80
100
a) 6 nm
Atomic percent (%)
Contact Formation on Silicon Carbide by Use
of Nickel and Tantalum from a Materials Science Point of View 181
the graphitisation process is the decrease of free energy by the conversion of amorphous C
to graphite. The graphitisation process is a gradual disorder-order transformation. It
includes the rearrangement of disordered C atoms, released from the formation of silicide,
to hexagonal planar structures and the formation of ordered stacking structures along c axis.
The structure of C is less complete at lower temperature.
2.4.4. Distribution of phases in the reaction products
and the effect of pre-treatment and Ni layer thickness
Carbon is released from the SiC during the silicide formation. The redistribution of C after
annealing is one of the most controversial aspects in studying the Ni/SiC reactions. The
main opinions are: a) Carbon atoms are distributed through the contact layer and
accumulated at the top surface (Kurimoto & Harima, 2002; Han & Lee, 2002; Bächli et al.,
1998; Han et al., 2002). b) Carbon in graphite state is present in the whole contact layer with
a maximum concentration at the contact/SiC interface (Marinova et al., 1997). c). Carbon
agglomerates into a thin layer far from the silicide/SiC interface after annealing (La Via et
al., 2003). d). Carbon is almost uniformly distributed inside the silicide layer (Roccaforte et
al., 2001).
To authors’ opinion, the C distribution is dependent on several factors, such as annealing
environment, pre-treatment on SiC substrate and Ni layer thickness. The in-situ depth
profiles by XPS study for vacuum annealed Ni/SiC sample without exposure to the air
reveal that there is a C layer at the external surface in all cases, as shown in Fig. 8 and 9 (Cao
et al., 2005; Cao et al, 2006, Cao & Nyborg, 2006). The carbon diffuses mainly through the
non-reacted Ni film towards the external surface at the beginning of reaction. The external
surface acted as an effective sink for C accumulation. According to the Ellingham diagram,
the equilibrium partial pressure of oxygen for reaction 2C + O
2
= 2CO at 800ºC is ~ 10
-20
atm
(Shifler, 2003), which is much lower than the partial pressure of oxygen in the normal
vacuum annealing furnace (~10
-9
-10
-10
atm). The driving force for the C moving to the free
surface is thus provided. In the equilibrium state, the C at the free surface will disappear by
reacting with oxygen to form CO. However, some C still exists and is thus in a metastable
state. Besides the experimental error, one possible reason for the discrepancies in the
literature regarding C distribution could be the annealing atmosphere having different
reactivity with C. The use of unsuitable analysis methods, such as EDX, could also be a
cause.
The surface pre-treatment of the SiC substrate has certain influence on the C distribution
(Cao et al., 2005; Cao et al., 2006). In the case of SiC substrate without pre-treatment or with
chemical cleaning, the in-situ depth profile obtained is illustrated in Fig. 8. For very thin Ni
layers (less than ~ 10 nm), a C-depleted zone separates a thin C surface layer from the SiC
substrate (Fig. 8a). For thicker Ni layers, a further accumulation of C is also observed below
the surface region (Fig. 8b). The maximum C concentration is away from the silicide/SiC
interface at a certain distance. The reason is as follows. After a continuous layer of silicide
with certain thickness has formed, the rate of accumulation of C to the free surface decreases
due to the expected low diffusivity of C in silicide. It is known that the diffusion coefficient
of C in Ni at 800ºC is 1.610
8
cm
2
s
1
(Smithells, 1967). However, the diffusivity of C in
Ndoped ntype hexagonal SiC at 800ºC extrapolated from the data at 1850-2180
o
C is as low
as 1.110
31
cm
2
s
1
(Matzke & Rondinella, 1999). Carbon is therefore much more mobile in
metal Ni than in 4HSiC. As the Ni
2
SiSiC interface advances, C phase is also buried within
the silicide. To minimize the total interfacial energy between C and Ni-silicide, the C phase
would tend to form clusters in the direction opposite to the external surface as well (Fig. 8b).
Fig. 8. In-situ depth profiles of samples with Ni layer thickness a) 6 nm and b) 50 nm (Cao et
al., 2006). The samples were heated at 800°C for 20 min in vacuum. The SiC substrate is in
the as-delivered state from manufacturer. The etch rate calibrated on Ta
2
O
5
under the
experimental condition is 5.6 nm /min.
However, for the sample experiencing Ar ion etching before the Ni deposition there is a
different phase distribution in the reaction product (Fig. 9). The argon ion bombardment
deposited a large amount of energy on the surface and created many excitations, including
ionization of secondary ions and neutral particles and ejection of electrons. All these
energetic particles could in principle transfer energy into SiC and facilitate its dissociation.
The energetic particles mentioned above might also provide energy to enhance the diffusion
of the Ni atoms into the bulk. It is known that nickel is the dominant diffusion species in
nickel silicides and controls the rate of Ni
2
Si formation in the second reaction stage. As a
result of fast dissociation of SiC and enhanced diffusion of Ni, Ni
2
Si is formed quicker under
the action of argon ion pre-treatment. Consequently, there is less C agglomerated at the
surface because C is much less mobile in Ni
2
Si than in metal Ni.
For the thinnest Ni layer (d
Ni
= 3 nm), heat treatment lead to the formation of surface graphitic
carbon layer and silicide below with low carbon content (Fig. 9a). With the Ni thickness
doubled to 6 nm (Fig.9b), there is a carbon rich layer below the surface region, which is clearly
different from Fig. 8a. In Fig. 9c (d
Ni
= 17 nm), a silicide layer with carbon deficiency develops
adjacent to the interface. The maximum C content is ~ 4 nm away from the silicide/SiC
interface. Increasing Ni thickness even more results in a repeated maximum of carbon
intensity corresponding to the minimum of the nickel intensity, i.e., a multi-layer structure,
consisting of silicide rich layer/ carbon rich layer / silicide rich layer /···· (Fig. 9d). The
silicide layer adjacent to the interface is deficient of C.
The depth profiles indicate that
there is a minimum Ni thickness (~ 15 nm) for the formation of such multi-layer structure.
The development of such a structure can be explained by the quicker formation of Ni
2
Si
under such a condition. It is then difficult for free C released from the SiC to move long
distance due to the low diffusivity and low solid solubility of C in silicide. In order to
0 500 1000 1500 2000
b) 50 nm
C
Si
Ni
Etch time (s)
O
0 200 400 600 800
0
20
40
60
80
100
a) 6 nm
Atomic percent (%)
Properties and Applications of Silicon Carbide182
minimize the interfacial energy between C and Ni-silicide, as a compromise, the dissociated
C atoms might form small clusters and aggregated as a layer.
Fig. 9. In-situ depth profiles of samples with different Ni layer thickness (Cao et al., 2005).
The SiC substrate was cleaned by Ar ion etching with 4 keV energy before Ni deposition.
The samples were then heated at 800°C for 20 min in vacuum. The etching rate calibrated on
Ta
2
O
5
under the experimental condition is 5.6 nm /min.
It is also interesting to identify the silicide (Ni
2
Si) morphology for thin Ni film samples.
Figure 10 presents the Si2p peak from Ni/SiC samples with different Ni layer thickness (Cao
et al., 2006). After annealing thin Ni layer sample (t
Ni
= 3 nm) at 800ºC for 20 min in vacuum,
it is known from XPS curve fitting results that the Si2p peaks are composed of three
chemical states (Fig. 10 a): the main part being Si in SiC, and the other two small parts being
Si in SiO
2
and Ni
2
Si, respectively. The existence of SiO
2
is due to the slight oxidation in the
furnace. Considering that the deposited Ni film is continuous and uniform, the appearance
of strong carbide signal (from Si in SiC) suggests that Ni
2
Si tended to form islands during
the annealing. With the Ni thickness doubled (Fig. 10b), the amount of Ni
2
Si increases
obviously and the detected amount of SiC decreases. The Ni silicide island can grow both
laterally and vertically. Increasing Ni thickness even more (Fig. 10c) results in the
disappearance of SiC signal and Ni
2
Si is dominant. The above results indicate that the
silicide becomes continuous with increasing Ni film thickness.
0 500 1000 1500 2000 2500
d) 50 nm
Etch time (s)
0 200 400 600 800
Etch time (s)
b) 6 nm
0 200 400 600 800
0
20
40
60
80
Atomic percent (%)
c) 17 nm
0 200 400
0
20
40
60
80
a) 3 nm
C
Atomic percent (%)
Si
Ni
Fig. 10. In-situ Si2p XPS spectra of Ni/SiC samples after annealing at 800ºC for 20 min in
vacuum. a) t
Ni
= 3 nm b) t
Ni
= 6 nm c) t
Ni
= 17 nm d) t
Ni
= 6 nm. In Fig. a-c), the Ni thin films
were deposited on as-delivered SiC substrate. In Fig. d), the SiC substrate was cleaned by Ar
ion etching with 4 keV energy before Ni deposition.
Fig. 10b) and d) give the XPS Si 2p peak recorded from the samples with same initial Ni
layer thickness (d
Ni
= ~ 6 nm) but different pre-treatment on SiC substrate. From the
comparison it has been found that the shoulder at higher binding energy representing Si in
SiC disappears when the Ni thin film is deposited on an argon ion etched SiC substrate. This
is again related to the fast dissociation of SiC and enhanced diffusion of Ni under the action
of argon ion pre-treatment. The nucleation and growth of Ni
2
Si are promoted. Therefore, the
silicides formation kinetics is affected and a continuous silicide layer develops quicker.
Contact Formation on Silicon Carbide by Use
of Nickel and Tantalum from a Materials Science Point of View 183
minimize the interfacial energy between C and Ni-silicide, as a compromise, the dissociated
C atoms might form small clusters and aggregated as a layer.
Fig. 9. In-situ depth profiles of samples with different Ni layer thickness (Cao et al., 2005).
The SiC substrate was cleaned by Ar ion etching with 4 keV energy before Ni deposition.
The samples were then heated at 800°C for 20 min in vacuum. The etching rate calibrated on
Ta
2
O
5
under the experimental condition is 5.6 nm /min.
It is also interesting to identify the silicide (Ni
2
Si) morphology for thin Ni film samples.
Figure 10 presents the Si2p peak from Ni/SiC samples with different Ni layer thickness (Cao
et al., 2006). After annealing thin Ni layer sample (t
Ni
= 3 nm) at 800ºC for 20 min in vacuum,
it is known from XPS curve fitting results that the Si2p peaks are composed of three
chemical states (Fig. 10 a): the main part being Si in SiC, and the other two small parts being
Si in SiO
2
and Ni
2
Si, respectively. The existence of SiO
2
is due to the slight oxidation in the
furnace. Considering that the deposited Ni film is continuous and uniform, the appearance
of strong carbide signal (from Si in SiC) suggests that Ni
2
Si tended to form islands during
the annealing. With the Ni thickness doubled (Fig. 10b), the amount of Ni
2
Si increases
obviously and the detected amount of SiC decreases. The Ni silicide island can grow both
laterally and vertically. Increasing Ni thickness even more (Fig. 10c) results in the
disappearance of SiC signal and Ni
2
Si is dominant. The above results indicate that the
silicide becomes continuous with increasing Ni film thickness.
0 500 1000 1500 2000 2500
d) 50 nm
Etch time (s)
0 200 400 600 800
Etch time (s)
b) 6 nm
0 200 400 600 800
0
20
40
60
80
Atomic percent (%)
c) 17 nm
0 200 400
0
20
40
60
80
a) 3 nm
C
Atomic percent (%)
Si
Ni
Fig. 10. In-situ Si2p XPS spectra of Ni/SiC samples after annealing at 800ºC for 20 min in
vacuum. a) t
Ni
= 3 nm b) t
Ni
= 6 nm c) t
Ni
= 17 nm d) t
Ni
= 6 nm. In Fig. a-c), the Ni thin films
were deposited on as-delivered SiC substrate. In Fig. d), the SiC substrate was cleaned by Ar
ion etching with 4 keV energy before Ni deposition.
Fig. 10b) and d) give the XPS Si 2p peak recorded from the samples with same initial Ni
layer thickness (d
Ni
= ~ 6 nm) but different pre-treatment on SiC substrate. From the
comparison it has been found that the shoulder at higher binding energy representing Si in
SiC disappears when the Ni thin film is deposited on an argon ion etched SiC substrate. This
is again related to the fast dissociation of SiC and enhanced diffusion of Ni under the action
of argon ion pre-treatment. The nucleation and growth of Ni
2
Si are promoted. Therefore, the
silicides formation kinetics is affected and a continuous silicide layer develops quicker.
Properties and Applications of Silicon Carbide184
Fig. 11. Binding energy of Ni 2p
3/2
peaks as function of (a) Ni layer thickness (the SiC
substrate was cleaned by Ar ion etching with 4 kev energy before Ni deposition), and (b)
pre-treatment (d
Ni
= 50 nm )
The silicides formed at the interface depend also on the Ni layer thickness and the pre-
treatment on SiC substrate prior to the Ni deposition. Figure 11 shows the development of
Ni 2p
3/2
peak position as function of initial Ni layer thickness and pre-treatment. From
Fig.11 a), we see that for thin Ni layers (d
Ni
= 3, 6, 17 nm), NiSi, NiSi
2
or even higher Si
containing silicides are formed at the interface. It has been known that higher amount of Si
in the silicides gives higher binding energy position (Fig. 2e). The reason why Si-richer
silicides are formed may be attributed to the considerable consumption of nickel. Because
the metal supply is likely to be more limited, one could expect the formation of Si-richer
silicides following Ni
2
Si. Anyway, the total amount of Si rich silicide is small because of the
low availability of Ni near the interface. For fixed Ni film thickness (50 nm), the influence of
argon ion etching pre-treatment on the type of interfacial silicide is shown in Figure 11b). In
the contact layer (I), the binding energy fluctuation (as also observed in Fig. 11 a) results
from the effect of ion bombardment (at the beginning) and the alternating composition
changes in depth (see Fig. 9). At the interface (II), the sample without pre-treatment has
higher Ni 2p
3/2
binding energy value. This implies that a compositional gradient existed and
that Si-richer silicides are formed at the interface. The reason may be also attributed to the
limited availability of nickel. On the other hand, argon ion etching pre-treatment enhances
the Ni diffusion and accelerate the supply of Ni and almost keeps the same kind of silicide
all the time.
3. Ta (or Ni/Ta)-SiC
Tantalum (Ta) is a refractory metal with high melting point (around 3000C) and it exhibits
two crystalline phases, bcc α-phase and tetragonal β-phase. The α-phase has high toughness
and ductility as well as low electrical resistivity and corrosion resistance, while the β-phase
is hard and brittle and less desirable. Tantalum can form both stable carbides and silicides
with attractive properties with respect to oxidation resistance and general physical
behaviour. There exist two stable carbides in the Ta-C system,
Ta
2
C and TaC, with the
melting points of 3330C and 3985C, respectively. Both these carbides are interstitial
compounds and thermally very stable. For example, TaC has been used for reinforcing Ni
superalloys (Berthod et al., 2004). The research on contacts involving Ta on SiC is not as
extensive as that on Ni contacts. Attempts have been made to create ohmic contacts on SiC
by using elemental Ta, and its silicide or carbide (Olowolafe et al, 2005;, Guziewicz, 2006,
Jang et al., 1999; Cao et al, 2007
a,b
).
3.1 Thermodynamics of Ta-Si-C system
Fig. 12. Simplified isotherm ternary phase diagram of Ta-Si-C at 1000
o
C (Schuster, 1993-
1994).
An isothermal section of Ta-Si-C at 1000
o
C is shown in Fig. 12 (Schuster, 1993-1994). It might
apply at temperatures up to 1827
o
C (Brewer and Krikorian, 1956). It can be seen from the figure
that SiC can be in equilibrium with both TaC and TaSi
2
. The author proposed the existence of a
ternary compound Ta
5
Si
3
C
1-x
(x ≈ 0.5) which can coexist with TaC, Ta
2
C, Ta
2
Si, Ta
5
Si
3
and TaSi
2
.
However, the status of this compound is in doubt (Laurila et al., 2002), since it is not clear if it is a
real ternary compound or simply the metastable Ta
5
Si
3
with carbon solubility.
Compound ΔH (kcal/g atom)* Reaction ΔH
R
(kcal/g atom)*
SiC -26.7 4Ta+SiC = Ta
2
C+Ta
2
Si - 4.9
Ta
2
Si -10.1 3Ta+SiC = TaC+Ta
2
Si -4.3
Ta
5
Si3 -9.0 5Ta+2SiC = 2Ta
2
C+TaSi
2
-5.2
TaSi
2
-8.0 3Ta+2SiC = 2TaC+TaSi
2
-4.4
Ta
2
C -46 11Ta+3SiC = 3Ta
2
C+Ta
5
Si
3
-3.9
TaC -38
*ΔH: Standard heats of formation
ΔH
R
: Enthalpy change for the reaction of Ta and SiC at 800
o
C.
Table 2. Thermodynamic data in Ta-Si-Ta system (Geib et al., 1990)
Contact Formation on Silicon Carbide by Use
of Nickel and Tantalum from a Materials Science Point of View 185
Fig. 11. Binding energy of Ni 2p
3/2
peaks as function of (a) Ni layer thickness (the SiC
substrate was cleaned by Ar ion etching with 4 kev energy before Ni deposition), and (b)
pre-treatment (d
Ni
= 50 nm )
The silicides formed at the interface depend also on the Ni layer thickness and the pre-
treatment on SiC substrate prior to the Ni deposition. Figure 11 shows the development of
Ni 2p
3/2
peak position as function of initial Ni layer thickness and pre-treatment. From
Fig.11 a), we see that for thin Ni layers (d
Ni
= 3, 6, 17 nm), NiSi, NiSi
2
or even higher Si
containing silicides are formed at the interface. It has been known that higher amount of Si
in the silicides gives higher binding energy position (Fig. 2e). The reason why Si-richer
silicides are formed may be attributed to the considerable consumption of nickel. Because
the metal supply is likely to be more limited, one could expect the formation of Si-richer
silicides following Ni
2
Si. Anyway, the total amount of Si rich silicide is small because of the
low availability of Ni near the interface. For fixed Ni film thickness (50 nm), the influence of
argon ion etching pre-treatment on the type of interfacial silicide is shown in Figure 11b). In
the contact layer (I), the binding energy fluctuation (as also observed in Fig. 11 a) results
from the effect of ion bombardment (at the beginning) and the alternating composition
changes in depth (see Fig. 9). At the interface (II), the sample without pre-treatment has
higher Ni 2p
3/2
binding energy value. This implies that a compositional gradient existed and
that Si-richer silicides are formed at the interface. The reason may be also attributed to the
limited availability of nickel. On the other hand, argon ion etching pre-treatment enhances
the Ni diffusion and accelerate the supply of Ni and almost keeps the same kind of silicide
all the time.
3. Ta (or Ni/Ta)-SiC
Tantalum (Ta) is a refractory metal with high melting point (around 3000C) and it exhibits
two crystalline phases, bcc α-phase and tetragonal β-phase. The α-phase has high toughness
and ductility as well as low electrical resistivity and corrosion resistance, while the β-phase
is hard and brittle and less desirable. Tantalum can form both stable carbides and silicides
with attractive properties with respect to oxidation resistance and general physical
behaviour. There exist two stable carbides in the Ta-C system,
Ta
2
C and TaC, with the
melting points of 3330C and 3985C, respectively. Both these carbides are interstitial
compounds and thermally very stable. For example, TaC has been used for reinforcing Ni
superalloys (Berthod et al., 2004). The research on contacts involving Ta on SiC is not as
extensive as that on Ni contacts. Attempts have been made to create ohmic contacts on SiC
by using elemental Ta, and its silicide or carbide (Olowolafe et al, 2005;, Guziewicz, 2006,
Jang et al., 1999; Cao et al, 2007
a,b
).
3.1 Thermodynamics of Ta-Si-C system
Fig. 12. Simplified isotherm ternary phase diagram of Ta-Si-C at 1000
o
C (Schuster, 1993-
1994).
An isothermal section of Ta-Si-C at 1000
o
C is shown in Fig. 12 (Schuster, 1993-1994). It might
apply at temperatures up to 1827
o
C (Brewer and Krikorian, 1956). It can be seen from the figure
that SiC can be in equilibrium with both TaC and TaSi
2
. The author proposed the existence of a
ternary compound Ta
5
Si
3
C
1-x
(x ≈ 0.5) which can coexist with TaC, Ta
2
C, Ta
2
Si, Ta
5
Si
3
and TaSi
2
.
However, the status of this compound is in doubt (Laurila et al., 2002), since it is not clear if it is a
real ternary compound or simply the metastable Ta
5
Si
3
with carbon solubility.
Compound ΔH (kcal/g atom)* Reaction ΔH
R
(kcal/g atom)*
SiC -26.7 4Ta+SiC = Ta
2
C+Ta
2
Si - 4.9
Ta
2
Si -10.1 3Ta+SiC = TaC+Ta
2
Si -4.3
Ta
5
Si3 -9.0 5Ta+2SiC = 2Ta
2
C+TaSi
2
-5.2
TaSi
2
-8.0 3Ta+2SiC = 2TaC+TaSi
2
-4.4
Ta
2
C -46 11Ta+3SiC = 3Ta
2
C+Ta
5
Si
3
-3.9
TaC -38
*ΔH: Standard heats of formation
ΔH
R
: Enthalpy change for the reaction of Ta and SiC at 800
o
C.
Table 2. Thermodynamic data in Ta-Si-Ta system (Geib et al., 1990)
Properties and Applications of Silicon Carbide186
The thermodynamic driving force for the Ta/SiC reactions also originates from the negative
Gibb’s free energy of Ta silicide or carbide formation. The standard heats of formation and
calculated enthalpy changes, ΔH
R
, for the various reactions within the Ta-Si-C system are
illustrated in Table 2 (Geib et al., 1990). It can be seen that the standard heats of formation of
Ta carbides Ta
2
C and TaC are larger than that of SiC. Assuming the entropy contribution to
be small, the change of Gibb’s free energy can be approximated by ΔH
R
. The negative values
at this temperature imply that the reaction between Ta and SiC is energetically favorable.
3.2 Reaction between Ta film and SiC
Table 3 summarizes the evolution of the thermal reaction
between Ta film and SiC substrate
up to 1200
o
C (Chen et al., 1994, Cao et al., 2007
a
). Similar phase sequence has been reported
(Feng et al., 1997) for SiC/Ta/SiC couples at 1500
o
C, while α-Ta
5
Si
3
was not observed.
Ta
5
Si
3
:C here is a carbon-stabilized phase with a hexagonal Mn
5
Si
3
structure according to the
XRD powder diffraction database. It is in fact the same compound as the ternary compound
Ta
5
Si
3
C
x
reported by some researchers.
Temperature /
time
Reaction products in
Ta/SiC system
Reaction products in
Ni/Ta/SiC system
Initial film
thickness on SiC
650
o
C /0.5 h Ta Amorphous Ni-Ta, Ta, Ta
2
C 100 nm
800
o
C /0.5 h Ta + Ta
2
C Ta
2
C, Ta
5
Si
3
:C, Ta(?) 100 nm
900
o
C / 1 h Ta + Ta
2
C + Ta
5
Si
3
:C
320 nm
950
o
C/0.5 h Ta + Ta
2
C + Ta
5
Si
3
:C
Ta
2
C, TaC, Ta
5
Si
3
:C, Ta
5
Si
3
,
TaNiSi, Ni
2
Si
100 nm
1000
o
C/1 h TaC + Ta
5
Si
3
:C + α-
Ta
5
Si
3
+ Ta
2
C
320 nm
1100
o
C/0.5 h TaC + Ta
5
Si
3
:C 320 nm
1200
o
C/1 h TaC + TaSi
2
320 nm
Table 3. Evolution of the thermal reaction between Ta (or Ni/Ta) and SiC (Chen et al., 1994,
Cao et al., 2007
a,b
). In Ni/Ta/SiC system, the thickness ratio of Ni:Ta is ~3:5.
One important feature in the thin film Ta/SiC system is the development of layered
structure at high temperatures. Figure 13 shows the Auger depth profiles obtained after
annealing at different temperatures in vacuum. Compared to the as-deposited film (Fig.
13a), less sharp interface in Fig. 13b suggests that inter-diffusion has occurred at 650
o
C.
Carbon, which corresponds to the formation of Ta
2
C carbide, is observed in the contact layer
after annealing at 800
o
C (see Fig. 13c). Clearly, more Ta
2
C is formed at 950C (Fig. 13d). No
Si signal is detected in the near surface region, confirming the lack of silicide on the top
surface. This can be further confirmed by the XRD analyses at 950
o
C (Fig.14), in which
Ta
5
Si
3
:C is not able be observed by using grazing angle 1
o
. However, it can be detected by
using grazing angle 3
o
. Ta
5
Si
3
:C must tend to form at a certain distance below the surface. A
mixture layer of Ta
5
Si
3
:C and Ta
2
C is present there. The reaction zone is shown to have a
layered structure of Ta
2
C/Ta
2
C+Ta
5
Si
3
:C/SiC after heating at 950
o
C (Cao et al., 2007
a
). With
the temperature increasing to 1000
o
C, it changes to a well defined four-layered structure
Ta
2
C/α-Ta
5
Si
3
/Ta
5
Si
3
:C/TaC/SiC (Chen et al., 1994). In fact, the layered structure is inclined
to form when the vanadium group metals (V, Nb and Ta) react thermally with SiC at high
0
2000
4000
6000
8000
10000
Derivative peak height (cps / eV)
Si
C
Ta
a) deposited state
b) 650
o
C, 30min
0 80 160 240
0
2000
4000
6000
8000
10000
c) 800
o
C, 30 min
0 80 160 240 320
Depth (nm)
d) 950
o
C, 30 min
temperatures. The layered structure can be attributed to the requirement of the
minimization of the interfacial energy.
Fig. 13. Depth profiles of Ta/SiC before and after annealing in vacuum at different
temperatures with Ta thickness of 100 nm. The depth scale is given by using the etch rate of
Ta
2
O
5
with known thickness under the same condition (8 nm/min).
Another important feature in the thin film Ta/SiC system is the formation of the C
deficiency region in the near interface side of the SiC. The apparent atomic concentrations of
C and Si in the thermal reaction product are given in Fig. 15 by considering the area
percentages for the corresponding chemical states obtained from the curve fitting of XPS
C1s and Si2p peak. The distribution of phases obtained at 800 and 950C is further
confirmed. Besides un-reacted metal Ta, as mentioned before, the reaction zone is shown to
have a layered structure of Ta
2
C/Ta
2
C+Ta
5
Si
3
:C/SiC. Importantly, it can be seen that the
total amount of C is higher than that of Si in the reaction layers formed at both 800 C and
950C. This means more C diffuses towards the Ta layer from the substrate. Carbon has a
high diffusivity in Ta (D = 6.7×10
3
exp (-161.6/RT) cm
2
/s, for T = 463-2953K and R = 8.314 J
mol
-1
K
-1
) (Le Claire, 1999). It is the dominant moving species and reacts more rapidly with
Ta than Si. In other words, C deficiency region is preferentially produced in the near
interface side of the SiC.
Contact Formation on Silicon Carbide by Use
of Nickel and Tantalum from a Materials Science Point of View 187
The thermodynamic driving force for the Ta/SiC reactions also originates from the negative
Gibb’s free energy of Ta silicide or carbide formation. The standard heats of formation and
calculated enthalpy changes, ΔH
R
, for the various reactions within the Ta-Si-C system are
illustrated in Table 2 (Geib et al., 1990). It can be seen that the standard heats of formation of
Ta carbides Ta
2
C and TaC are larger than that of SiC. Assuming the entropy contribution to
be small, the change of Gibb’s free energy can be approximated by ΔH
R
. The negative values
at this temperature imply that the reaction between Ta and SiC is energetically favorable.
3.2 Reaction between Ta film and SiC
Table 3 summarizes the evolution of the thermal reaction
between Ta film and SiC substrate
up to 1200
o
C (Chen et al., 1994, Cao et al., 2007
a
). Similar phase sequence has been reported
(Feng et al., 1997) for SiC/Ta/SiC couples at 1500
o
C, while α-Ta
5
Si
3
was not observed.
Ta
5
Si
3
:C here is a carbon-stabilized phase with a hexagonal Mn
5
Si
3
structure according to the
XRD powder diffraction database. It is in fact the same compound as the ternary compound
Ta
5
Si
3
C
x
reported by some researchers.
Temperature /
time
Reaction products in
Ta/SiC system
Reaction products in
Ni/Ta/SiC system
Initial film
thickness on SiC
650
o
C /0.5 h Ta Amorphous Ni-Ta, Ta, Ta
2
C 100 nm
800
o
C /0.5 h Ta + Ta
2
C Ta
2
C, Ta
5
Si
3
:C, Ta(?) 100 nm
900
o
C / 1 h Ta + Ta
2
C + Ta
5
Si
3
:C
320 nm
950
o
C/0.5 h Ta + Ta
2
C + Ta
5
Si
3
:C
Ta
2
C, TaC, Ta
5
Si
3
:C, Ta
5
Si
3
,
TaNiSi, Ni
2
Si
100 nm
1000
o
C/1 h TaC + Ta
5
Si
3
:C + α-
Ta
5
Si
3
+ Ta
2
C
320 nm
1100
o
C/0.5 h TaC + Ta
5
Si
3
:C 320 nm
1200
o
C/1 h TaC + TaSi
2
320 nm
Table 3. Evolution of the thermal reaction between Ta (or Ni/Ta) and SiC (Chen et al., 1994,
Cao et al., 2007
a,b
). In Ni/Ta/SiC system, the thickness ratio of Ni:Ta is ~3:5.
One important feature in the thin film Ta/SiC system is the development of layered
structure at high temperatures. Figure 13 shows the Auger depth profiles obtained after
annealing at different temperatures in vacuum. Compared to the as-deposited film (Fig.
13a), less sharp interface in Fig. 13b suggests that inter-diffusion has occurred at 650
o
C.
Carbon, which corresponds to the formation of Ta
2
C carbide, is observed in the contact layer
after annealing at 800
o
C (see Fig. 13c). Clearly, more Ta
2
C is formed at 950C (Fig. 13d). No
Si signal is detected in the near surface region, confirming the lack of silicide on the top
surface. This can be further confirmed by the XRD analyses at 950
o
C (Fig.14), in which
Ta
5
Si
3
:C is not able be observed by using grazing angle 1
o
. However, it can be detected by
using grazing angle 3
o
. Ta
5
Si
3
:C must tend to form at a certain distance below the surface. A
mixture layer of Ta
5
Si
3
:C and Ta
2
C is present there. The reaction zone is shown to have a
layered structure of Ta
2
C/Ta
2
C+Ta
5
Si
3
:C/SiC after heating at 950
o
C (Cao et al., 2007
a
). With
the temperature increasing to 1000
o
C, it changes to a well defined four-layered structure
Ta
2
C/α-Ta
5
Si
3
/Ta
5
Si
3
:C/TaC/SiC (Chen et al., 1994). In fact, the layered structure is inclined
to form when the vanadium group metals (V, Nb and Ta) react thermally with SiC at high
0
2000
4000
6000
8000
10000
Derivative peak height (cps / eV)
Si
C
Ta
a) deposited state
b) 650
o
C, 30min
0 80 160 240
0
2000
4000
6000
8000
10000
c) 800
o
C, 30 min
0 80 160 240 320
Depth (nm)
d) 950
o
C, 30 min
temperatures. The layered structure can be attributed to the requirement of the
minimization of the interfacial energy.
Fig. 13. Depth profiles of Ta/SiC before and after annealing in vacuum at different
temperatures with Ta thickness of 100 nm. The depth scale is given by using the etch rate of
Ta
2
O
5
with known thickness under the same condition (8 nm/min).
Another important feature in the thin film Ta/SiC system is the formation of the C
deficiency region in the near interface side of the SiC. The apparent atomic concentrations of
C and Si in the thermal reaction product are given in Fig. 15 by considering the area
percentages for the corresponding chemical states obtained from the curve fitting of XPS
C1s and Si2p peak. The distribution of phases obtained at 800 and 950C is further
confirmed. Besides un-reacted metal Ta, as mentioned before, the reaction zone is shown to
have a layered structure of Ta
2
C/Ta
2
C+Ta
5
Si
3
:C/SiC. Importantly, it can be seen that the
total amount of C is higher than that of Si in the reaction layers formed at both 800 C and
950C. This means more C diffuses towards the Ta layer from the substrate. Carbon has a
high diffusivity in Ta (D = 6.7×10
3
exp (-161.6/RT) cm
2
/s, for T = 463-2953K and R = 8.314 J
mol
-1
K
-1
) (Le Claire, 1999). It is the dominant moving species and reacts more rapidly with
Ta than Si. In other words, C deficiency region is preferentially produced in the near
interface side of the SiC.
Properties and Applications of Silicon Carbide188
60 80 100 120
800
o
C, 1
o
950
o
C, 1
o
2 (
o
)
Ta
5
Si
3
Ta
2
C
Ta
Intensity
950
o
C, 3
o
650
o
C, 1
o
Fig. 14. Grazing angle XRD spectra with Cr k
α
radiation of Ta/SiC after annealing in
vacuum. The thickness ratio of Ni:Ta is ~3:5 and the total film thickness is ~100 nm.
Fig. 15. Apparent atomic concentration of C and Si in the reaction layer with the depth.
Ta/SiC samples with 100 nm Ta thickness were annealed at different temperatures in
vacuum. Si and C from the SiC substrate are not included in the Fig. The depth is given by
using the etch rate of Ta
2
O
5
. (Cao et al., 2007
a
).
0 50 100 150
0
5
10
15
0
5
10
15
b) 800
o
C
Apparent atomic percent (%)
Depth (nm)
Ta
2
C +Ta
5
Si
3
:C
Ta
2
C
a) 950
o
C
Si
C
40 60 80 100 120
2
(
O
)
a) 650
o
C, 30 min
b) 800
o
C, 30 min
Ta
Ta
Ta
5
Si
3
:C
Ta
5
Si
3
Ni
2
Si
TaNiSiTaCTa
2
C
c) 950
o
C, 30 min
3.3. Effect of Ni incorporation in thin film Ta/SiC system
Table 3 and Fig. 16 summarize the evolution of the thermal reaction between a dual metal
Ni/Ta films on SiC substrate up to 950
o
C by means of grazing angle XRD. The deposited Ta
and Ni films usually have crystalline structure. However, no reflection from metallic Ni can
be observed for the samples treated at 650
o
. A broad diffraction peak in the region of 56-65
o
superimposed on the α-Ta and Ta
2
C diffraction peaks (Fig. 16a) probably come from the
amorphous phase produced by solid-state reaction. The driving force for amorphous phase
formation is generally expected from the large negative enthalpy of mixing for the Ni/Ta
system (Zhang et al., 2000). It has been reported that annealing polycrystalline Ni/Ta
multilayers at between 673 and 773 K led to the formation of amorphous phase (Liu &
Zhang, 1994; Hollanders et al., 1991). Amorphous Ni-Ta can also be achieved by mechanical
milling (Lee et al., 1997), rapid quenching (Fedorov et al., 1986) and ion irradiation (Liu &
Zhang, 1994). With increasing temperature, crystallization of Ni-Ta amorphous is expected.
The crystallization temperature is related to the composition of the amorphous alloy and
activation energy exhibits a maximum near the eutectic composition.
For the film annealed at 800
o
C (Fig. 16b) diffractions of Ta
2
C and metastable carbon-
stabilized Ta
5
Si
3
:C are observed. However, as certain Ta peaks overlap with those of Ta
2
C, a
minor amount of un-reacted Ta could also be present. It is difficult to ascertain any
crystallised Ni-Ta compound or Ni silicide by the XRD pattern. Annealing at 950C results
in the presence of both the stable carbides Ta
2
C and TaC (Fig. 16c), the latter of which is
dominant. Ta
5
Si
3
:C and stable α-Ta
5
Si
3
are also confirmed. In spite of the XRD peak
overlapping, the formation of binary Ni
2
Si and ternary TaNiSi silicides could be possible.
Fig. 16. Grazing angle XRD spectra of Ni/Ta films on SiC after annealing in vacuum. The
thickness ratio of Ni:Ta is ~3:5 and the total film thickness is ~100 nm. Glancing angle 3
o
with Cr k
α
radiation (λ = 2.29Å)
Contact Formation on Silicon Carbide by Use
of Nickel and Tantalum from a Materials Science Point of View 189
60 80 100 120
800
o
C, 1
o
950
o
C, 1
o
2 (
o
)
Ta
5
Si
3
Ta
2
C
Ta
Intensity
950
o
C, 3
o
650
o
C, 1
o
Fig. 14. Grazing angle XRD spectra with Cr k
α
radiation of Ta/SiC after annealing in
vacuum. The thickness ratio of Ni:Ta is ~3:5 and the total film thickness is ~100 nm.
Fig. 15. Apparent atomic concentration of C and Si in the reaction layer with the depth.
Ta/SiC samples with 100 nm Ta thickness were annealed at different temperatures in
vacuum. Si and C from the SiC substrate are not included in the Fig. The depth is given by
using the etch rate of Ta
2
O
5
. (Cao et al., 2007
a
).
0 50 100 150
0
5
10
15
0
5
10
15
b) 800
o
C
Apparent atomic percent (%)
Depth (nm)
Ta
2
C +Ta
5
Si
3
:C
Ta
2
C
a) 950
o
C
Si
C
40 60 80 100 120
2 (
O
)
a) 650
o
C, 30 min
b) 800
o
C, 30 min
Ta
Ta
Ta
5
Si
3
:C
Ta
5
Si
3
Ni
2
Si
TaNiSiTaCTa
2
C
c) 950
o
C, 30 min
3.3. Effect of Ni incorporation in thin film Ta/SiC system
Table 3 and Fig. 16 summarize the evolution of the thermal reaction between a dual metal
Ni/Ta films on SiC substrate up to 950
o
C by means of grazing angle XRD. The deposited Ta
and Ni films usually have crystalline structure. However, no reflection from metallic Ni can
be observed for the samples treated at 650
o
. A broad diffraction peak in the region of 56-65
o
superimposed on the α-Ta and Ta
2
C diffraction peaks (Fig. 16a) probably come from the
amorphous phase produced by solid-state reaction. The driving force for amorphous phase
formation is generally expected from the large negative enthalpy of mixing for the Ni/Ta
system (Zhang et al., 2000). It has been reported that annealing polycrystalline Ni/Ta
multilayers at between 673 and 773 K led to the formation of amorphous phase (Liu &
Zhang, 1994; Hollanders et al., 1991). Amorphous Ni-Ta can also be achieved by mechanical
milling (Lee et al., 1997), rapid quenching (Fedorov et al., 1986) and ion irradiation (Liu &
Zhang, 1994). With increasing temperature, crystallization of Ni-Ta amorphous is expected.
The crystallization temperature is related to the composition of the amorphous alloy and
activation energy exhibits a maximum near the eutectic composition.
For the film annealed at 800
o
C (Fig. 16b) diffractions of Ta
2
C and metastable carbon-
stabilized Ta
5
Si
3
:C are observed. However, as certain Ta peaks overlap with those of Ta
2
C, a
minor amount of un-reacted Ta could also be present. It is difficult to ascertain any
crystallised Ni-Ta compound or Ni silicide by the XRD pattern. Annealing at 950C results
in the presence of both the stable carbides Ta
2
C and TaC (Fig. 16c), the latter of which is
dominant. Ta
5
Si
3
:C and stable α-Ta
5
Si
3
are also confirmed. In spite of the XRD peak
overlapping, the formation of binary Ni
2
Si and ternary TaNiSi silicides could be possible.
Fig. 16. Grazing angle XRD spectra of Ni/Ta films on SiC after annealing in vacuum. The
thickness ratio of Ni:Ta is ~3:5 and the total film thickness is ~100 nm. Glancing angle 3
o
with Cr k
α
radiation (λ = 2.29Å)
Properties and Applications of Silicon Carbide190
0 10 20 30 40
0,0
0,2
0,4
0,6
0,8
1,0
0 10 20 30 40
0,0
0,2
0,4
0,6
0,8
1,0
0 10 20 30 40
0,0
0,1
0,2
0,3
0,4
0,5
0,6
0,7
0,8
0,9
1,0
0 10 20 30 40
0,0
0,1
0,2
0,3
0,4
0,5
0,6
0,7
0,8
0,9
1,0
Apparent atomic percent (%)
Etch time (min)
Ta
Si
C
Ni
a) As-deposited
Apprarent atomic percent(%)
Etch time (min)
Ta
Si
C
Ni
b) 650
o
C, 30 min
c) 800
o
C, 30 min
Apparent atomic percent (%)
Etch time (min)
Ta
Si
C
Ni
d) 950
o
C, 30 min
Apprarent atomic percent (%)
Etch time (min)
Ta
Si
C
Ni
By comparison of the phases formed between Ta/SiC and Ni/Ta/SiC system at the same
temperatures (Table 3), it is found that the dual layer Ni/Ta lowers the temperature at
which Ta
2
C, Ta
5
Si
3
:C, TaC or α-Ta
5
Si
3
can be detected by grazing angle XRD. It is thus
concluded that the existence of Ni promotes the reaction between Ta and SiC, lowering the
formation temperature of Ta carbide and silicide.
Fig. 17. Auger depth profiles of annealed Ni/Ta/SiC samples. The thickness ratio of Ni:Ta is
~3:5 and the total film thickness is ~100 nm.
The etch rate calibrated on Ta2O5 with known
thickness is 8 nm/min.
The atomic concentration is obtained by using the measured Auger
peak-to-peak intensities and relative sensitive factors deduced from the elementary
intensities of the as-deposited sample.
Figure 17 gives the apparent atomic concentration vs. etch time. The as-deposited sample
(Fig. 17a) possessed a rather sharp interface. Annealing at 650C results in evident change of
element distribution (Fig. 17b). The reaction zone is composed of two parts: an upper region
of mainly Ni-Ta amorphous mixture and an inner region of metallic Ta and Ta
2
C. The Ta
2
C
layer is supposed to be related to the fast diffusion of C being released from SiC.
Apparently, as no Si is evident from the reaction layers within the depth profile, it is
suggested that the C moves faster outwards through the coated layer and that it also reacts
more readily with the deposited Ta. There is minor amount of Ni dissolved in the inner Ta
phase as well. The Ni can act as mediating agent to trigger readily the reaction between Ta
and SiC. Compared to the Ta atom, the Ni atom has smaller size (atomic radii of Ni and Ta
are 1.62Å and 2.09Å, respectively). Some dissolved Ni atoms might partially penetrate into
the SiC substrate at the interface with the help of the thermal activation. As discussed for
Ni-SiC system, such kind of defect decreases the stability of the SiC, leading to the more
weakened Si-C covalent bonds adjacent to the metal layer compared to Ta/SiC system. The
decomposition of SiC is therefore easier at 650
o
C, accelerating the reactions between the Ta
and SiC.
For the sample annealed at 800
o
C (Fig. 17c), the reaction between Ta and SiC proceeds
further to form Ta
2
C and Ta
5
Si
3
:C in the inner part. The increase in C concentration next to
the interface implies the possible formation of TaC, although this is not the dominant
carbide. The adjacent increase in Ni and Si concentrations suggests the presence of Ni
silicide.
A well-defined layer structure is formed at 950C as shown in Fig. 17d. This high
temperature is required for outwards Si diffusion and subsequent initiation of the reaction
with both Ni and Ta to form the top TaNiSi layer. This layer probably also has embedded
Ta
2
C, Ta
5
S
3
:C and α-Ta
5
Si
3
. A thin Ni-rich layer is observed close to the coating/substrate
interface, probably corresponding to the Ni
2
Si phase. The intermediate region between these
two layers is composed of TaC. The layered structure can be attributed to the requirement of
minimization of the interfacial energy. It has been found that annealing a Ta-Ni alloy on a Si
substrate results in TaSi
2
phase in the outer region and Ni silicide in the inner region next to
the Si (Hung et al., 1986). Annealing amorphous Ni-Ta alloy film on GaAs (Lahav et al.,
1987) leads to similar phase separation with an upper region of Ta(Ni)As and an inner
region of NiGa. The common factor in these two systems is the layer structure with near-
noble metal Ni compounds in contact with the substrate and refractory metal Ta compounds
in the outer region. It appears that the sample heated at 950
o
C has this trend of phase
separation. Whether the top TaNiSi disappears or not and how the binary Ni or Ta
compounds evolve progressively upon further annealing is of interest.
In the Ta/SiC system, the C atoms move faster than Si outwards through the coated layer
and also react more readily with the deposited Ta. The total C content was higher than that
of Si in the reaction product when the temperature is at or above 650
o
C, indicating the
formation of C deficiency region in the near interface side of the SiC. It has been proposed
that the transition of Schottky to ohmic contacts during high temperature annealing is due
to the creation of sufficient C vacancies in the near interface region of the SiC (Han et al.,
2002; Nikitina et al., 2005). The C vacancies then act as donors to increase the net
concentration of electrons and thus change the electrical properties of the SiC in the near
surface region, resulting in the formation of ohmic contact. However, rectifying behaviour at
650C (Cao et al., 2007
b
) suggests that this mechanism is doubtful since plenty of C vacancies
have formed at this temperature. Furthermore, rather deep ionization energy level of 0.51
eV (Aboelfotoh & Doyle, 1999) makes the carbon vacancy mechanism questionable as well.
Instead of simple isolated C vacancies, more complicated defect configuration might be
responsible for the formation of ohmic contacts.
Contact Formation on Silicon Carbide by Use
of Nickel and Tantalum from a Materials Science Point of View 191
0 10 20 30 40
0,0
0,2
0,4
0,6
0,8
1,0
0 10 20 30 40
0,0
0,2
0,4
0,6
0,8
1,0
0 10 20 30 40
0,0
0,1
0,2
0,3
0,4
0,5
0,6
0,7
0,8
0,9
1,0
0 10 20 30 40
0,0
0,1
0,2
0,3
0,4
0,5
0,6
0,7
0,8
0,9
1,0
Apparent atomic percent (%)
Etch time (min)
Ta
Si
C
Ni
a) As-deposited
Apprarent atomic percent(%)
Etch time (min)
Ta
Si
C
Ni
b) 650
o
C, 30 min
c) 800
o
C, 30 min
Apparent atomic percent (%)
Etch time (min)
Ta
Si
C
Ni
d) 950
o
C, 30 min
Apprarent atomic percent (%)
Etch time (min)
Ta
Si
C
Ni
By comparison of the phases formed between Ta/SiC and Ni/Ta/SiC system at the same
temperatures (Table 3), it is found that the dual layer Ni/Ta lowers the temperature at
which Ta
2
C, Ta
5
Si
3
:C, TaC or α-Ta
5
Si
3
can be detected by grazing angle XRD. It is thus
concluded that the existence of Ni promotes the reaction between Ta and SiC, lowering the
formation temperature of Ta carbide and silicide.
Fig. 17. Auger depth profiles of annealed Ni/Ta/SiC samples. The thickness ratio of Ni:Ta is
~3:5 and the total film thickness is ~100 nm.
The etch rate calibrated on Ta2O5 with known
thickness is 8 nm/min.
The atomic concentration is obtained by using the measured Auger
peak-to-peak intensities and relative sensitive factors deduced from the elementary
intensities of the as-deposited sample.
Figure 17 gives the apparent atomic concentration vs. etch time. The as-deposited sample
(Fig. 17a) possessed a rather sharp interface. Annealing at 650C results in evident change of
element distribution (Fig. 17b). The reaction zone is composed of two parts: an upper region
of mainly Ni-Ta amorphous mixture and an inner region of metallic Ta and Ta
2
C. The Ta
2
C
layer is supposed to be related to the fast diffusion of C being released from SiC.
Apparently, as no Si is evident from the reaction layers within the depth profile, it is
suggested that the C moves faster outwards through the coated layer and that it also reacts
more readily with the deposited Ta. There is minor amount of Ni dissolved in the inner Ta
phase as well. The Ni can act as mediating agent to trigger readily the reaction between Ta
and SiC. Compared to the Ta atom, the Ni atom has smaller size (atomic radii of Ni and Ta
are 1.62Å and 2.09Å, respectively). Some dissolved Ni atoms might partially penetrate into
the SiC substrate at the interface with the help of the thermal activation. As discussed for
Ni-SiC system, such kind of defect decreases the stability of the SiC, leading to the more
weakened Si-C covalent bonds adjacent to the metal layer compared to Ta/SiC system. The
decomposition of SiC is therefore easier at 650
o
C, accelerating the reactions between the Ta
and SiC.
For the sample annealed at 800
o
C (Fig. 17c), the reaction between Ta and SiC proceeds
further to form Ta
2
C and Ta
5
Si
3
:C in the inner part. The increase in C concentration next to
the interface implies the possible formation of TaC, although this is not the dominant
carbide. The adjacent increase in Ni and Si concentrations suggests the presence of Ni
silicide.
A well-defined layer structure is formed at 950C as shown in Fig. 17d. This high
temperature is required for outwards Si diffusion and subsequent initiation of the reaction
with both Ni and Ta to form the top TaNiSi layer. This layer probably also has embedded
Ta
2
C, Ta
5
S
3
:C and α-Ta
5
Si
3
. A thin Ni-rich layer is observed close to the coating/substrate
interface, probably corresponding to the Ni
2
Si phase. The intermediate region between these
two layers is composed of TaC. The layered structure can be attributed to the requirement of
minimization of the interfacial energy. It has been found that annealing a Ta-Ni alloy on a Si
substrate results in TaSi
2
phase in the outer region and Ni silicide in the inner region next to
the Si (Hung et al., 1986). Annealing amorphous Ni-Ta alloy film on GaAs (Lahav et al.,
1987) leads to similar phase separation with an upper region of Ta(Ni)As and an inner
region of NiGa. The common factor in these two systems is the layer structure with near-
noble metal Ni compounds in contact with the substrate and refractory metal Ta compounds
in the outer region. It appears that the sample heated at 950
o
C has this trend of phase
separation. Whether the top TaNiSi disappears or not and how the binary Ni or Ta
compounds evolve progressively upon further annealing is of interest.
In the Ta/SiC system, the C atoms move faster than Si outwards through the coated layer
and also react more readily with the deposited Ta. The total C content was higher than that
of Si in the reaction product when the temperature is at or above 650
o
C, indicating the
formation of C deficiency region in the near interface side of the SiC. It has been proposed
that the transition of Schottky to ohmic contacts during high temperature annealing is due
to the creation of sufficient C vacancies in the near interface region of the SiC (Han et al.,
2002; Nikitina et al., 2005). The C vacancies then act as donors to increase the net
concentration of electrons and thus change the electrical properties of the SiC in the near
surface region, resulting in the formation of ohmic contact. However, rectifying behaviour at
650C (Cao et al., 2007
b
) suggests that this mechanism is doubtful since plenty of C vacancies
have formed at this temperature. Furthermore, rather deep ionization energy level of 0.51
eV (Aboelfotoh & Doyle, 1999) makes the carbon vacancy mechanism questionable as well.
Instead of simple isolated C vacancies, more complicated defect configuration might be
responsible for the formation of ohmic contacts.
Properties and Applications of Silicon Carbide192
4. Conclusion remarks
In the Ni/SiC system, 1) The formation of textured Ni
2
Si via the reaction Ni + SiC = Ni
2
Si +
C consists of initial reaction-rate and subsequent diffusion controlled stages. The Ni
2
Si
islands are present for ultra thin initial Ni layer. The silicides formed at the interface depend
on the Ni layer thickness and substrate surface condition. 2) The C released owing to the
Ni
2
Si formation reaction forms a thin graphite layer on the top of the surface and also tends
to form clusters inside the reaction layer. The overall degree of graphitisation is higher at
higher temperatures. 3) For the annealed Ni/SiC samples, argon ion etching before Ni
deposition helps the formation of the multi-layer structure with less C agglomerated at the
surface due to the quicker formation of the silicide Ni
2
Si.
In Ta (or Ni/Ta)/SiC system, both silicides and carbides are formed after annealing. The
reaction zone consists of a layered structure. A carbon deficiency region is preferentially
produced in the near interface region of the underlying SiC. Amorphous Ni-Ta can be
formed in Ni/Ta/SiC by the solid-state interfacial reaction. The existence of Ni lowers the
formation temperature of carbide and silicide containing Ta, promoting the reaction
between Ta and SiC. Although the sample heated at 950
o
C showed the trend of phase
separation. Whether the top TaNiSi disappears or not and how the binary Ni or Ta
compounds evolve progressively upon further annealing in Ni/Ta/SiC is of further interest.
The carbon vacancy mechanism is likely to be questionable for the transition of Schottky to
ohmic contacts during high temperature annealing. However, the sufficient alteration of the
SiC subsurface with more complicated defect configuration by the reaction is important to
the formation of the ohmic contact. Detailed investigation related to this issue is interesting.
5. References
Abe, K.; Sumitomo, M.; Sumi, T.; Eryu, O. & Nakashima, K.(2002). Mater. Sci. Forum, 389-
393, 909-912.
Aboelfotoh, M. O. & Doyle, J. P. (1999). Phys. Rev., B59, 10823–10829.
Adachi, S. (2004): in: Handbook on Physical Properties of Semiconductors, vol. 1, 269, Norwell,
Kluwer Academic Publishers.
Backhaus-Ricoult, M. (1992). Acta Metal. Mater., 40, s95-103.
Berthod, P.; Aranda, L.; Vébert, C. & Michon, S. (2004). Computer Coupling of Phase Diagrams
and Thermochemistry, 28, 159-166.
Bhanumurthy, K. & Schmid-Fetzer, R. (2001). Composites, A32, 569-574.
Brewer, L. & Krikorian, O. (1956). J. Electrochem. Soc., 103, 38-51.
Bächli, A.; Nicolet, M A.; Baud, L.; Jaussaud, C.& Madar, R. (1998). Mater. Sci. Eng., B56, 11-
23.
Cao, Y.; Nyborg, L; Jelvestam, U. & Yi, D. (2005). Appl. Surf. Sci., 241, 392–402.
Cao, Y.; Nyborg, L.; Yi, D. & Jelvestam, U. (2006). Mater. Sci.& Techno., 22, 1227-1234.
Cao, Y.; Nyborg, L. (2006).
Surf. Interface Anal., 38, 748–751.
Cao, Y., Pérez-García, S.A. & Nyborg, L. (2007)
a
. Mater. Sci. Forum, 556-55, 713-716.
Cao, Y., Pérez-García, S.A. & Nyborg, L. (2007)
b
. Appl. Surf. Sci., 254, 139–142.
Cao, Y.; Nyborg. L. & Jelvestam U. (2009). Interface Anal., 41, 471–483.
Chen, J.S.; Kolawa, E.; Nicolet, M A. Ruiz, R.P.; Baud, L.; Jaussaud, C. & Madar, R. (1994). J.
Appl. Phys., 76, 2169-2175.
Chen, S.H.; Zheng, L.R.; Carter, C.B. & Mayer, J.W. (1985). J. Appl. Phys., 57, 258-263.
Chou, T.C.; Joshi, A. & Wadsworth, J. (1990). J. Vac. Sci. Technol, A9, 1525-1534.
Ciccariello, J.C.; Poize, S. & Gas, P. (1990). J. Appl. Phys., 67, 3315-3322.
Colgan, E.G.; Gambino, J.P.; Hong & Q.Z. (1996). Mater. Sci. Eng., R16, 43-96.
d’Heurle, C.L.F.M. & Zhang, S L (2007). Silicides, In: Handbook of Semiconductor
Manufacturing Technology, Doering, R; Nishi, Y (Ed.), p10-1 - 10-52, Taylor & Francis
Group, LLC, ISBN 978-1-5744-4675-3, Boca Raton.
Fedorov, V.V.; Yedneral, A.F., Kachalov, V.M. & Borisov, V.T. (1986). Phys. Met. Metall., 62, 96-99.
Feng, J.C.; Naka, M. & Schuster, J.C. (1997). J. Mater. Sci. Lett., 16, 1116-1117.
Gambino, J.P. & Colgan, E.G. (1998). Silicides and ohmic contacts. In Material Chemistry and
Physics, 52, 99-146.
Gasser, S.M.; Bächli, A.; Garland, C.M.; Kolawa, E. & Nicolet, M A.( 1997). Microelectronic
Engineering, 37/38, 529-534.
Geib, K.M.; Wilson, C.; Long, R.G. & Wilmsen, C.W. (1990). J. Appl. Phys., 68, 2796-2800.
Guziewicz, M.; Piotroowska, A. Kaminska, Grasza, E. K.; Diduszko, R. Stonert, A. Turos, A.;
Sochacki, M. & Szmidt, J. (2006). Mater. Sci. Eng., B135, 289-293.
Han, S.Y. & Lee, J L. (2002). J. Electrochem. Soc., 149, G189-193.
Han, S.Y.; Kim, N K.; Kim, E D. & Lee, J L. (2002). Mater. Sci. Forum, 389-393, 897-900.
Han, S.Y.; Shin, J Y.; Lee, B T. & Lee. J L. (2002). J. Vac. Sci. Technol., B20, 1496-1500.
Hollanders, M.A.; Duterloo, C.G.; Thijsse, B.J. & Mittemeijer, E.J. (1991). J. Mater. Res., 6,
1862-1873.
Hsu, J.Y. & Liang, J.H. (2005). Nucl. Instrum. Methods Phys. Res.,
B 241, 543–547.
Hung, L. S.; Saris, F. W.; Wang, S. Q. & Mayer, J. W. (1986). J. Appl. Phys., 59, 2416.
Hähnel, A. & Woltersdorf, J. (2004). Mater. Chem. Phys., 83, 380-388.
Kestle, A.; Wilks, S.P.; Dunstan, P.R.; Pritchard, M.; Pope, G.; Koh, A. & Mawby, P.A. (2000).
Mater. Sci. Forum, 338-342, 1025-1028.
Kurimoto, E. & Harima, H. (2002). J. Appl. Phys., 91, 10215-10217.
Iwaya, M.; Kasugai, H.; Kawashima, T.; Iida, K.; Honshio, A.; Miyake, Y.; Kamiyama, S.;
Amano, H. & Akasaki, I. (2006). Thin Solid Films, 515, 768-770.
Jang, T.; Porter, L.M.; Rutsch, G.W.M. & Odekirk, B. (1999). Appl. Phys. Lett., 75, 3956-3958.
Lahav, A.; Eizenberg, M. & Komen, Y. (1987). J. Appl. Phys., 62, 1768.
Laurila, T.; Zeng, K. & Kivilahti, J.K. (2002). J. Appl. Phys., 91, 5391-5399.
La Via, F.; Roccaforte, F.; Makhtari, A.; Raineri, V.; Musumeci, P. & Calcagno, L. (2002).
Microelectron. Eng., 60, 269-282.
La Via, F.; Roccaforte, F.; Raineri, V.; Mauceri, M.; Ruggiero, A.; Musumeci, P.; Calcagno, L;
Castaldini, A. & Cavallini, A. (2003). Microelectron. Eng., 2003, 70, 519-523.
Lavoie, C; Detavernier, C. & Besser, P. (2004). Nickel silicide Technology, In Silicide
Technology for Integrated Circuits, Chen, Lih J. (Ed.), IEEE, London.
Le Claire, A.D. (1999). Diffusion in solid metals and Alloys, in Numerical Data and Functional
Relationships in Science and Technology, Mehrer, H. (Ed.), III/26, Springer, 478.
Lee, P.S.; Mangelinck, D.; Pey, K.L.; Ding, J.; Dai, J.Y.; Ho, C.S. & See, A. (2000). Microelectr.
Eng., 51-52, 583-594.
Lee, P Y.; Yang, J L.; Lin, C K.& Lin, H M. (1997). Metall. Mater. Trans., 28A, 1429-1435.
Lee, W.; Lee, J.; Bae, J.D.; Byun, C.S. & Kim, D.K. (2001). Scripta Mater., 44, 97-103.
Contact Formation on Silicon Carbide by Use
of Nickel and Tantalum from a Materials Science Point of View 193
4. Conclusion remarks
In the Ni/SiC system, 1) The formation of textured Ni
2
Si via the reaction Ni + SiC = Ni
2
Si +
C consists of initial reaction-rate and subsequent diffusion controlled stages. The Ni
2
Si
islands are present for ultra thin initial Ni layer. The silicides formed at the interface depend
on the Ni layer thickness and substrate surface condition. 2) The C released owing to the
Ni
2
Si formation reaction forms a thin graphite layer on the top of the surface and also tends
to form clusters inside the reaction layer. The overall degree of graphitisation is higher at
higher temperatures. 3) For the annealed Ni/SiC samples, argon ion etching before Ni
deposition helps the formation of the multi-layer structure with less C agglomerated at the
surface due to the quicker formation of the silicide Ni
2
Si.
In Ta (or Ni/Ta)/SiC system, both silicides and carbides are formed after annealing. The
reaction zone consists of a layered structure. A carbon deficiency region is preferentially
produced in the near interface region of the underlying SiC. Amorphous Ni-Ta can be
formed in Ni/Ta/SiC by the solid-state interfacial reaction. The existence of Ni lowers the
formation temperature of carbide and silicide containing Ta, promoting the reaction
between Ta and SiC. Although the sample heated at 950
o
C showed the trend of phase
separation. Whether the top TaNiSi disappears or not and how the binary Ni or Ta
compounds evolve progressively upon further annealing in Ni/Ta/SiC is of further interest.
The carbon vacancy mechanism is likely to be questionable for the transition of Schottky to
ohmic contacts during high temperature annealing. However, the sufficient alteration of the
SiC subsurface with more complicated defect configuration by the reaction is important to
the formation of the ohmic contact. Detailed investigation related to this issue is interesting.
5. References
Abe, K.; Sumitomo, M.; Sumi, T.; Eryu, O. & Nakashima, K.(2002). Mater. Sci. Forum, 389-
393, 909-912.
Aboelfotoh, M. O. & Doyle, J. P. (1999). Phys. Rev., B59, 10823–10829.
Adachi, S. (2004): in: Handbook on Physical Properties of Semiconductors, vol. 1, 269, Norwell,
Kluwer Academic Publishers.
Backhaus-Ricoult, M. (1992). Acta Metal. Mater., 40, s95-103.
Berthod, P.; Aranda, L.; Vébert, C. & Michon, S. (2004). Computer Coupling of Phase Diagrams
and Thermochemistry, 28, 159-166.
Bhanumurthy, K. & Schmid-Fetzer, R. (2001). Composites, A32, 569-574.
Brewer, L. & Krikorian, O. (1956). J. Electrochem. Soc., 103, 38-51.
Bächli, A.; Nicolet, M A.; Baud, L.; Jaussaud, C.& Madar, R. (1998). Mater. Sci. Eng., B56, 11-
23.
Cao, Y.; Nyborg, L; Jelvestam, U. & Yi, D. (2005). Appl. Surf. Sci., 241, 392–402.
Cao, Y.; Nyborg, L.; Yi, D. & Jelvestam, U. (2006). Mater. Sci.& Techno., 22, 1227-1234.
Cao, Y.; Nyborg, L. (2006).
Surf. Interface Anal., 38, 748–751.
Cao, Y., Pérez-García, S.A. & Nyborg, L. (2007)
a
. Mater. Sci. Forum, 556-55, 713-716.
Cao, Y., Pérez-García, S.A. & Nyborg, L. (2007)
b
. Appl. Surf. Sci., 254, 139–142.
Cao, Y.; Nyborg. L. & Jelvestam U. (2009). Interface Anal., 41, 471–483.
Chen, J.S.; Kolawa, E.; Nicolet, M A. Ruiz, R.P.; Baud, L.; Jaussaud, C. & Madar, R. (1994). J.
Appl. Phys., 76, 2169-2175.
Chen, S.H.; Zheng, L.R.; Carter, C.B. & Mayer, J.W. (1985). J. Appl. Phys., 57, 258-263.
Chou, T.C.; Joshi, A. & Wadsworth, J. (1990). J. Vac. Sci. Technol, A9, 1525-1534.
Ciccariello, J.C.; Poize, S. & Gas, P. (1990). J. Appl. Phys., 67, 3315-3322.
Colgan, E.G.; Gambino, J.P.; Hong & Q.Z. (1996). Mater. Sci. Eng., R16, 43-96.
d’Heurle, C.L.F.M. & Zhang, S L (2007). Silicides, In: Handbook of Semiconductor
Manufacturing Technology, Doering, R; Nishi, Y (Ed.), p10-1 - 10-52, Taylor & Francis
Group, LLC, ISBN 978-1-5744-4675-3, Boca Raton.
Fedorov, V.V.; Yedneral, A.F., Kachalov, V.M. & Borisov, V.T. (1986). Phys. Met. Metall., 62, 96-99.
Feng, J.C.; Naka, M. & Schuster, J.C. (1997). J. Mater. Sci. Lett., 16, 1116-1117.
Gambino, J.P. & Colgan, E.G. (1998). Silicides and ohmic contacts. In Material Chemistry and
Physics, 52, 99-146.
Gasser, S.M.; Bächli, A.; Garland, C.M.; Kolawa, E. & Nicolet, M A.( 1997). Microelectronic
Engineering, 37/38, 529-534.
Geib, K.M.; Wilson, C.; Long, R.G. & Wilmsen, C.W. (1990). J. Appl. Phys., 68, 2796-2800.
Guziewicz, M.; Piotroowska, A. Kaminska, Grasza, E. K.; Diduszko, R. Stonert, A. Turos, A.;
Sochacki, M. & Szmidt, J. (2006). Mater. Sci. Eng., B135, 289-293.
Han, S.Y. & Lee, J L. (2002). J. Electrochem. Soc., 149, G189-193.
Han, S.Y.; Kim, N K.; Kim, E D. & Lee, J L. (2002). Mater. Sci. Forum, 389-393, 897-900.
Han, S.Y.; Shin, J Y.; Lee, B T. & Lee. J L. (2002). J. Vac. Sci. Technol., B20, 1496-1500.
Hollanders, M.A.; Duterloo, C.G.; Thijsse, B.J. & Mittemeijer, E.J. (1991). J. Mater. Res., 6,
1862-1873.
Hsu, J.Y. & Liang, J.H. (2005). Nucl. Instrum. Methods Phys. Res.,
B 241, 543–547.
Hung, L. S.; Saris, F. W.; Wang, S. Q. & Mayer, J. W. (1986). J. Appl. Phys., 59, 2416.
Hähnel, A. & Woltersdorf, J. (2004). Mater. Chem. Phys., 83, 380-388.
Kestle, A.; Wilks, S.P.; Dunstan, P.R.; Pritchard, M.; Pope, G.; Koh, A. & Mawby, P.A. (2000).
Mater. Sci. Forum, 338-342, 1025-1028.
Kurimoto, E. & Harima, H. (2002). J. Appl. Phys., 91, 10215-10217.
Iwaya, M.; Kasugai, H.; Kawashima, T.; Iida, K.; Honshio, A.; Miyake, Y.; Kamiyama, S.;
Amano, H. & Akasaki, I. (2006). Thin Solid Films, 515, 768-770.
Jang, T.; Porter, L.M.; Rutsch, G.W.M. & Odekirk, B. (1999). Appl. Phys. Lett., 75, 3956-3958.
Lahav, A.; Eizenberg, M. & Komen, Y. (1987). J. Appl. Phys., 62, 1768.
Laurila, T.; Zeng, K. & Kivilahti, J.K. (2002). J. Appl. Phys., 91, 5391-5399.
La Via, F.; Roccaforte, F.; Makhtari, A.; Raineri, V.; Musumeci, P. & Calcagno, L. (2002).
Microelectron. Eng., 60, 269-282.
La Via, F.; Roccaforte, F.; Raineri, V.; Mauceri, M.; Ruggiero, A.; Musumeci, P.; Calcagno, L;
Castaldini, A. & Cavallini, A. (2003). Microelectron. Eng., 2003, 70, 519-523.
Lavoie, C; Detavernier, C. & Besser, P. (2004). Nickel silicide Technology, In Silicide
Technology for Integrated Circuits, Chen, Lih J. (Ed.), IEEE, London.
Le Claire, A.D. (1999). Diffusion in solid metals and Alloys, in Numerical Data and Functional
Relationships in Science and Technology, Mehrer, H. (Ed.), III/26, Springer, 478.
Lee, P.S.; Mangelinck, D.; Pey, K.L.; Ding, J.; Dai, J.Y.; Ho, C.S. & See, A. (2000). Microelectr.
Eng., 51-52, 583-594.
Lee, P Y.; Yang, J L.; Lin, C K.& Lin, H M. (1997). Metall. Mater. Trans., 28A, 1429-1435.
Lee, W.; Lee, J.; Bae, J.D.; Byun, C.S. & Kim, D.K. (2001). Scripta Mater., 44, 97-103.
Properties and Applications of Silicon Carbide194
Lim, C.S.; Nickel, H; Naoumidis, A. & Gyarmati, E. (1997). J. Mater.Sci., 32, 6567-6572.
Litvinov, V.L.; Demakov, K.D.; Agueev, O.A.; Svetlichnyi, A.M.; Konakova, R.V.; Lytvyn,
P.M. & Milenin, V.V.(2002). Mater. Sci. Forum, 389-393, 905-908.
Liu, B.X. & Zhang, Z.J. (1994). Phys. Rev. B, 49, 12519-12527.
Lou, D.C., Akselsen, O.M., Solberg, J.K., Onsoien, M.I.; Berget, J. & Dahl, N. (2006). Surf.
Coatings Technol., 200, 3582-3589.
Lu, W.; Mitchel, W.C.; Landis, G.R.; Crenshaw, T.R. & Eugene Collins, W. (2003). Solid-State
Electron., 47, 2001-2010.
Lu, X.D. & Wang, H.M. (2004). Acta Mater., 52, 5419-5426.
Madsen, L.D.; Svedberg,E.B.; Radamson, H.H.; Hallin, C.; Hjörvarsson, B.; Cabral, Jr., C.;
Jordan-Sweet, J.L. & Lavoie, C.(1998). Mater. Sci. Forum, 264-268, 799-804.
Marinova, Ts.; Krastev, V.; Hallin, C.; Yakimova, R. & Janzén, E.(1996). Appl. Surf. Sci., 99,
119-125.
Marinova, Ts.; Kakanakova-Georgieva, A.; Krastev, V.; Kakanakov, R.; Neshev, M.;
Kassamakova, L.; Noblanc, O.; Arnodo, C.; Cassette, S.; Brylinski, C.; Pecz, B.;
Radnoczi, G. & Vincze, Gy. (1997). Mater. Sci. Eng., B46, 223-226.
Matzke, Hj. & Rondinella. V.V.(1999). in Landolt Börnnstein. Added t.p.:Numerical Data and
Functional Relationships in Science and Technology, Beke, D.L. (Ed.), vol. III/33B1, 5-5,
6, Berlin, Springer.
Nash, P. & Nash, A. (1992). Alloy Phase Diagrams, In ASM Handbooks, Baker, H. (Ed.), Vol.
3, p2859-2860, ASM International, Materials Park, Ohio.
Nikitina, I.P.; Vassilevski, K.V.; Wright, N.G.; Horsfall, A.B. & O’Neill, A.G. (2005). J. Appl.
Phys., 97, 083709.
Ohi,A; Labis, J.; Morikawa, Y.; Fujiki, T.; Hirai, M.; Kusaka, M.& Iwami M.(2002). Appl. Surf.
Sci., 190, 366-370.
Olowolafe, J.O.; Solomon, J.S.; Mitchel, W. & Lampert, W.V. (2005). Thin Solid Films, 479, 59-63.
Ottaviani, G. (1979). J. Vac. Sci. Technol. 16, 1112-1119.
Park, J.S.; Landry, K. & Perepezko, J.H. (1999). Mater. Sci. Eng., A259, 279-286.
Roccaforte, F.; La Via, F.; Raineri, V.; Calcagno, L. & Musumeci. P. Appl. Surf. Sci., 2001, 184,
295-298.
Rodriguez, N.M.; Anderson, P.E.; Wootsch, A.; Wild, U.; Schlögl, R. & Paál, Z. (2001). Journal
of Catalysis, 197, 365-377.
Sarkar, D.K.; Falke, M.; Giesler, H.; Teichert, S.; Beddies G. & Hinneberg, H.–J. (2000). Appl.
Phys., A70, 681-684.
Schuster, Julius C. (1993-1994). Int. J. of Refractory Metals & Hard Materials, 173-177.
Shifler, D.A. High-Temperature Gaseous Corrosion Testing, in Corrosion: Fundamentals,
Testing, and Protection, ASM Handbook, Vol 13A, ASM International, 2003, p 650–681.
Smithells, C.J. (1967). Metals Reference book, vol. 2, 664, London, Butterworth & Co. Ltd.
Su, Y-K.; Chiou, Y-Z.; Chang, C-S.; Chang, S-J.; Lin, Y-C. & Chen, J. F. (2002). Solid-State
Electron., 46, 2237-2240.
Yoon, J-K; Byun, J-Y; Kim, G-H; Lee, J-K; Yoon, H-S & Hong, K-T. (2003). Surf. Coating
Technol., 168, 241-248.
Yuryeva, E.I. & Ivanovskii, A.L. (2002). Russ. J. Coord. Chem., 28, 881-888.
Zhang, Q.; Lai,W. S. & Liu, B. X. (2000). Phys. Rev., B 61, 9345–9355.
Zheng, L.R.; Hung, L.S. & Mayer, J.W. (1983). J. Vac. Sci. Technol., A1, 758-761.
Other applications: Electrical, Structural and Biomedical
Part 2
Other applications: Electrical,
Structural and Biomedical