REPORT NO. 2011-086 FEBRUARY 2011 FLORIDA STATE UNIVERSITY Financial Audit For the Fiscal Year Ended June 30, 2010_part1 potx
Bạn đang xem bản rút gọn của tài liệu. Xem và tải ngay bản đầy đủ của tài liệu tại đây (290.67 KB, 7 trang )
REPORT NO. 2011-086
F
EBRUARY 2011
FLORIDA STATE UNIVERSITY
Financial Audit
For the Fiscal Year Ended
June 30, 2010
This is trial version
www.adultpdf.com
BOARD OF TRUSTEES AND PRESIDENT
Members of the Board of Trustees and President who served during the 2009-10 fiscal year are listed below:
William A. Haggard, Vice Chair from 2-19-10
to 3-18-10, Chair from 3-19-10 (1)
Susie Busch-Transou, Vice Chair from 6-10-10
J
im Smith, Chair to 3-18-10
Harold Knowles, Vice Chair to 1-06-10 (2)
Derrick Brooks
Dustin R. Daniels from 3-22-10 (3)
Emily Fleming Duda
David B. Ford
Manuel Garcia, III
Mark Hillis from 1-07-10
Robert J. Jakubik to 3-21-10 (3)
J
ames E. Kinsey, Jr.
Richard McFarlain to 1-06-10
Leslie Pantin, Jr.
Margaret A. Rolando from 1-07-10
Brent W. Sembler from 3-19-10
Dr. Eric C. Walker (4)
Notes: (1) Vice Chair position vacant from
March 19, 2010, to June 9, 2010.
(2) Vice Chair position vacant from
J
anuary 7, 2010, to February 18, 2010.
(3) Student body president.
(4) Faculty Senate chair.
Dr. Eric J. Barron, President
Dr. T. K. Wetherell, President
from February 1, 2010
to January 31, 2010
T
he Auditor General conducts audits of governmental entities to provide the Legislature, Florida’s citizens, public entity
management, and other stakeholders unbiased, timely, and relevant information for use in promoting government
accountability and stewardship and improving government operations.
The audit team leader was Kathy Stich, CPA, and the audit was supervised by Cheryl B. Pueschel, CPA. Please address
inquiries regarding this report to James R. Stultz, CPA, Audit Manager, by e-mail at
or by telephone
at (850) 922-2263.
This report and other reports prepared by the Auditor General can be obtained on our Web site at
www.myflorida.com/audgen
; by telephone at (850) 487-9175; or by mail at G74 Claude Pepper Building, 111 West Madison
Street, Tallahassee, Florida 32399-1450.
This is trial version
www.adultpdf.com
FEBRUARY 2011 REPORT NO. 2011-086
FLORIDA STATE UNIVERSITY
TABLE OF CONTENTS
PAGE
NO.
EXECUTIVE SUMMARY i
INDEPENDENT AUDITOR’S REPORT ON FINANCIAL STATEMENTS 1
MANAGEMENT’S DISCUSSION AND ANALYSIS 3
BASIC FINANCIAL STATEMENTS
Statement of Net Assets 12
Statement of Revenues, Expenses, and Changes in Net Assets 14
Statement of Cash Flows 15
Notes to Financial Statements 17
OTHER REQUIRED SUPPLEMENTARY INFORMATION
Schedule of Funding Progress – Other Postemployment Benefits Plan 43
Notes to Required Supplementary Information 44
INDEPENDENT AUDITOR’S REPORT ON INTERNAL CONTROL OVER
FINANCIAL REPORTING AND ON COMPLIANCE AND OTHER MATTERS
BASED ON AN AUDIT OF THE FINANCIAL STATEMENTS PERFORMED
IN ACCORDANCE WITH GOVERNMENT AUDITING STANDARDS 45
Internal Control Over Financial Reporting 45
Compliance and Other Matters 46
This is trial version
www.adultpdf.com
FEBRUARY 2011 REPORT NO. 2011-086
2
As discussed in note 1 to the financial statements, the Florida Medical Practice Plan, Inc. reported financial activities
for an 18-month period ended June 30, 2010. This affects the comparability of amounts reported for the 2009-10
fiscal year with amounts reported for the 2008-09 fiscal year.
As discussed in note 2 to the financial statements, the University changed its reporting of the liability for Capital
Improvement (Housing, Parking, and Dining) Revenue Bonds and the 2001 Research Foundation Revenue Bonds
from bonds payable to capital improvement debt payable during the 2009-10 fiscal year. This change affects the
comparability of amounts reported for the 2009-10 fiscal year with amounts reported for the 2008-09 fiscal year.
As discussed in note 3 to the financial statements, the University discontinued reporting bonds payable for State
University System Capital Improvement Trust Fund Revenue Bonds on the University’s statement of net assets
during the 2009-10 fiscal year. This change affects the comparability of amounts reported for the 2009-10 fiscal year
with amounts reported for the 2008-09 fiscal year.
In accordance with Government Auditing Standards, we have also issued a report on our consideration of the Florida
State University’s internal control over financial reporting and on our tests of its compliance with certain provisions of
laws, rules, regulations, contracts, and grant agreements and other matters included under the heading
INDEPENDENT AUDITOR’S REPORT ON INTERNAL CONTROL OVER FINANCIAL
REPORTING AND ON COMPLIANCE AND OTHER MATTERS BASED ON AN AUDIT OF THE
FINANCIAL STATEMENTS PERFORMED IN ACCORDANCE WITH
GOVERNMENT AUDITING
STANDARDS
. The purpose of that report is to describe the scope of our testing of internal control over financial
reporting and compliance and results of that testing, and not to provide an opinion on the internal control over
financial reporting or on compliance. That report is an integral part of an audit performed in accordance with
Government Auditing Standards and should be considered in assessing the results of our audit.
Accounting principles generally accepted in the United States of America require that MANAGEMENT’S
DISCUSSION AND ANALYSIS on pages 3 through 11 and OTHER REQUIRED SUPPLEMENTARY
INFORMATION on pages 43 and 44 be presented to supplement the basic financial statements. Such information,
although not a required part of the basic financial statements, is required by the Governmental Accounting Standards
Board who considers it to be an essential part of financial reporting for placing the basic financial statements in an
appropriate operational, economic, or historical context. We have applied certain limited procedures to the required
supplementary information in accordance with auditing standards generally accepted in the United States of America,
which consisted principally of inquiries of management regarding the methods of measurement and comparing the
information for consistency with management’s responses to our inquiries, the basic financial statements, and other
knowledge we obtained during our audit of the basic financial statements. We do not express an opinion or provide
any assurance on the information because the limited procedures do not provide us with sufficient evidence to
express an opinion or provide any assurance.
Respectfully submitted,
David W. Martin, CPA
January 20, 2011
This is trial version
www.adultpdf.com
FEBRUARY 2011 REPORT NO. 2011-086
4
T
HE STATEMENT OF NET ASSETS
The statement of net assets presents the financial position of the University at fiscal year end. This statement
provides a picture of assets minus liabilities and their availability for expenses by the University. The change in net
assets is one indicator of whether the overall financial condition of the University has improved or worsened during
the year.
The following table shows a condensed statement of net assets at June 30:
Condensed Statement of Net Assets at June 30
(In Thousands)
2010 2009
Assets
Current Assets 677,815$ 662,422$
Capital Assets, Net 1,574,125 1,520,147
Other Noncurrent Assets 53,724 57,041
Total Assets
2,305,664 2,239,610
Liabilities
Current Liabilities 119,505 138,857
Noncurrent Liabilities 254,986 304,874
Total Liabilities
374,491 443,731
Net Assets
Invested in Capital Assets,
Net of Related Debt 1,384,027 1,284,138
Restricted 166,715 169,063
Unrestricted 380,431 342,678
Total Net Assets
1,931,173$ 1,795,879$
Assets are what the University owns and are measured in current value, except for property and equipment, which are
recorded at historical costs less accumulated depreciation. Assets are categorized as either current or noncurrent.
Current assets are generally considered to be convertible to cash within one year. The following chart presents assets
by percent:
This is trial version
www.adultpdf.com
FEBRUARY 2011 REPORT NO. 2011-086
5
Total Assets
Liabilities are what the University owes to others or what it has collected from others before it has provided the
related services. Liabilities are also categorized as either current or noncurrent. Current liabilities are amounts
becoming due and payable within the next year. The following chart presents liabilities by percent:
Total Liabilities
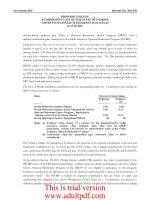
Net assets are divided into three categories. Invested in capital assets, net of related debt represents the historical cost
of capital assets reduced by the balance of related outstanding debt and accumulated depreciation. Restricted net
assets include amounts that have been restricted for use by an external party and are further broken down into
nonexpendable and expendable. Restricted expendable net assets include amounts restricted by external parties for
such things as debt service, student loans, and capital projects. Finally, unrestricted net assets include amounts
institutionally designated or committed to support specific academic and research programs, and for working capital
requirements. The following chart presents net asset categories by percent:
Cash and
Investments
25.4%
Receivables
6.0%
Capital
Assets, Net
of
Accumulated
Depreciation
68.3%
Other Assets
0.3%
Long-Term
Obligations
71.2%
Deferred
Revenue
16.1%
Payables and
Accrued
Liabilities
12.4%
Other
Liabilities
0.3%
This is trial version
www.adultpdf.com
FEBRUARY 2011 REPORT NO. 2011-086
6
Total Net Assets
T
HE STATEMENT OF REVENUES, EXPENSES, AND CHANGES IN NET ASSETS
The statement of revenues, expenses, and changes in net assets presents the University’s revenue and expense activity,
categorized as operating and nonoperating. Revenues and expenses are recognized when earned or incurred,
regardless of when cash is received or paid.
The following summarizes the University’s activity for the 2009-10 and 2008-09 fiscal years:
Condensed Statement of Revenues, Expenses,
and Changes in Net Assets
(In Thousands)
2009-10 2008-09
Operating Revenues 463,406$ 432,863$
Operating Expenses (894,644) (870,250)
Operating Loss
(431,238) (437,387)
Net Nonoperating Revenues 462,467 436,386
Income (Loss) Before Other Revenues,
Expenses, Gains, or Losses
31,229 (1,001)
Net Other Revenues 54,030 66,754
Net Increase In Net Assets
85,259 65,753
Net Assets, Beginning of Year 1,795,879 1,730,126
Adjustments to Beginning Net Assets (1) 50,035
Net Assets, Beginning of Year, as Restated
1,845,914 1,730,126
Net Assets, End of Year
1,931,173$ 1,795,879$
Note: (1)
Trust Fund Revenue Bonds. See note 3 to the financial statements.
Due to a change in reporting State University System Capital Improvement
Invested in
Capital Assets,
Net of Related
Debt
71.7%
Unrestricted
19.7%
Restricted
8.6%
This is trial version
www.adultpdf.com