Handbook of plant based biofuels - Chapter 5 potx
Bạn đang xem bản rút gọn của tài liệu. Xem và tải ngay bản đầy đủ của tài liệu tại đây (412.39 KB, 16 trang )
Section II
Production of Bioethanol
© 2009 by Taylor & Francis Group, LLC
57
5
Fuel Ethanol
Current Status and Outlook
Edgard Gnansounou
ABSTRACT
An analysis of the current situation and perspective on biomass-to-ethanol is pro-
vided in this chapter. Various conversion pathways are compared from technical,
economic, and environmental points of view. It is found that, due to a learning curve
and other economic reasons, the United States and Brazil will maintain their com-
parative advantage in the next decades. However, the fast growth of the world fuel
ethanol demand, as well as the perspectives of the oil market, may notably inuence
the international market price of ethanol and open opportunities for wide-scale pro-
duction in other regions such as Europe and Asia. In the long term, lignocellulose-
to-ethanol is the most viable pathway from a sustainability point of view. However,
its production cost must be reduced signicantly for this process to have a chance to
drive forward the strategy of biomass-to-ethanol worldwide.
CONTENTS
Abstract 57
5.1 Introduction 58
5.2 Current Status 59
5.2.1 Generic Conversion Scheme 59
5.2.2 Sucrose-to-Ethanol 60
5.2.3 Starch-to-Ethanol 61
5.2.4 Lignocellulosics-to-Ethanol 62
5.3 Outlook for Bioethanol Development 65
5.3.1 Drivers for Fuel Ethanol Development 65
5.3.1.1 Security of the Energy Supply 65
5.3.1.2
Economic Drivers 66
5.3.1.3 Environmental Drivers 67
5.3.1.4 Greenhouse Gas Balance 67
5.3.1.5
Other Environmental Effects 68
5.3.1.6 Technological Development 68
5.3.2 Future Demand and the Production of Bioethanol 68
5.4 Conclusions 69
References 70
© 2009 by Taylor & Francis Group, LLC
58 Handbook of Plant-Based Biofuels
5.1 INTRODUCTION
Liquid biofuels are receiving increasing attention worldwide as a result of the grow-
ing concerns about oil security of supply and global climate change. In most devel-
oping countries, the emerging biofuels industry is perceived as an opportunity to
enhance economic growth and create or maintain jobs, particularly in rural areas.
The liquid biofuels market is shared mainly between bioethanol and biodiesel, with
more than 85% market share for the former in 2005. The main advantage of bioetha-
nol is the possibility to blend it in low proportions with gasoline (5 to 25% bioethanol
by volume) for use, without any signicant change, in internal combustion engines.
That technology constitutes the highest proportion of the world’s light duty vehicles
eet. Flexible fuelled vehicles (FFVs) are presently booming as well, particularly in
Brazil and Sweden, creating a new opportunity for bioethanol to compete directly
with gasoline.
The use of ethanol as a fuel has a long history, starting in 1826 when Samuel
Morey used it with the rst American prototype of the internal combustion engine.
The renewal of interest in fuel ethanol started, however, from the 1973–74 world oil
crisis when the Brazilian government launched its pro-alcohol strategic program to
substitute a large share of imported oil. In the United States, the Energy Tax Act of
1978 exempted from excise tax the gasohol (10% of bioethanol blends with gasoline
v/v). Later on, another U.S. federal program guaranteed loans for investment in etha-
nol plant construction. Brazil and the United States are still the two main producers
and users of fuel ethanol worldwide.
Ethanol has good properties for internal combustion engines. Its average octane
number of 99 is high compared to 88 for regular gasoline. However, the lower heat-
ing value (LHV) of ethanol (21 MJ/l) is 70% that of gasoline (about 30 MJ/l). Fuel
ethanol is used in several manners in internal combustion engines: as 5% to 25%
anhydrous ethanol blends with gasoline (5% maximum in Europe and India, 10%
in the United States and China, 20 to 25% mandatory blends in Brazil), as pure
fuel (100% of hydrated ethanol) in dedicated vehicles, or up to 85% in FFVs. When
anhydrous bioethanol is blended with gasoline in small proportion (up to 15%), the
inuence of the lower heating value has no signicant effect. For higher blend levels,
the fuel economy is reduced compared to that with conventional gasoline.
Ethanol dedicated vehicles are optimized so that the engine efciency is improved
by running at higher compression ratios to take advantage of the better octane num-
ber of ethanol compared to gasoline. Therefore, for pure hydrated ethanol used in
optimized vehicles, the ethanol can achieve about 75% or more of the range of gaso-
line on a volume basis. FFVs are equipped with line sensors that measure ethanol
levels and adapt the air-fuel ratio to maintain good combustion conditions.
The use of bioethanol in internal combustion engines exhibits a few disadvan-
tages: low levels of ethanol blended with gasoline increase vapor pressure and favor
evaporative emissions that contribute to smog formation. For higher ethanol blend
levels, the vapor pressure drops signicantly, leading to more difculty in cold
weather conditions.
Due to its low cetane number, ethanol does not burn efciently by compression
ignition. Moreover, ethanol is not easily miscible with diesel fuel. Three methods are
© 2009 by Taylor & Francis Group, LLC
Fuel Ethanol 59
used to improve the use of ethanol in compression ignition vehicles. The rst, used
in direct blends of ethanol with diesel, involves addition of an emulsier in order to
improve ethanol-diesel miscibility. Other additives are used, such as ethylhexylni-
trate or diterbutyl peroxide, to enhance the cetane number. Most blends of ethanol to
diesel (E-diesel) have a limit of up to 15% ethanol and up to 5% emulsiers (MBEP
2002). The second method is a dual fuel operation in which ethanol and diesel are
introduced separately into the cylinder (SAE 2001). Finally, modication of diesel
engines has been done to adapt their characteristics of auto-ignition and make them
capable of using high blends such as 95% ethanol.
Even if bioethanol has a bright future, its environmental and economic per-
formances vary signicantly from one production pathway to the other. Its future
development will depend mostly on the possibility to develop sustainable feedstocks,
efcient technologies and to prevent potential risks such as local environmental
hurdles and competition with food. In Section 5.2, the current status is analysed,
including conversion chains and the situation in main producer countries. Section 5.3
presents the outlook to 2015. Finally, in Section 5.4, a few considerations are given
on the necessity to dene sustainability standards for biofuels in a neutral framework
in order to promote best practices and sustainable pathways of bioethanol.
5.2 CURRENT STATUS
5.2.1 G
e n e r i c co n v e r S i o n Sc H e m e
Bioethanol can be produced from a large variety of carbohydrates: monosaccharides,
disaccharides, and polysaccharides. The large-scale biomass-to-ethanol industry
mostly uses the following feedstocks: sweet juice (e.g., sugarcane, sugar beet juice,
or molasses) and starch (e.g., corn, wheat, barley, cassava). Ethanol is also com-
mercially produced in the pulp and paper industry as a by-product of an acid-based
conversion process. Modern lignocellulosic biomass-to-ethanol processes are envis-
aged to provide a signicant percentage of bioethanol in the long term due to the
expected low cost of the feedstock (agricultural and forestry residues) and to their
high availability. The feedstock for bioethanol production is currently based mostly
on agricultural crops, which can be devoted to both food and ethanol markets or
dedicated solely to ethanol, that is, crops cultivated on fallow or undeveloped lands.
In case of a high world production of bioethanol, the correlation between food and
ethanol markets may generate a high volatility of agricultural crops with regard to
uctuations in energy prices.
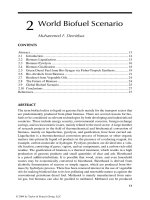
Figure 5.1 outlines a generic biomass-to-ethanol process. One or more steps may
be omitted and several may be combined, depending on the feedstock and the con-
version technology. Once the biomass is delivered to the ethanol plant, it is stored in
a warehouse and conditioned to prevent early fermentation and bacterial contamina-
tion. Through pretreatment, carbohydrates are extracted or made more accessible for
further extraction. During this step, simple sugars may be made available in propor-
tions depending on the biomass and the pretreatment process.
A large portion of bers may remain for conversion to simple sugars through
hydrolysis reactions or other techniques. In the fermentation step, batch operations
© 2009 by Taylor & Francis Group, LLC
60 Handbook of Plant-Based Biofuels
may be used in which the hydrolysate, the yeasts, nutriments, and other ingredients
are added from the beginning of the step. In a fed batch process, one or more inputs
are added as fermentation progresses. Continuous processes in which ingredients
are constantly input and products removed from the fermentation vessels are also
used (Wyman 2004). In efcient processes, the cell densities may be made high by
recycling or immobilizing the yeasts in order to improve their activity and increase
the fermentation productivity. The fermentation reactions occur at temperatures
between 25 and 30°C and last between 6 and 72 h depending on the composition of
the hydrolysate, and the type, density, and activity of the yeasts. The broth typically
contains 8 to 14% of ethanol on a volume basis. Above this latter concentration,
inhibition of yeasts may occur that reduces their activity. The distillation step yields
an azeotropic mixture of 95.5% alcohol and 4.5% water that is the “hydrous” or
“hydrated” ethanol which is then dehydrated to obtain an “anhydrous” ethanol with
99.6% alcohol and 0.4% water.
The remaining ow from the distillation column, known as vinasse, or still-
age, can be valorized to produce co-products, which may include process steam and
electricity, products for feeding animals, more or less concentrated stillage used as
fertilizer, and other valuable by-products.
In 2005, around 36 billion liters of fuel bioethanol were produced in the world;
Brazil and the United States provided 86% of the production.
5.2.2 Su c r o S e -t o -et H a n o l
The most common disaccharide used for bioethanol production is sucrose, which
is composed of glucose and fructose. Sucrose represented 48% of the world’s fuel
ethanol production in 2006 (F. O. Licht 2006). Fermentation of sucrose is performed
using commercial yeast such as Saccharomyces cerevisiae. The chemical reaction is
composed of enzymatic hydrolysis followed by fermentation of simple sugars. First,
Biomass
Conditioning
Pretreatment
and
Carbohydrates
Extraction
Saccharification
of Disaccharides
and
Polysaccharides
Fermentation of Simple Sugars
Distillation Dehydration
Anhydrous
Ethanol
Recycled
Stillage
as Fertiliser
Waste
Water
Co-products
for Animal Feed
and Other Uses
Heat and
Electricity
Generation
FIGURE 5.1 Schematic outline of the biomass-to-ethanol process. (From Gnansounou,
E. and A. Dauriat. 2005. Journal of Scientic and Industrial Research 64:809–821. With
permission.)
© 2009 by Taylor & Francis Group, LLC
Fuel Ethanol 61
invertase (an enzyme present in the yeast) catalyzes the hydrolysis of sucrose to
convert it into glucose and fructose. Then, another enzyme (zymase), also present in
the yeast, converts the glucose and the fructose into ethanol and CO
2
. One tonne of
hexose (glucose or fructose) theoretically yields 511 kg of ethanol. However, practi-
cal efciency of fermentation is about 92% of this yield.
In the bioethanol industry, the sucrose feedstock is mainly sugarcane and sugar
beet. It may also be sweet sorghum. A signicant share of the fuel ethanol world-
wide comes from sugarcane juice, Brazil being the main producer. In 2005, Brazil
produced 16 billion liters of fuel ethanol, 2 billion of which were exported. Another
potential large producer of sugarcane-to-ethanol is India, as this country is, with
Brazil, the world leader of sugarcane production. However, Indian bioethanol pro-
duction is currently low; around 300 million liters were produced in 2005 mainly
from sugarcane molasses. The European Union (EU) is also a potentially large pro-
ducer of ethanol based on sugar beet juice. Sugar beet currently plays a minor role in
the production of ethanol in the EU compared to wheat but can increase signicantly
its market share in the future due to new incentives given by the EU for energy crops.
In 2005, around 950 million liters of bioethanol were produced in the EU.
5.2.3 St a r c H -t o -et H a n o l
For converting starch to ethanol, the polymer of alpha-glucose is rst broken through
a hydrolysis reaction with glucoamylase enzyme. The resulting sugar is known as
dextrose, or -glucose that is an isomer of glucose. The enzymatic hydrolysis is then
followed by fermentation, distillation, and dehydration to yield anhydrous ethanol.
In the fuel bioethanol industry, starch is mainly provided by the grains (corn,
wheat, or barley). Corn, which is the dominant feedstock in the starch-to-etha-
nol industry worldwide, is composed of 60 to 70% starch. Conversion to ethanol
is achieved in dry or wet mills. In the dry-milling process, the grain is ground to
a powder, which is then hydrolyzed and the sugar contained in the hydrolysate is
converted to ethanol while the remaining ow containing ber, oil, and protein is
converted into a co-product known as distillers grains (DG), or DGS when it is com-
bined to process syrup. The co-product is either made available wet (WDGS), or
more commonly dried (DDGS) and is sold as animal feed. WDGS is preferably
reserved to local markets while the co-product is usually dried if the feed has to be
shipped far away. Another co-product may be carbon dioxide, which can be sold for
different applications (e.g., carbonated beverages or dry ice). Dry mills are dominant
in the grain-to-ethanol industry. However, in a number of large facilities, the mills
are kinds of bioreneries in which the grains are wet milled for rst separating
the different components, that is, starch, protein, ber, and germ, before converting
these intermediates into nal co-products.
The United States is the leading grain-based ethanol producer in the world and
the second producer, all feed-stocks inclusive. Its production of fuel ethanol increased
rapidly recently, from 8 billion liters in 2002 to 15 billion liters in 2005. Corn-to-
ethanol mills represented around 93% of the 18.5 billion liters of U.S. bioethanol
capacity in 2006. The renaissance of fuel ethanol in the United States started from
the world oil crises of 1973 and 1979 with the aim to improve the U.S. energy supply
© 2009 by Taylor & Francis Group, LLC
62 Handbook of Plant-Based Biofuels
security. Later on, ethanol was used as a substitute to lead in gasoline. Finally, the
Clean Air Act of the 1990s spurred on the use of bioethanol as an oxygenated com-
pound in the reformulated gasoline, especially in areas where smog was an issue. As
oxygenate, ethanol competes with methyl-tertiary-butyl-ether (MTBE). The ban of
MTBE in several states launched the irresistible rise of ethanol in the U.S. oxygenates
market. Besides these uses, fuel ethanol is also marketed as a gasoline extender and
octane booster. Gasohol, a blend of 10% ethanol, 90% gasoline by volume, is used in
conventional internal combustion engines. FFVs are currently emerging in the new
car market. Other major grain-to-ethanol producers are the European Union, where
wheat is the dominant feedstock. Canada and China are producers as well. South
Africa has launched an ambitious corn-to-ethanol program.
5.2.4 li G n o c e l l u l o S i c S -t o -et H a n o l
The main drawbacks of the current biomass-to-ethanol processes are as follows: the
use of agricultural feedstock and the potential effects on food markets, the potential
pressure on land use and natural resources such as water. The perspectives of bio-
based fuels as options for partial fossil fuels substitution has encouraged research on
the availability of biomass feedstock and development of efcient conversion pro-
cesses. In the case of fuels for transport, bioconversion of lignocellulosic materials to
ethanol has been recognized as one of the promising routes of producing competitive
substitutes to gasoline. Lignocellulosics are the most abundant source of unutilized
biomass. Their availability does not necessarily impact land use. Agricultural or
forestry residues are available though their collection is costly. However, conversion
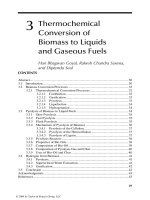
of lignocellulosic materials to ethanol is more complex. Lignocellulose is composed
mainly of cellulose, hemicelluloses, and lignin (see Figure 5.2).
Cellulose molecules consist of long chains of beta-glucose monomers gathered
into microbril bundles. The hemicelluloses can be xyloglucans or xylans depending
on the type of plant. The backbone of the former consists of chains of beta-glucose
monomers to which chains of xylose (a ve-carbon sugar) are attached. Xylans are
Cellulose Bundles
Hemicellulose
Lignin
Cellulose
FIGURE 5.2 Structure of plant cell walls. (From Shleser, R. 1994. Ethanol Production in
Hawaii. Honolulu: State of Hawaii, Energy Division, Department of Business, Economic
Development and Tourism. With permission.)
© 2009 by Taylor & Francis Group, LLC
Fuel Ethanol 63
composed mainly of xylose linked to arabinose or other compounds that vary from
one biomass source to the other. The hemicellulose molecules are linked to the micro-
brils by hydrogen bonds. Lignins are phenolic compounds formed by polymeriza-
tion of three types of monomers (i.e., p-coumaryl, coniferyl, and synapyl alcohols),
the proportion of which differs signicantly depending whether the plant is from the
family of gymnosperms, woody angiosperms, or grasses. Lignin adds to the cell wall
a compressive strength and stiffness (Raven, Evert, and Eichhorn 1999).
Lignocellulose does not compete with food. Typical sources of lignocellulosic
biomass are bagasse of sugarcane or sweet sorghum, corn stover, grasses, woody
biomass, industrial wastes, and dedicated woody crops (e.g., poplar). Table 5.1 gives
proportions of each component in a typical lignocellulosic biomass.
Once the lignocellulosic biomass is pretreated and hydrolyzed, the released sug-
ars are fermented. The downstream process is similar to that used for sweet juice and
starch. The aim of the pretreatment is the delignication of the feedstock in order
to make cellulose more accessible in the hydrolysis step. Existing methods can be
classied as physical, physicochemical, chemical, and biological treatment (Sun and
Cheng 2002). In Table 5.2, the performance of a few methods is assessed with regard
to the yield of fermentable sugars, inhibitors, the recycling of chemicals, the produc-
tion of wastes, and the investments.
This comparison shows that carbonic acid and alkaline extraction have the best
performance. However, the most common methods are steam explosion and dilute
acid prehydrolysis, followed by enzymatic hydrolysis. In the steam explosion method,
the lignocellulosic materials are treated with high-pressure saturated steam (0.69–4.83
MPa) at high temperature (160–260°C) for several seconds to a few minutes. Then
the pressure is suddenly dropped to atmospheric pressure, causing the material to
explode. Most of the hemicellulose is solubilized during the process, the efciency of
which depends on the temperature and residence time. It is reported that lower tem-
perature and longer residence time give a higher efciency (Wright 1998). Sulfuric
acid or carbon dioxide is often added in order to reduce the production of inhibitors
and improve the solubilization of hemicellulose (Morjanoff and Gray 1987). Steam
explosion has a few limitations: the lignin-carbohydrate matrix is not completely bro-
ken down; degradation products are generated that reduce the efciency of hydrolysis
and fermentation steps; a portion of the xylan fraction is destroyed.
The use of dilute acid is the method prefered by the U.S. National Renewable
Energy Laboratory (Wooley, Sheehan, and Ibsen 1999; Aden et al. 2002). In this
method, the structure of the lignocellulosic materials is attacked with a solution of
TABLE 5.1
Typical Proportion of Cellulose, Hemicellulose, and
Lignin in Lignocellulosic Biomass
Component Percentage of Dry Weight
Cellulose 40–60
Hemicellulose 20–40
Lignin 10–25
© 2009 by Taylor & Francis Group, LLC
64 Handbook of Plant-Based Biofuels
0.5 to 1.0% sulfuric acid at about 160 to 190°C for approximately 10 minutes. Dur-
ing this reaction, the hemicellulose is largely hydrolyzed, releasing different simple
sugars (e.g., xylose, arabinose, mannose, and galactose) but also other compounds
of the cellulosic matrix, a few of which can inhibit the enzymatic hydrolysis and
fermentation. The stream is then cooled. Part of the acetic acid, much of the sulfu-
ric acid and other inhibitors produced during the degradation of the materials are
removed. Finally neutralization is performed and pH is set to 10 before hydrolysis
and fermentation.
Enzymatic hydrolysis of cellulose is achieved using cellulases, which are usu-
ally a mixture of groups of enzymes such as endoglucanases, exoglucanases, and
beta-glucosidases acting in synergy to attack the crystalline structure of the cel-
lulose, removing cellobiose from the free chain ends and hydrolyzing cellobiose to
produce glucose. Cellulases are produced by fungi such as Trichoderma reesei, the
most common fungus used for this purpose. Other fungi are species of Aspergil-
lus, Schisophyllum, and Penicillium. Efciency of cellulose enzymatic hydrolysis
has been reported to be affected by the substrate to enzyme ratio, cellulase dos-
age, and the presence of inhibitors. Cellulase loading may vary from 7 to 33 FPU/g
(substrate) depending on the substrate structure and concentration (Sun and Cheng
2002). High concentration of cellobiose and glucose inhibits the activity of cellulase
enzymes and reduces the efciency of the saccharication. One of the methods used
to decrease this inhibition is to ferment the reduced sugars along their release. This
is achieved by simultaneous saccharication and fermentation (SSF) in which fer-
mentation using yeasts such as Saccharomyces cerevisiae and enzymatic hydrolysis
TABLE 5.2
Advantages and Weaknesses of Selected Pretreatment Processes
Pretreatment Process
Yield of
Fermentable
Sugars Inhibitors
Chemical
Recycling Wastes Investment
Physical
- Mechanical - ++ ++ ++ +
Physicochemical
- Steam explosion
- Ammonia ber explosion
(AFEX)
- Carbonic acid
+
+/-
++
++
++
++
++
+
+
++
–
+
Chemical
- Dilute acid
- Concentrated acid
- Alkaline extraction
- Wet oxidation
- Organosolv
++
++
++/+
+/-
++
++
+
++
++
–
–
_
_
+
+
+/-
–
++
+
++: very good with regard to; +: good with regard to; -: bad with regard to; : very bad with
regard to
Based on de Bont, J. A. M. and J. H. Reith, personal communication.
© 2009 by Taylor & Francis Group, LLC
Fuel Ethanol 65
are achieved simultaneously in the same reactor. The fermentation of the xylose
released from the prehydrolysis process can be carried out in a separate vessel or in
the SSF reactor using a genetically modied strain from the bacterium Zymomonas
mobilis that can convert both glucose and xylose. The latter method is named simul-
taneous saccharication and co-fermentation (SSCF).
Compared to the sequential saccharication and fermentation process, the SSCF
exhibits several advantages, including lower requirement of enzyme, shorter process
time, and cost reduction due to economy in fermentation reactors (only one reactor
compared to three sets). However, a few disadvantages need to be taken into consider-
ation, including the difference between the optimal temperatures for saccharication
(50–60°C) and fermentation (30°C), the inhibition of enzymes and yeast to ethanol,
and the insufcient robustness of the yeast in co-fermenting C5 and C6 sugars.
The main co-product of lignocellulose conversion to ethanol is energy. The efu-
ent from the distillation column that contains most of the lignin and other nonferment-
able products is sent to a combined heat and power (CHP) plant to produce process
steam and electricity required by the ethanol plant. Depending on the proportion of
lignin in the feedstock, excess electricity may be available for export sale.
Contrary to the conversion of sweet juice and that of starch to ethanol, which are
mature technologies, the modern lignocellulose-to-ethanol process is still in the pilot
and demonstration stages. A few facilities exist: the U.S. National Renewable Energy
Laboratory has built a pilot plant based on the SSCF method capable of processing
one ton of dry material per day (DOE 2000); Iogen Corporation (Canada) in 2003 built
a demonstration plant with an annual production of 320,000 liters of ethanol, using
wheat straw as feedstock and a sequential steam explosion prehydrolysis (cellulose
production), enzymatic hydrolysis of cellulose and co-fermentation of xylose and glu-
cose; in 2004, a Swedish company ETEK developed a pilot plant capable of producing
150,000 liters of ethanol per year using soft wood as feedstock (Lindstedt 2003).
5.3 OUTLOOK FOR BIOETHANOL DEVELOPMENT
5.3.1 d
r i v e r S f o r fu e l et H a n o l de v e l o P m e n t
The following key factors can inuence the future development of fuel ethanol
worldwide: security of the energy supply, economic drivers, environmental drivers,
and technological development.
5.3.1.1 Security of the Energy Supply
The prospective of fossil sources depletion in the long term, particularly the pressure
on world oil reserves, is the subject of growing concerns in net oil import countries.
Geopolitical instability in several oil producing countries and the rising oil demand
in emerging Asian economies such as China and India add to the threat of oil sup-
ply insecurity in the medium to long term. Development of biofuels is considered
a viable option for energy supply diversication. Furthermore, potential biofuel-
producing countries are more diverse geographically than oil-producing countries.
However, due to several factors, such as land use, risk of competition with food, and
© 2009 by Taylor & Francis Group, LLC
66 Handbook of Plant-Based Biofuels
ecological risks, biofuels can only substitute for a small part of world road-transport
fuel demand, for example, 4 to 7% in 2030 compared to 1% in 2005 (IEA 2006).
5.3.1.2
Economic Drivers
The cost of bioethanol to end users is one of the most important drivers of fuel ethanol
development. That cost is composed of the price of bioethanol, investment and operat-
ing costs of vehicles using bioethanol. In several countries, the production cost of bio-
ethanol is higher than that of gasoline at the current price of oil, requiring governmental
incentives such as partial or total tax exemption to make fuel ethanol competitive.
The production cost of bioethanol fuel depends on many factors, including the
conversion pathway, plant size and location, feedstock and co-products markets,
which may vary from one country to the other and within the same country proj-
ects may have different production costs (see Table 5.3). The ethanol derived from
sugarcane juice is commonly cheaper than the others; production in North America
(Brazil and the United States) is less expensive than that in Europe due to a learning
curve, low cost of feedstock, and other differences in expenditures. The possibility
to valorize co-products contributes to reducing the production cost of bioethanol.
Finally, lignocellulose-to-ethanol is expected to be, in the long term, more competi-
TABLE 5.3
Typical Bioethanol Fuel Production Costs
Reference Feedstock
Country or
Region
Range of
Sizes (Million
Liters per
Year)
Production Cost
(US$/Liter)
Walter
a
Gnansounou et al. 2005
Gnansounou et al. 2005
F. O. Licht 2006
F. O. Licht 2006
Sweet Juice
Sugarcane
Molasses
Sweet sorghum
Sugar beet
Sugar beet
Brazil
China
China
Germany
Germany
–
125
125
200
50
0.17–0.19
0.30
0.27
0.48
0.55
F. O. Licht 2006
Gnansounou et al. 2005
Gnansounou et al. 2005
F. O. Licht 2006
F. O. Licht 2006
Starch
Corn
Corn
Cassava
Wheat
Wheat
U.S.
China
China
Germany
Germany
–
125
125
50
200
0.25
0.31
0.23
0.51
0.44
Wooley et al. 1999
Aden et al. 2002
Gnansounou et al. 2005
Lignocellulose
Yellow poplar
Corn stover
Bagasse of sweet
sorghum
U.S.
U.S.
China
197
262
125
0.38
0.28
0.30
a
Walter, A. Experience with large-scale production of sugar cane and plantation wood for the export
market in Brazil; impacts and lessons learned (Based on Walter, A., personal communication) March,
2005.
© 2009 by Taylor & Francis Group, LLC
Fuel Ethanol 67
tive than ethanol from corn although its reported production cost is currently based
on engineering estimates as no commercial plant exists.
Assuming that the production cost of gasoline in 2015 will be between 0.45 and
0.55 US$ (2000) per liter, on a volume basis, bioethanol at its current production cost
will be competitive. The situation is different if the comparison is made on an energy
basis as the LHV of ethanol is 30% lower than that of gasoline. Therefore, in several
countries, subsidies and tax reductions by the government will still be required for
sustaining the penetration of bioethanol. However, this conclusion will depend a lot on
the market price of gasoline. Another way to promote bioethanol introduction in the
market is to cross-subsidize ethanol by fossil fuel. This approach increases the price
of fuel for consumers and is neutral from a taxation point of view. When the differ-
ence between the production cost of ethanol and fossil fuels is low and the blend level
is about 5%, the increase in price is not signicant as the oil price is very volatile. In
the case of high ethanol production cost as in Europe, direct subsidies are required in
order to make ethanol introduction affordable to most of consumers. Finally, the costs
borne by the end-users can be lower if international bioethanol trade is encouraged.
At present, various barriers limit that trade to a low percentage of the demand. One
such barrier is the lack of international quality and sustainability standards.
5.3.1.3
Environmental Drivers
The main environmental drivers of bioethanol supply chains are as follows: net
energy balance, greenhouse gas (GHG) emissions balance, and local environmental
effects. The net energy balance of biomass-to-ethanol measures, from a life cycle
assessment (LCA) viewpoint, is the ratio of the energy content of bioethanol to the
net nonrenewable primary energy (allocated to ethanol) consumed in the whole pro-
duction process, from biomass production to its conversion into ethanol. On average,
the ratio (output/input) between the produced ethanol and the input of nonrenewable
energy varies from 1.0 to 5.0 or more. These values depend on the following factors:
allocation between ethanol and co-products; the use of renewable energy for fuel-
ling the process, the agricultural practices for producing the feedstock, the energy
integration within the production plant, the size of the plant, and transport distances
between the plant and the area of biomass collection. Intensive agriculture needs
more fertilizers and leads to a larger grey energy input. Recycling the residues to
produce process steam and electricity, as is often the case for sugarcane, improves
the net energy balance.
5.3.1.4
Greenhouse Gas Balance
The net GHG balance is a key driver of bioethanol development, as in several coun-
tries reduction of GHG emissions is one of the main objectives of the promotion of
bioethanol. Particularly in Kyoto Protocol Annex I countries, development of biofu-
els consumption is expected to contribute signicantly to the achievement of GHG
emissions reduction. However, as is the case for net energy balance, the performance
of bioethanol with regard to GHG emissions varies from one supply chain to the
other. It also depends closely on the allocation method and the reference system
adopted for the LCA. Based on several assessments undertaken by the Laboratory
© 2009 by Taylor & Francis Group, LLC
68 Handbook of Plant-Based Biofuels
of Energy Systems (LASEN), it is found that with an incorporation rate of 5% anhy-
drous ethanol within gasoline and an equal performance with respect to conventional
gasoline, the net savings of GHG emissions vary between 1.5 kg (low performance
agricultural feedstock) and 2.5 kg (waste lignocellulosic biomass) of CO
2
equiva-
lent per liter of ethanol incorporated to gasoline. In these evaluations, the life cycle
inventory was described in the context of Switzerland with economic allocation, and
the reference vehicle was a recent standard 1.6 l light passenger vehicle (Gnansounou
and Dauriat 2004).
5.3.1.5
Other Environmental Effects
As ethanol contains more oxygen than gasoline, its use favors more complete com-
bustion and reduces the emission of particulate matter (PM) and hydrocarbons
(HC) which result from incomplete combustion of gasoline. Tailpipe emissions
of carbon monoxide (CO) and sulphur dioxide (SO
2
) are also improved. However,
low-level blends of ethanol with gasoline can increase the emissions of volatile com-
pounds (VOCs) and oxide of nitrogen (NO
x
). These emissions favor ozone forma-
tion. Emissions of aldehydes (mostly acetaldehydes) and peroxyacetyl nitrate (PAN)
also increase, to an extent that depends on weather conditions. The use of catalytic
converters reduces the emissions of aldehydes. VOCs emissions can be prevented
by reducing in renery the vapor pressure of gasoline that is blended with etha-
nol. Experiments about different percentages of ethanol-diesel blends show signi-
cant advantages concerning PM, NO
x
, and CO. However, no evidence is given for
improvement of HC emissions (Ahmed 2001). Furthermore, ethanol is more cor-
rosive than gasoline and diesel and at high concentration can damage fuel system
components. For low-level blends, these concerns are limited and E5 or E10 can be
used in existing vehicles without violating most manufacturers’ warranties. For high
concentrations of ethanol, compatible materials are used in adapted or dedicated
designed vehicles. Finally, biomass-to-ethanol impacts land use unless the feedstock
is an agricultural or forestry waste that is not required for soil fertilization.
5.3.1.6
Technological Development
The goal of technological advances is to achieve reduction of GHG all along the sup-
ply chain, from good practices in agriculture to the valorization of the whole biomass
through the biorenery concept; reduction of production costs through process and
value chain optimization; development of low-cost lignocellulose-to-ethanol. The over-
all goal of this progress will be to decrease signicantly the cost of GHG reduction.
5.3.2 fu t u r e de m a n d a n d t H e Pr o d u c t i o n o f Bi o e t H a n o l
World demand for fuel ethanol in 2015 is estimated to range between 65 and 90 bil-
lion liters. Brazil and the United States will remain the leading consumers followed
by the European Union. Several other countries will emerge, especially in Asia. In
Brazil, the evolution of the FFVs market share is a key driver of future fuel ethanol
demand; the market share of FFVs in new gasoline used cars was more than 80% in
2006. The rush on that technology has created a new situation from which bioethanol
© 2009 by Taylor & Francis Group, LLC
Fuel Ethanol 69
becomes a direct competitor of gasoline. Consumers will maintain their preference
for high-level ethanol blend to gasoline as long as the price of bioethanol in Brazil
reects the production cost and the price of gasoline is higher. However, another
scenario is also possible. The role of Brazil as an exporter of bioethanol may be
enhanced in the future as international demand for bioethanol may increase owing to
the growth of the carbon market. The price of bioethanol in Brazil will be inuenced
both by the international price of gasoline and by the prices of ethanol and sugar in
international markets. These interrelations may enhance the volatility of the local
price of ethanol and contribute to escalating the local price. This scenario would
result in a low growth rate of the internal demand of fuel ethanol. The production of
fuel ethanol in Brazil in 2015 is estimated to be in the range of 28 to 35 billion liters,
with export volume of 4 to 8 billion liters.
In the United States, bioethanol demand will continue to grow, boosting by the
ban of MTBE and the Energy Policy Act (EPACT) of 2005 that sets up a national
Renewable Fuels Standards (RFS). This new legislation establishes a baseline for use
of renewable fuels, starting from 4 billion American gallons (15.14 billion liters) in
2006 to 7.5 billion American gallons (28.39 billion liters) in 2012. The Renewable
Fuels Association (2006) foresees that a large share of the renewable fuel will be
bioethanol. The estimated demand for fuel ethanol in the United States ranges from
25 to 30 billion liters in 2015 with a maximum net import of 2 billion liters.
In 2003, the European Union adopted an alternative motor fuels directive which
sets up indicative biofuel market share targets of 2% and 5.75% (in energy content) for
2005 and 2010, respectively. In a progress report issued on the January 10, 2007, the
European Commission (Commission of the European Communities 2007) estimated
the market share in 2005 to be 1% and then envisaged from 2020 a mandatory mini-
mum target of 10% biofuel in 2020. Assuming a 128 billion liter gasoline demand
in 2015 and applying a mandatory target of 8% results in a fuel ethanol demand of
13 billion liters. The European fuel ethanol demand in 2015 is estimated to range
between 10 and 15 billion liters. Asia is another region where the fuel bioethanol
market is increasing very rapidly. China’s program for bioethanol fuel is promising
in the short term; however, in the long term, it is forecast that China will become a
net importer of corn. The success of Indian production of sugarcane-to- ethanol will
mainly depend in technology progress and improvements in agricultural practices.
The low availability of water is the main bottleneck. Thailand is developing a bio-
ethanol program on a wide scale with the aim to diversify feedstocks between sugar-
cane and cassava. Japan is also on track, with a program of production in Brazil for
import. It is expected that the South African bioethanol development program will
expand at a regional level: the Southern Africa Development Community (SADC) is
prepared to adopt such a vision. Fuel ethanol demand in 2015 for the rest of the world
is estimated between 10 to 15 billion liters.
5.4 CONCLUSIONS
From 2005 to 2015, world demand for fuel ethanol will more than double. Assuring
this growth without a signicant environmental footprint and avoiding social and
economic hurdles are challenging. The idea is progressing in several countries that
© 2009 by Taylor & Francis Group, LLC
70 Handbook of Plant-Based Biofuels
biofuels should be developed in a regulated framework. Efforts to set up standards for
sustainability of biofuels are in progress, especially in the United Kingdom (Tipper
et al. 2006), Germany (Öko-Institut 2006), and the Netherlands (Cramer Commis-
sion 2007). The following themes are often included in draft standards: greenhouse
gas balance; local environment (air, water, soil) and biodiversity; social well-being,
that is, competition with food, local energy supply, medicine, and building materials;
economic prosperity.
Having developed long experience with low-level ethanol blends (E10 to E25), as
well as with nearly pure ethanol (E85), Brazil and the United States benet from the
learning curve and particularly favorable conditions with regard to agricultural feed-
stocks, that is, sugarcane for Brazil and corn for the United States. Especially, Brazil
exhibits the lowest production costs of fuel ethanol worldwide and is in position to
capture a large share of the international market in the future. However, the market
price of fuel ethanol will uctuate as a result of the balance between demand and
supply of bioethanol, oil, and sugar. It is likely that the trend will be for an increase
due to rapid growth in the world ethanol demand in the future. In industrialized
countries, the economy of fuel ethanol development will depend a lot on possibilities
to alleviate market barriers that limit international trade. It is expected that future
negotiations in the framework of the World Trade Organization will help nd a good
balance between the desire of bioethanol producers from developing countries to
export and the desire of the industrialized countries to protect their local ethanol
industry. In this respect, it is important to prevent using standards of biofuel sustain-
ability as a new instrument of protectionism. Lignocellulosics-to-ethanol is expected
to equalize comparative advantages among most of the countries while enhancing
the GHG balance. Research to decrease production cost is a key driver of the smooth
development of the fuel ethanol market in the future. However, competition with
other energy uses of lignocellulosics has to be considered, such as biocombustibles,
biomass-to-liquids technologies (BTL) such as the Fischer-Tropsch process and bio-
mass-to-gas (BTG). There is a need for a neutral framework for dening internation-
ally acceptable standards for bioenergies that will enable the promotion of the most
viable pathways of biomass-to-energy. The initiative (Frei, Gnansounou, and Püt-
tgen 2006) launched in November 2006 by the Energy Center of the Swiss Federal
Institute of Technology, aimed at dening such standards for biofuels, is in line with
that requirement.
REFERENCES
Aden, A., M. Ruth, K. Ibsen, and J. Jechura. 2002. Lignocellulosic Biomass to Ethanol
Process Design and Economics Utilizing Co-Current Dilute Acid Prehydrolysis and
Enzymatic Hydrolysis for Corn Stover. Report T-P510-32438. Golden, CO: National
Renewable Energy Laboratory.
Ahmed, I. 2001. Oxygenated diesel: emissions and performance characteristics of ethanol-
diesel blends in CI engines. SAE report No 2001-01-2475.
Commission of the European Communities. 2007. Biofuels Progress Report. COM(2006)
845 nal, Brussels.
© 2009 by Taylor & Francis Group, LLC
Fuel Ethanol 71
Cramer Commission. 2007. Testing framwork for sustainable biomass. Final report from the
project group ‘Sustainable production of biomass.’ IPM, March 2007, The Netherlands.
www.nl/biobrandstoffen/download/070427/cramer/nalreportEN.pdf.
DOE (Department of Energy). 2000. The DOE Bioethanol Pilot Plant. DOE leaet
GO-10200-1114. Washington, DC: DOE.
F. O. Licht. 2006. World Ethanol Markets. The Outlook to 2015. An F.O. Licht Special Report
No. 138.
Frei, C., E. Gnansounou, and H. B. Püttgen. 2006. Sustainable Biofuels Standards Initiative.
Lausanne: EPFL-Energy Center.
Gnansounou, E. and A. Dauriat. 2004. Comparative Study of Fuels by Analysis of Their
Life Cycle. Report prepared for Alcosuisse, Laboratory of Energy Systems (LASEN),
EPFL, Switzerland (in French).
Gnansounou, E. and A. Dauriat. 2005. Ethanol fuel from biomass: A review. Journal of Sci-
entic & Industrial Research 64: 809–821.
Gnansounou, E., A. Dauriat, and M. Amiguet. 2005. Economic and Social Protability. Deliv-
erable of WP6 of the EU project ASIATIC, Laboratory of Energy Systems (LASEN),
Lausanne, Switzerland.
IEA (International Energy Agency). 2006. World Energy Outlook 2006. Paris: Organisation
for Economic Co-operation and Development.
Lindstedt, J. 2003. Alcohol production from lignocellulosic feedstock. In FVS Fachtagung,
228–237. Network Regenerative Kraftstoffe (RefuelNet) Stuttgart, Germany.
MBEP (Michigan Biomass Energy Program). 2002. Fact Sheet. higanbioen-
ergy.org/ethanol/edieselfacts.htm
Morjanoff, P. J. and P. P. Gray. 1987. Optimization of steam explosion as a method for increas-
ing susceptibility of sugarcane bagasse to enzymatic saccharication. Biotechnology
and Bioengineering 29: 733–741.
Öko-Institut. 2006. Sustainability Standards for Bioenergy. WWF, Germany.
Raven, P. H., R. F. Evert, and S. E. Eichhorn. 1999. Biology of Plants, 6th ed. New York: Free-
man and Company/Worth Publishers.
Renewable Fuels Association. 2006. From Niche to Nation, Ethanol Industry Outlook 2006.
SAE. 2001. National Ethanol Vehicle Challenge Design Competition. www.saeindia.org
Shleser, R. 1994. Ethanol Production in Hawaii. State of Hawaii, Energy Division, Depart-
ment of Business, Economic Development and Tourism, Honolulu.
Sun, Y. and J. Cheng. 2002. Hydrolysis of lignocellulosic materials for ethanol production: A
review. Bioresource Technology 83: 1–11.
Tipper, R., J. Gărstang, W. Vorley, and J. Woods. 2006. Draft Environmental Standards for Bio-
fuels. London LOWCVP. 2006. />Wooley, R. R., J. Sheehan, and K. Ibsen. 1999. Lignocellulosic Biomass to Ethanol Process
Design and Economics Utilizing Co-Current Dilute Acid Prehydrolysis and Enzy-
matic Hydrolysis: Current and Futuristic Scenarios. Report TP580-26157. Golden, CO:
National Renewable Energy Laboratory.
Wright, J. D. 1998. Ethanol from biomass by enzymatic hydrolysis. Chemical Engineering
Progress 84 (8): 62–74.
Wyman, C. E. 2004. Ethanol fuel. In Encyclopaedia of Energy, ed. C. J. Cleveland, 541-555.
New York: Elsevier.
© 2009 by Taylor & Francis Group, LLC