Biosensors for Health Environment and Biosecurity Part 10 doc
Bạn đang xem bản rút gọn của tài liệu. Xem và tải ngay bản đầy đủ của tài liệu tại đây (2.84 MB, 35 trang )
Biosensors for Health, Environment and Biosecurity
306
deoxycholate (DOCA) was found to be optimal with regard to hemoglobin surface loading,
regeneration and direct reduction of the bound hemoglobin. Unlike their previous work,
blood samples were first incubated with FcBA and then applied on the modified surface.
The boronic acid/diol interaction is much faster in alkaline conditions; on the other hand,
hemoglobin has lower stability at these pHs. Consequently, the optimum pH for incubation
was found to be 8.0. Denaturation of hemoglobin before incubation with FcBA (by heat
treating at 75 °C for 300s) is required for detection of HbA1c and the electrochemical
response of the heme groups and also increases binding with DOCA-modified surface. The
amount of the total hemoglobin bound to the surface is monitored by a quartz crystal
nanobalance (QCN). Upon immobilization of hemoglobin on the electrode surface, the
oscillation frequency of the quartz crystal decreases. The decrease in the frequency is
proportional to the amount of adsorbed total hemoglobin. Fig. 14 shows a typical response
of the QCN upon hemoglobin binding and regeneration of the DOCA-modified
piezosensor. The oscillation frequency decreases after hemoglobin binding, but increases
again after washing loosely bound hemoglobin and returns back to the baseline after
regeneration and removal of bound hemoglobin. More than 30 binding-regeneration cycles
were possible without loss of sensitivity.
Fig. 14. Typical QCN response after Hb-binding to the DOCA-modified piezosensor. (A)
Injection of Hb (7.75μM) is followed by (B) washing with buffer (Sörensen phosphate buffer
pH 7.5) and (R) 5 min regeneration using pepsin solution. The dotted line represents the
baseline of the piezoelectric quartz crystal. Before measurement, Hb was incubated at 75 °C
for 300 s (Halámek J. , Wollenberger, Stöcklein, & Scheller, 2007).
These researchers used the same method of square wave voltammetry used in their earlier
work for measurement of the FcBA-bound HbA1c (Fig. 15). To ensure that all HbA1c
molecules are bound to FcBA, they added a 12-fold excess of FcBA to total hemoglobin. Fig.
16 shows the dependence of the current peak height of the SWV on %HbA1c. The standard
deviation of this calibration curve obtained from 5 measurements of each sample is
relatively high. This was partly attributed to the fact that the data were obtained in
Electrochemical Biosensor for Glycated Hemoglobin (HbA1c)
307
experiments performed over a period of 5 days. Further optimization of the technique to
reduce the measurement variability and attain a detection limit below 5% HbA1c is needed.
Fig. 15. Scheme of the electrochemical HbA1c sensor based on binding of FcBA-labelled
HbA1c to the surface of the DOCA-modified piezoelectric quartz crystal and voltammetric
read out of the label (Halámek J. , Wollenberger, Stöcklein, & Scheller, 2007).
Fig. 16. Dependence of peak height of the SWV at +200mV vs. Ag/AgCl (1M KCl) on HbA1c
content in Hb sample. Hb samples (7.75μM solution in Sörensen phosphate buffer pH 8.0)
were preincubated with 1mMFcBAsolution at 75 °C for 300 s (number of measurements per
sample n = 5) (Halámek J. , Wollenberger, Stöcklein, & Scheller, 2007).
The same sensor was modified to enhance the signal by in situ tagging of an anti-HbA1c
antibody with FcBA (Halámek J. , Wollenberger, Stöcklein, Warsinke, & Scheller, 2007).
Measurement of the total immobilized hemoglobin was done by QCN as before, but an
Biosensors for Health, Environment and Biosecurity
308
additional step of incubating the anti-HbA1c antibody for 300s was done before introducing
FcBA to the system. This antibody selectively binds to the glycated N-terminus of the β-
chains of HbA1c. According to its structure, at least 5-6 terminal glycated residues contain
vicinal cis-diol groups compared with 1-2 terminal sugar residues of the β-chains of HbA1c.
Therefore, more FcBA per HbA1c molecule can bind to the surface and produce a higher
SWV peak current and thereby increase the electrochemical signal. A comparison of this
approach with that of direct tagging of HbA1c with FcBA described previously shows a 3.6-
fold increase in sensitivity (Fig. 17). Although all the experiments were conducted in a single
day, the standard deviations based on 3 measurements per sample were still high and
accurate detection of HbA1c levels below 5% was still a problem.
Fig. 17. Dependence of peak height of the SWV at +300 mV versus Ag/AgCl (1M KCl) on
the HbA1c content in the Hb sample (total Hb 7.75 μM in Sörensen buffer pH 8.0,
preincubated at 75°C). After immobilization of Hb onto the DOCA sensor, either FcBA (○) or
anti-HbA1c Ab and then FcBA (•) was injected. SWV were then measured in stopped flow
(Halámek J. , Wollenberger, Stöcklein, Warsinke, & Scheller, 2007).
Son et al fabricated a disposable biochip for electrochemical HbA1c measurement (Son, Seo,
Choi, & Lee, 2006). They used ferricyanide (K
3
Fe(CN)
6
) as mediator so that the electrons
released from the oxidation of Fe
2+
in hemoglobin were transferred to the electrode by the
ferricyanide/ferrocyanide couple. A schematic view of their %HbA1c measurement
procedure is shown in Fig. 18. The components integrated in the system are a pair of
interdigitated array (IDA) electrodes, HbA1c binding chamber, blood lysis chamber, filter,
micro-pump and microchannel. After plasma separation (1) and red blood cell (RBC) lysis
(2), the total hemoglobin stream branches off into two separate streams: in the lower stream
HbA1c is immobilized on a packed agarose bead containing m-amino-phenylboronic acid
(m-APBA) in the binding chamber and releases hemoglobin, while total hemoglobin flows
in the upper stream (3). The ratio of the resulting electrochemical signals from the lower and
upper streams after passing through the IDA electrodes yields the %HbA1c. Due to the non-
homogeneous distribution of hemoglobin, the instantaneous current varies as a sample
flows through the IDA electrodes. Consequently, the integral of the current over time was
Electrochemical Biosensor for Glycated Hemoglobin (HbA1c)
309
used for measurement. Unfortunately, no information on the performance of this biosensor
was provided in the article.
Fig. 18. Schematic of the %HbA1c measurement process (Son, Seo, Choi, & Lee, 2006).
In another study, Park et. al. reported an electrochemical HbA1c measurement method
based on selective immobilization of HbA1c on a gold electrode covered with a thiophene-3-
boronic acid (T3BA) self-assembled monolayer (SAM) and detecting HbA1c by label-free
electrochemical impedance spectroscopy (EIS) (Park, Chang, Nam, & Park, 2008).
Presumably, these researchers chose to modify the gold electrode with T3BA based on the
common use of 3-aminophenylboronic acid to bind to a solid support for HbA1c separation
from hemoglobin in boronate affinity chromatography. This species can form a self
assembling monolayer (SAM) on a gold surface. The reported binding mechanism is based
on bonding between the sulphur atom of the π-stacked thiophene SAM and the gold. The
binding of T3BA and formation of a SAM on the gold was confirmed by the use of a quartz
crystal microbalance (QCM), atomic force microscopy (AFM) and EIS experiments. Figs. 19
and 20 show the progress of T3BA binding over time as measured by QCM and an AFM
image of a HbA1c/T3BA-SAM, respectively.
Fig. 19. QCM results for the HbA1c binding upon injection of 100 μL of diluted 11.6%
HbA1c solution into 2 mL of the pH 8.5 buffer solution (10 mM 4-ethylmorpholine) (Park,
Chang, Nam, & Park, 2008).
Biosensors for Health, Environment and Biosecurity
310
Fig. 20. AFM image the HbA1c/T3BA-SAM immobilized on it (left) along with
corresponding cross-sectional profiles of the spots marked by white circles on the images
(right) (Park, Chang, Nam, & Park, 2008).
Electrochemical determination of selectively immobilized HbA1c on the T3BA SAM is based
on measuring the change in the capability of the gold electrode for electron transfer due to
blocking of the electrode surface by HbA1c after immobilization. This is conducted using
standard HbA1c solutions diluted with a buffered (pH 8.5) solution containing 10 mM 4-
ethylmorpholine in a 3-electrode cell including a gold disk working electrode (0.020 cm
2
),
Ag/AgCl reference electrode and platinum spiral wire counter electrode. The T3BA SAM
has been found to have relatively high electrochemical activity since the charge transfer
resistance R
ct
is small only when it forms on the surface. On the basis of the shape of the EIS
Nyquist plot obtained, the SAM appears to cover the electrode surface uniformly with no
significant defects. The subsequent addition of HbA1c to the system causes the R
ct
value to
increase significantly. As shown in Fig. 21, the ratio of R
ct
obtained in the presence of HbA1c
to that obtained in its absence increases linearly with HbA1c concentration. Similarly, this
ratio varies linearly with %HbA1c in samples with the same total hemoglobin concentration
(Fig. 22). Such linear behaviour makes the T3BA-SAM modified electrode a satisfactory
platform for a HbA1c sensor. On the other hand, these results indicate that the variation of
this signal with HbA1c concentration also depends on total hemoglobin concentration.
Consequently, the total hemoglobin concentration must also be determined to obtain the
HbA1c content. Electrode regeneration can be carried out by washing with a sodium acetate
buffer at pH 5.0. Since this method is not selective for HbA1c over glycated albumin (also
present in blood under hyperglycemic conditions), glycated albumin must be separated
from RBC by centrifugation.
In another study, Song and Yoon used a boronic acid-modified thin film interface for
selective binding of HbA1c followed by electrochemical biosensing using an enzymatic
backfilling assay (Song & Yoon, 2009). They used a freshly evaporated gold working
electrode for the bottom-up layer formation process (Fig. 23). This procedure began with the
formation of an amine-reactive DTSP SAM on the gold which was then transferred to a
Electrochemical Biosensor for Glycated Hemoglobin (HbA1c)
311
Fig. 21. (a) Impedance data obtained for the T3BA-SAM-covered electrode before and after
immersion into various HbA1c concentrations diluted with 10 mM 4-ethylmorpholine buffer
(pH 8.5) for 5 min. (b) The ratio of resistances plotted versus HbA1c concentration (μg/mL)
(Park, Chang, Nam, & Park, 2008).
poly(amidoamine) G4 dendrimer solution. Then 4-formyl-phenylboronic acid (FPBA) was
immobilized on the dendrimer layer selective for HbA1c. FPBA functionalization was
confirmed by XPS and cyclic voltammetry. To carry out the backfilling assay, samples with
various ratios of HbA1c/HbA0 (with normal adult human hemoglobin concentration i.e.
150 mg/ml) in a pH 9.0 bicarbonate buffer were contacted with the functionalized surface to
react with FPBA for 1 hour. After rinsing with buffer and PBS, 1 mg/ml activated GOx in
PBS was added in order to bind to the remaining unreacted amine groups on the dendrimer-
FPBA layer or 30 minutes. The response of this electrode sensor was assessed by subjecting
it to a voltammetric scan from 0 to +500 mV vs. Ag/AgCl at a rate of 5 mV/s in PBS in the
Biosensors for Health, Environment and Biosecurity
312
presence of 0.1 mM ferrocenemethanol (as mediator) and 10 mM glucose (as substrate). The
anodic current measured at +400 mV was chosen as the sensor signal because of stable
current at this potential in the voltammogram. Fig. 24(A) shows voltammograms obtained at
different HbA1c concentrations. As expected, an increase in the HbA1c concentration leads
to a decrease in the resulting current due to less available space for GOx on the electrode.
The corresponding calibration curve for the anodic current at +400 mV as a function of
HbA1c concentration is shown in Fig. 24(B). Although this sensor has the advantage of
signal amplification without the need for pretreatment such as labelling or use of labelled
secondary antibody, incubation of the hemoglobin sample and then GOx solution requires 1
hour and 30 minutes, respectively. In addition, the sensitivity at HbA1c levels below 5% is
not sufficient.
Fig. 22. R
ct
ratio obtained at five HbA1c concentrations 20 minutes after sample injection
(Park, Chang, Nam, & Park, 2008).
Qu and coworkers fabricated a micro-potentiometric Hb/HbA1c immunosensor based on
an ion-sensitive field effect transistor (ISFET) using a MEMS fabrication process (Qu, Xia,
Bian, Sun, & Han, 2009). Such ISFET biosensors have numerous advantages such as easy
miniaturization and mass-production and rapid and label-free detection of a wide range of
chemical and biochemical species. The procedure involved modification of the gold working
electrode by electropolymerization of a polypyrrole (PPy)-HAuCl
4
composite followed by
electrochemical synthesis of gold nanoparticles (AuNP) and modification of the gold
reference electrode by applying a PPy film. The presence of AuNP on the surface (confirmed
by FE-SEM) is reported to enhance antibody immobilization. Also, the PPy-AuNp electrode
was electrochemically characterized by cyclic voltammetry and shown to exhibit better
redox reaction reversibility than a PPy electrode. For hemoglobin and HbA1c
immunosensor fabrication, anti-Hb antibodies and anti-HbA1c antibodies, respectively,
were immobilized on the modified working electrodes. The fabricated microelectrode chip
was then connected to an ISFET integrated chip. Charge adsorption at the ion/solid
interface of the sensing layer leads to a potential drop and influences the gate voltage of the
ISFET which is reflected by the change in the threshold voltage of the ISFET. Measurement
of the hemoglobin level was done by successive injection of 10 μL of hemoglobin solutions
Electrochemical Biosensor for Glycated Hemoglobin (HbA1c)
313
with concentrations of 60-180 μg/ml in PBS (pH 7.4) onto the SU-8 reaction pool of the
sensor. Fig. 25 shows the change in differential voltage response (ΔE) upon successive
addition of the samples (in comparison with the initial response in PBS). A linear relation
between the hemoglobin concentration and voltage response is observed between 60 and
180 μg/ml. The corresponding sensor sensitivity and variation coefficient of ΔE was
reported to be 0.205 mV μg
-1
ml and 21%. A similar experiment on whole blood samples
yielded a linear relation between ΔE and hemoglobin concentrations between 125-197
μg/ml with a sensitivity of 0.20 mV μg
-1
ml.
Fig. 23. Schematic diagram of “backfilling assay” between HbA1c and activated GOx.
HbA1c binds to boronic acid and activated GOx binds to the remaining amine on the
dendrimer monolayer (Song & Yoon, 2009).
Biosensors for Health, Environment and Biosecurity
314
Fig. 24. Electrochemical biosensing of HbA1c by using Dend-FPBA electrodes. (A) Cyclic
voltammograms of the backfilling assay between HbA1c and activated GOx at different
HbA1c concentrations in the presence of ferrocenemethanol (0.1mM)in electrolyte with
glucose (10mM)in 0.1MPBS (pH 7.2) at a 5mV/s sweep rate. A voltammogram before
glucose addition is also included for comparison. (B) Calibration curve from the resulting
backfilling assay as a function of target HbA1c concentration. Signal current levels were
masured at +400mV from the background-subtracted voltammograms for respective analyte
concentrations. The mean value from three independent analyses is shown at each
concentration with error bar indicating the standard deviation (Song & Yoon, 2009).
The HbA1c concentration was measured using the same procedure on 10 μL solutions
containing concentrations of 4-18 μg/ml HbA1c in PBS (pH 7.4) Fig. 26 shows a linear dose-
response over this concentration range. Sensor sensitivity and variation coefficient of ΔE
was reported to be 1.5087 mV μg
-1
ml and 24%. The change in response due to the addition
Electrochemical Biosensor for Glycated Hemoglobin (HbA1c)
315
of potential interferents such as immunoglobin G (100 μg/ml), α-fetoprotein (2.5 μg/ml)
and BSA (1%) was found to be less than 9.2%. It was also found that the ΔE of the
hemoglobin sensor decreased about 33.2% after storage at 4°C under dry conditions for 5
days in 100 μg/ml hemoglobin in PBS (pH 7.4). The same trend was observed for a HbA1c
sensor which showed a decrease in ΔE by about 35.1% after storage at 4°C under dry
conditions for 5 days in 8 μg/ml hemoglobin in PBS (pH 7.4). This change in response was
attributed to the slow deactivation of antibodies during storage. Although this sensor has a
short response time (less than 1 min) in comparison to other HbA1c biosensors and low
fabrication costs (in the case of batch produced electrode chips), its low stability and the
relatively high variability of its signal are problems requiring further improvement.
Fig. 25. Differential voltage response of the ISFET hemoglobin immunosensor to successive
injections of Hb solutions with concentrations of 60, 100, 120, 140, 160 and 180μg/ml in PBS
(pH 7.4). The coefficient of variation of the change of voltage response ΔE was 21% for
measurements with three independently prepared electrodes. Voltages were measured 60 s
after sample injection (Qu, Xia, Bian, Sun, & Han, 2009).
Fig. 26. Differential voltage response of the ISFET hemoglobin-A1c (HbA1c) immunosensor
to successive injections of 4, 8, 10, 12 and 15μg/ml HbA1c solution in PBS (pH 7.4). The
coefficient of variation for the change of voltage response ΔE was 24% for measurements
with three independently prepared electrodes. Reported voltages were taken 60 s after
HbA1c injection (Qu, Xia, Bian, Sun, & Han, 2009).
Biosensors for Health, Environment and Biosecurity
316
The same group further extended their approach by using SAMs (Xue, Bian, Tong, Sun,
Zhang, & Xia, 2011). They designed a micro-potentiometric immunosensor based on mixed
SAMs containing an array of gold nanospheres (instead of a PPy-AuNP layer) for HbA1c
measurement (Fig. 27). The surfaces of nano-gold particles and a gold electrode were both
modified by SAMs. This modification was done to address some of the problems associated
with the use of nanoparticles in immunosensor fabrication. It also plays a role as an
insulating film which is suitable for a FET, stabilizes covalent immobilization of antibodies
and can eliminate the nonspecific sites to prevent noise interferences. The two-layer
structure of SAMs with different chain lengths also helps reduce steric hindrance.
Fig. 27. Schematic diagram of electrode modification process and specific binding in diluted
blood sample (Xue, Bian, Tong, Sun, Zhang, & Xia, 2011).
The electrode surface was modified by combining AuNPs with a mixed thiol solution (10
mM of both 16- and 3- mercaptohexadecanoic acid in ethanol) to form a two-layer SAM on
AuNP followed by covalent immobilization on a gold electrode already modified with
mercaptoethylamine-SAM using NHS and EDC. Antibodies were immobilized on the
modified electrode using NHS and EDC as well. SEM images of the modified electrode
showed a more uniform distribution of AuNPs which was attributed to the presence of
SAMs. Electrochemical characterization of the modified electrode using CV and EIS
confirmed that the SAMs had an insulating effect by decreasing the oxidation/reduction
current and increasing the interfacial resistance. Also, the presence of AuNP increased the
electrode sensitivity about 2-fold by raising the surface area-to-volume ratio of the sensor
and making more sites available for antibody immobilization (Fig. 28A).
Measurements of hemoglobin and HbA1c content were conducted on 5 μL samples of
simulated blood solution. Hemoglobin with concentrations of 166.67-570 ng/ml and HbA1c
with concentrations of 1.67-170.5 ng/ml were analyzed. Figs. 28B and C indicate that linear
relations between reagent dose and the electrode response were obtained over the
concentration ranges from 166.67 to 570 ng/ml for hemoglobin and from 50 to 170.5 ng/ml
for HbA1c. Sensor sensitivity was also reported to be 40.42 μV/(ngmL
-1
) and 94.73
μV/(ngmL
-1
) for hemoglobin and HbA1c, respectively. Also, the relative standard deviation
of the measurements (RSD) was 5%. The good linearity of the results was attributed to the
Electrochemical Biosensor for Glycated Hemoglobin (HbA1c)
317
absence of significant interferences from bovine serum albumin, lysis solution, potassium
ions and chloride ions in the simulated blood sample as well as good biocompatibility of the
method and a stable combination with antibodies. In comparison with their previous
sensors based on mixed SAMs, the use of wrapped AuNP arrays increased the sensor
sensitivity from the order of μg/mL to ng/mL and lowered the standard deviation from
above 20% to 5%, while reaching a dilution factor of 150,000 times.
Fig. 28. Potential output of the immunosensor in a phosphate buffer solution of pH7.4 in the
presence of simulated blood samples containing different concentrations of HbA1c and
hemoglobin: (A) effect of HbA1c using two methods: (a) mixed SAM wrapped nano-spheres
method and (b) mixed SAM method); (B) response to HbA1c; (C) response to hemoglobin.
The results are the mean values of 3 measurements (Xue, Bian, Tong, Sun, Zhang, & Xia,
2011).
Biosensors for Health, Environment and Biosecurity
318
4. Conclusion
HbA1c point-of-care (POC) devices can potentially play an important role in diabetes
diagnosis and management. However, they suffer from problems of low accuracy and
reproducibility and so are not yet reliable enough to be recommended for clinical use at this
time. This chapter reviews the research that has been done in the past decade or so to
fabricate and improve the performance of HbA1c biosensors. A variety of approaches has
been adopted to fabricate these sensors, making it difficult to compare them. However,
based on the research to date, it appears that FV-based sensors require more steps for
sample preparation, making their application in POC devices less favourable. Sensors that
use label-free methods based on FET are less complicated for the user and require less time
for measurement of HbA1c levels, but improvement to their sensitivity and especially
reproducibility are needed in order to be accepted by clinicians and be suitable for
introduction to the commercial market. Consequently, considerable work is still needed for
the development of accurate, simple, reliable and cheap HbA1c biosensors.
5. Acknowledgment
Support for this research has been provided to two of the authors (PC and MP) by the
Natural Sciences and Engineering Research Council of Canada (NSERC) and to one of the
authors (PC) by the Canadian Foundation for Innovation (CFI) and the Canada Research
Chairs (CRC) Program.
6. References
Alexander, C., Andersson, H. S., Andersson, L. I., Ansell, R. J., Kirsch, N., Nicholls, I. A., et
al. (2006). Molecular imprinting science and technology: a survey of the literature
for the years up to and including 2003. JOURNAL OF MOLECULAR
RECOGNITION , Vol. 19, pp. 106–180
Berg, A. H., & Sacks, D. B. (2008). Haemoglobin A1c analysis in the management of patients
with diabetes: from chaos to harmony. Journal of Clinical Pathology , Vol. 61, pp. 983-
987
Chien, H C., & Chou, T C. (2010). Glassy Carbon Paste Electrodes for the Determination of
Fructosyl Valine. Electroanalysis , Vol. 22, No. 6, pp. 688 – 693
Chuang, S W., Rick, J., & Chou, T C. (2009). Electrochemical characterisation of a
conductive polymer molecularly imprinted with an Amadori compound. Biosensors
and Bioelectronics , Vol. 24, pp. 3170–3173
Fang, L., Li, W., Zhou, Y., & Liu, C C. (2009). A single-use, disposable iridium-modified
electrochemical biosensor for fructosyl valine for the glycoslated hemoglobin
detection. Sensors and Actuators B , Vol. 137, Vol. 235–238
Halámek, J., Wollenberger, U., Stöcklein, W. F., Warsinke, A., & Scheller, F. W. (2007). Signal
Amplification in Immunoassays Using Labeling via Boronic Acid Binding to the
Sugar Moiety of Immunoglobulin G: Proof of Concept for Glycated Hemoglobin.
Analytical Letters , Vol. 40, pp. 1434–1444
Halámek, J., Wollenberger, U., Stöcklein, W., & Scheller, F. (2007). Development of a
biosensor for glycated hemoglobin. Electrochimica Acta , Vol. 53, pp. 1127–1133
Electrochemical Biosensor for Glycated Hemoglobin (HbA1c)
319
Harris, M., & Zimmet, P. (1997). Classification of diabetes mellitus and other categories of glucose
intolerance (Second Ausg.). (K. Alberti, P. Zimmet, & R. Defronzo, Hrsg.)
Chichester: John Wiley and Sons Ltd.
Kost, G. J. (2002). 1. Goals, guidelines and principles for point-of-care testing. In Principles &
practice of point-of-care testing (S. 3–12). Lippincott Williams & Wilkins.
Lenters-Westra, E., & Slingerland, R. J. (2010). Six of eight hemoglobin A1c point-of-care
instruments do not meet the general accepted analytical performance criteria.
Clinical Chemistry , Vol. 56, pp. 44-52
Liu, S., Wollenberger, U., Katterle, M., & Scheller, F. W. (2006). Ferroceneboronic acid-based
amperometric biosensor for glycated hemoglobin. Sensors and Actuators B , Vol. 113,
pp. 623–629
Nathan, D. M. (2009). International Expert Committee Report on the Role of the A1C Assay
in the Diagnosis of Diabetes. DIABETES CARE , Vol. 32, No. 7, pp. 1327-1334
NGSP. (June 2010). Abgerufen am 9. 1 2010 von
Park, J Y., Chang, B Y., Nam, H., & Park, S M. (2008). Selective Electrochemical Sensing of
Glycated Hemoglobin (HbA1c) on Thiophene-3-Boronic Acid Self-Assembled
Monolayer Covered Gold Electrodes. Analytical Chemistry , Vol. 80, pp. 8035–8044
Pohanka, M., & Skládal, P. (2008). Electrochemical biosensors – principles and applications.
Journal of Applied Biomedicine , Vol. 6, pp. 57–64
Qu, L., Xia, S., Bian, C., Sun, J., & Han, J. (2009). A micro-potentiometric hemoglobin
immunosensor based on electropolymerized polypyrrole–gold nanoparticles
composite. Biosensors and Bioelectronics , vol. 24, pp. 3419–3424
Sode, K., Ohta, S., Yanai, Y., & Yamazaki, T. (2003). Construction of a molecular imprinting
catalyst using target analogue template and its application for an amperometric
fructosylamine sensor. Biosensors and Bioelectronics , Vol. 18, pp. 1485-1490
Sode, K., Takahashi, Y., Ohta, S., Tsugawa, W., & Yamazaki, T. (2001). A new concept for the
construction of an artificial dehydrogenase for fructosylamine compounds and its
application for an amperometric fructosylamine sensor. Analytica Chimica Acta ,
Vol. 435, 151–156
Son, S. U., Seo, J H., Choi, Y. H., & Lee, S. S. (2006). Fabrication of a disposable biochip for
measuring percent hemoglobin A1c (%HbA1c). Sensors and Actuators A , Vol. 130–
131, pp. 267–272
Song, S. Y., & Yoon, H. C. (2009). Boronic acid-modified thin film interface for specific
binding of glycated hemoglobin (HbA1c) and electrochemical biosensing. Sensors
and Actuators B , Vol. 140, pp. 233–239
Stöllner, D., Stöcklein, W., Scheller, F., & Warsinke, A. (2002). Membrane-immobilized
haptoglobin as affinity matrix for a hemoglobin-A1c immunosensor. Analytica
Chimica Acta , Vol. 470, pp. 111–119
Stöllner, D., Warsinke, A., Stöcklein, W., Dölling, R., & Scheller, F. (2001). Immunochemical
Determination of Hemoglobin-A1c Utilizing a Glycated Peptide as Hemoglobin-
A1c Analogon. BIOSENSOR Simposium. TÜBINGEN.
Tsugawa, W., Ishimura, F., Ogawa, K., & Sode, K. (2000). Developement of an Enzyme
Sensor Utilizing a Novel Fructosyl Amine Oxidase from a Marine Yeast.
Electrochemistry , Vol 68, No. 11, 869-871
Biosensors for Health, Environment and Biosecurity
320
Tsugawa, W., Ogawa, K., Ishimura, F., & Sode, K. (2001). Fructosyl Amine Sensing Based on
Prussian Blue Modified Enzyme Electrode. Electrochemistry , Vol 69, No. 12, pp.
973-975
Wang, J. (2006). Analytical Electrochemistry. United States of America: John Wiley & Sons, Inc.
Wang, J. (2008). Electrochemical Glucose Biosensors. Chemical Reviews , Vol. 108, No. 2, pp.
814-825
Xue, Q., Bian, C., Tong, J., Sun, J., Zhang, H., & Xia, S. (2011). A Micro Potentiometric
Immunosensor for Hemoglobin-A1c Level Detection Based on Mixed SAMs
Wrapped Nano-spheres Array. Biosensors and Bioelectronics , Vol. 26, pp. 2689–2693
14
Electrochemical Biosensors for Virus Detection
Adnane Abdelghani
National Institute of Applied Science and Technology, Charguia Cedex
Tunisia
1. Introduction
The rabies constitutes one of the most dangerous viruses causing many death cases every
year. Each year approximately 55,000 people die of rabies, with high percentage of children
[S et al., 2007; L et al., 2000; FX et al., 1994). High percentages (99%) of the registered cases
were in Asia and Africa. In order to fight this dangerous disease, many techniques are
usually used for diagnostic but are usually complex, time consuming, expensive, difficult to
implement, and this is a necessity for developing new detection process [N et al., 1993;
Crepin et al., 1998]. Avian Influenza Virus (AIV) infections are a major cause of mortality
and rapid identification of the virus has important clinical, economical and epidemiological
implications. The traditional methods for virus diagnostic are Enzyme Linked
Immunosorbent Assay (ELISA) and Reverse Transcriptase Polymerase Chain Reaction (RT-
PCR) which are time consuming and expensive. Biosensors can play an important role in
areas such as diagnostic of diseases, drug detection and food quality control. Biosensors are
devices with qualities quoted as rapidity, sensitivity and specificity [G et al., 2002; D et al.,
1999). Biacore based on Surface Plamson Resonance technique is effectively a successful
biosensor used for antigen-antibody interaction [J et al., 1999]. Others commercialized
biosensors such us glucometer was developed for self-monitoring of glucose in blood for
diabetes care.
In terms of the transduction techniques used, the three main classes of biosensors are
optical, electrochemical and piezoelectric. Out of the three, optical methods appear to be the
most sensitive, with surface plasmon resonance and waveguide based devices being the
technological spearhead. As for Electrochemical biosensors, they are cheaper than optical
ones. They can be amperometric or impedimetric, depending on whether they monitor a
current as a function of potential or the resulting sensor impedance as a function of
frequency. The advantage of impedimetric methods is that, unlike amperometry, they do
not need of enzymatic labels in order to detect. In this work, we use the high sensitive
impedance spectroscopy technique for biosensors applications. This technique is very
known to characterize the electrical properties of materials and their interfaces exposed to
electronically conducting electrodes [A et al., 2004; S et al., 2006; A et al., 2006]. It may be
used to investigate the dynamics of bound and mobile charges in the bulk or interfacial
regions of any kind of solid or liquid material: ionic semiconducting, mixed electronic-ionic
and dielectric. The biosensor is based on the immobilization of specific anti-rabies
polyclonal antibodies and specific anti-H
7
N
1
antibodies onto a functionalized gold electrode
with micrometer size. The affinity interaction of the antibody with the specific antigen can
Biosensors for Health, Environment and Biosecurity
322
be measured with a good reproductibility with impedance spectroscopy [M et al., 2008; M et
al., 2008]. The different steps of biosensor conception were characterized by Electrochemical
Impedance Spectroscopy (EIS). The obtained limit detection was better than those obtained
with the others traditional methods for clinical use. The non-specific interaction has been
tested with the Newcastle antigen virus.
2. Experimental set-up
2.1 Specific rabies antibody preparation
Rabies immunoglobulins were produced by horse immunization. The immunization was
carried out using human vaccine “RABIPUR” manufactured by “Chiron Behring Vaccines ″
in Ankleshwar (Gujarat), India. The horses were exposed to a series of injections to increase
vaccine amounts. The immunization period lasted for 105 days (M et al., 2008).
2.2 Specific rabbit antibody (anti-H
7
N
1
) preparation
Three male rabbits were injected sub-cutaneously with different doses of NobilisTM,
INFLUENZA H
7
N
1
vaccine in different periods (15 days, 30 days, 45 days, 65 days). For
each period, quantity of blood were analysed to study the kinetic of the rabbit vaccine
immuno-response. Hyper immuno serums has been collected and specific rabbit-polyclonal
antibodies (anti-H7N1) has been purified with affinity chromatography (M et al., 2008).
2.3 Antibody immobilization on gold electrode
The gold electrodes were cleaned with organic solvents (acetone and ethanol) and with
piranha solution (1:3 H
2
O
2
- concentrated H
2
SO
4
) for 1 min. After each treatment, the gold
substrates were rinsed with ethanol and dried under nitrogen flow. The pretreated
electrodes were immersed in 11-mercaptoundecanoic acid 1 mM in ethanol solution for 12 h
in order to form a self-assembled monolayer (SAM). The substrates were then rinsed with
ethanol in order to remove the unbonded thiols. To convert the terminal carboxylic groups
to an active NHS ester, the thiol-modified electrodes were treated with 0.4 mM EDC-0.1 mM
NHS for 1 h. After gold electrodes were rinsed with water and dryed under nitrogen, 20
µg/ml of Anti-Rabies IgG (respectively 5 µg/ml of Anti-H7N1) were dropped onto the
surface at 37 °C for one hour. The excess antibodies were removed by rinsing with PBS.
Then, the antibody-modified electrodes were treated with 0.1% BSA for 30 min, to block the
unreacted and non-specific sites. After rinsing with PBS and water, the electrodes were
dried under nitrogen (Figure.1).
2.4 Impedance spectroscopy
Many reports show that impedance spectroscopy is a useful tool to characterize self
assembled monolayer on surfaces (A et al., 2004). A capacitor is formed between the
conducting electrode and the electrolyte. The absolute impedance is related to the frequency
by the equation:
1
2
Z
f
C
π
= (1)
where f is the frequency (in Hz) at which Z is measured.
Electrochemical Biosensors for Virus Detection
323
The complex impedance can be presented as a combination of the real impedance (Z
re
) and
imaginary impedance (Z
im
), Nyquist plot. To fit the measured spectra with the impedance
spectra out of ideal elements, the ideal elements have been replaced with the constant phase
elements (CPE):
K
Z
CPE
α
ω
−
=
(2)
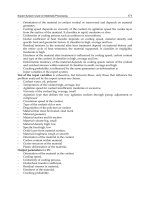
Fig. 1. Biosensor multilayer configuration
The frequency exponent is α = 1 and K = 1/C for an ideal capacitance, and α = 0 and K = R
for an ideal resistance, respectively. The exponent α could be obtained, when the membrane
capacitance (or layer capacitance) was replaced by a constant phase element Z
CPE
. The
deviation of the exponent α from the ideal values is attributed to the inhomogeneities of the
analyzed layer, like defects or roughness. The measured spectra of the impedance were
analyzed in terms of electrical equivalent circuits using a analysis program. The
mathematical expressions of the equivalent circuit models were fitted to the data. The
electric parameters of the system were calculated with the computer program and the fit
error was kept under a maximum of 10%. The impedance analysis was performed with the
Voltalab 40 impedance analyser in the frequency range 0.05 Hz - 100 kHz, using a
modulation voltage of 10 mV. Three-electrode system was employed with a saturated
calomel electrode (SCE), an immunosensor working electrode (0.19 cm
2
), and a platinum
strip counter electrode (0.385 cm
2
). The impedance measurements were performed in the
presence of a 5 mM K
3
[Fe(CN)
6
]/ K
4
[Fe(CN)
6
] (1:1) mixture as redox probe in PBS. The
measured spectra of the impedance and phase were analysed in terms of electrical
equivalent circuit model using a Zview modelling programme (Scribrer and associates,
Charlottesville, VA). All electrochemical measurements were carried out at room
temperature and in a faraday cage. More details on electrochemical impedance spectroscopy
can be found in reference (A et al., 2004; M et al., 2008).
Gold electrode
virus
antibody
thiol
BSA
Biosensors for Health, Environment and Biosecurity
324
3. Results and discussions
3.1 Avian influenza virus biosensor
First, we study the variation of the impedance spectra (the real part, it means the charge
transfer resistance) of the functionalized gold electrode with different concentration of
immobilised antibody. This allows us to know the saturation concentration of the antibody
on our gold electrode, which will leads to the high sensitivity detection. Figure.2 shows the
impedance spectra of the functionnalized gold electrode after the immobilisation of
antibody with different concentration.
Fig. 2. Impedance spectra of the functionalized gold electrode after the immobilisation of
different antibody concentration
The impedance spectra can be fitted with computer simulated program using the electric
circuit shown in figure 3. This equivalent circuit includes the ohmic resistance of the
electrolyte solution R
0
, the constant phase element Z
CPE
and electron transfer resistance R
1
.
An excellent fitting between the simulated and experimental spectra was obtained for each
antibody concentration. Figure4 shows the variation of the impedance versus the antibody
concentration. We can see that the surface saturation can be obtained with 60μg/ml
antibody concentration. For specific and non specific antigen detection, we will use this
antibody concentration
3.1.1 Virus detection
Figure 5 show the impedance spectra of the functionalized gold electrode recorded at 0 V in
PBS buffer at pH=7.2 in the range of 50 mHz to 100 KHz before and after addition of
different H
7
N
1
antigen concentration.
Electrochemical Biosensors for Virus Detection
325
R0
Z
CPE
R1
Fig. 3. Electric model
Fig. 4. Impedance spectra of the functionalized gold electrode after the immobilisation of
different antibody concentration
Biosensors for Health, Environment and Biosecurity
326
The interface can be modelized with the electric model shown in figure3. An excellent fitting
between the simulated and experimental spectra was obtained.
Fig. 5. Impedance spectra of the functionalized gold electrode before and after addition of
different H
7
N
1
antigen concentration.
The charge transfer resistance increases and reaches a new saturation value that can be
determined with the fitting program. This increase could be attributed to a rearrangement in
the structure of the antibody and a variation of the dielectric constant. The lowest detection
limit that induces a signal variation is equal to 5 μg/ml . This value was lower than the limit
detection obtained with ELISA technique.
3.1.2 Calibration and selectivity
In order to obtain the calibration data set, the values of log Z/Z
o
versus the antigen H
7
N
1
concentration were plotted in figure 6 , where Z is the value of the impedance resistance
after antigen binding to antibody, Z
0
is the value of impedance as antibody immobilized on
the electrode.
As we can be see in the figure6, the plot is linear and saturate at the higher concentration. To
confirm that the above-observed impedance changes generated from the result of specific
antibody-antigen interaction, the sensor was exposed to the solution of Newcastle antigen
that are expected to bind non-specifically. Figure 6 shows the variation of the impedance
Electrochemical Biosensors for Virus Detection
327
versus the non-specific antigen concentration. As we can see, the sensor was not subjected to
the non-specific binding and applicable to the selective determination of H
7
N
1
.
Fig. 6. Calibration curves and selectivity of the developed biosensor.
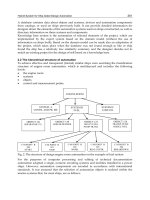
3.2 Rabbies virus biosensor
We start to characterise the insulating properties of the thiol monolayer on gold surface. The
Nyquist diagram of bare gold (fig.7) presents a half-circle, characteristic of a resistance in
parallel with a capacity and a linear part which appears at low frequencies and which is
assigned to diffusion phenomenon [17]. However, after acid thiol treatment, the diameter of
the half-circle of Nyquist diagram increases clearly and the Warburg impedance was not
observed. This is shows the high insulating properties of the acid thiol (M et al., 2008).
After, impedance measurements were performed after gold surface activation with
EDC/NHS, antibody immobilization and BSA blocking step. After each step, acquisitions
of impedance data in PBS were carried out over 5 decades of frequency. Figure 8 presents
the Nyquist diagram for the various steps of the biosensor development: SAM layer,
antibody layer, blocking with BSA and antigen injection.
We observe that each layer deposition on the gold surface generates an impedance increase.
This increase is due to the change of the electric properties of the gold/electrolyte interface.
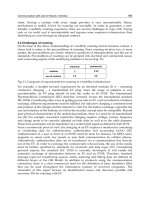
3.2.1 Calibration and selectivity
For rabbies detection, Figure 9 presents the calibration of the developed biosensors for
specific and non-specific detection. It shows a dynamic range between 0.1 µg/ml and 4
Biosensors for Health, Environment and Biosecurity
328
µg/ml and a saturation reached at 4 µg/ml. This behaviour can be explained: when the
antigen concentration increases in the electrochemical cell, the number of immobilized
antibodies, but not complexed, decreases and reaches zero when concentration of antigen is
higher than 4 µg/ml. The limit detection of this sensor is about 0.5 µg/ml. This limit
detection is better than the limit detection obtained with the others traditional methods for
clinical use. In order to prove sensor selectivity, the immunosensor was exposed to a
solution containing the Newcastle antigen viruses.
Fig. 7. Nyquist plot for bare gold (small curve) and gold with thiol acid (big curve) in PBS
solution with 1 mM redox couple
As shown in figure 9, there is a little variation of impedance after no-specific antigen
addition. This little non specific variation can be explained by the use of polyclonal
antibodies. In order to avoid non specificity, the use of monoclonal immunoglobulins G
(IgGs) is necessary.
4. Conclusion
In this study, we reported the development of biosensor for rabies and for H
7
N
1
antigen
detection. The affinity interaction of the antibody with specific antigen can be measured
with detection limit of 0.5 and 5 µg/ml respectively. The impedance spectroscopy technique
is a higher sensitive technique which can be used to measure the high insulating properties
of biomembranes. The different steps of biosensor conception were characterized by
0 10203040506070
0
5
10
15
20
25
30
35
0 2 4 6 8 10121416
0
2
4
6
8
10
12
14
-Zim[
ΚΩ
.cm
2
]
Zre[ΚΩ.cm
2
]
Bare Gold
-Zim[
ΚΩ
.cm
2
]
Zre[
ΚΩ
.cm
2
]
gold with thiol acid
Electrochemical Biosensors for Virus Detection
329
Fig. 8. Nyquist plot of the different layers of the rabies biosensors
Fig. 9. Selectivity of the developed biosensor.
electrochemical impedance spectroscopy. The sensitivity of miniaturized biosensor
prototype will be improved by using interdigitated gold microelectrodes with microfluidic
cell for industrial development and clinical use.
5. Acknowledgements
The authors thank the NATO through collaborative Linkage Grant CBP.MD. CLG 982802.
and the Alexander Von Humboldt Stiftung (Germany) for the material donation.
0 20 40 60 80 100 120 140 160 180 200 220 240 260 280
0
10
20
30
40
50
60
70
80
90
100
-Zim[
ΚΩ
.cm
2
]
Zre[
ΚΩ
.cm
2
]
Thiol acide
NHS-EDC
Ac
BSA 0.1%
01234567891011
0
100
200
300
400
500
600
700
800
900
1000
1100
1200
1300
1400
ΔΖ(Ω.
cm
2
)
Antigen concentration (µg/ml)
No specific detection
Specific detection
Biosensors for Health, Environment and Biosecurity
330
6. References
[1] S, E. Sloan.; C, Hanlon.; W. Weldon.; M, Niezgoda.; J, Blanton. (2007). Identification and
characterization of a human monoclonal antibody that potently neutralizes a broad
panel of rabies virus isolates. Vaccine, Vol.25, pp. 2800-2810.
[2] L, Martinez.; Global infectious disease surveillance.(2000). International Journal
Infections Diseases ;Vol. 4, N0. 222, pp. 10-28.
[3] FX, Meslin.; DB, Fishbein. (1994). Rationale and prospects for rabies elimination in
developing countries. Current Trop Microbiology Immunology, Vol.187, pp. 1-26.
[4] World Health Organization. (2002). Rabies vaccines Weekly epidemiological record. Vol.
14, N0. 77, pp. 109-11.
[5] N, Kamolvarin.; T. Tirawatnpong.; R, Rattanasiwamoke.; S, Tirawatnpong.; T,
Panpanich.; and T. Hemachudha. (1993). Diagnosis of rabies by polymerase chain
reaction with nested primers. Journal of Infections Diseases, Vol. 167, pp.207-210.
[6] Crepin, P.; L. Audry.; Y. Rotivel.; A. Gacoin.; C. Caroff.; and H. Bourhy. (1998).
Intravitam diagnosis of human rabies by PCR using saliva and cerebrospinal fluid.
Journal Clinical Microbiology. Vol, 36, pp. 1117-1121.
[7] Perrin, P.; and P,. Sureau. (1987). A collaborative study of an experimental kit for rapid
rabies enzyme immunodiagnosis (RREID). Bull World Health Organization.pp.489-
493.
[8] A, Ermine.;. N, Tordo.; and H, Tsiang. (1998). Rapid diagnosis of rabies infection by
means of a dot hybridization assay. Molecular Cell Probes, Vol.2, pp. 75-82.
[9] G, A.Rand.; J, Ye.; C.W, Brown.; S.V, Letcher. (2002). Optical biosensors for food
pathogen detection. Food Technology, Vol. 56 , pp.32–37.
[10] D, Ivnitski.; I.A, Hamid.; P, Atanasov.; E, Wilkins. (1999). Biosensors for detection of
pathogenic bacteria. Biosensors and Bioelectronics, Vol. 14 , pp. 599–624.
[11] J, Homola.; S.S, Yee. ; G, Gauglitz. (1999). Surface plasmon resonance sensors. Sensors
and Actuators B, Vol. 54 , pp. 3–15.
[12] A, Tlili.;
S, Hleli.; A, Abdelghani.; M.A, Maaref
. (2004). Electrical Characterization of a
Thiol SAM on Gold as a First Step of the Fabrication of an Immunosensors based
on a Quartz Crystal Microbalance. Sensors, Vol.4, pp. 104-114.
[13] S, Hleli.; C, Martelet.; A, Abdelghani.; N, Jaffrezic-Renault. (2006). Atrazine analysis
using impedimetric immunosensors based on mixed biotinylated self-assembled
monolayer. Sensors and Actuators B, Vol.113 , pp. 711–717.
[14] A, Abdelghani.; K, Cherif.; M, Maaref. (2006). Impedance Spectroscopy on Xerogel Layer
for Chemical Sensing. Materials Science and Engineering C, Vol. 26, pp. 542 – 545.
[15] A, Tlili.; A, Abdelghani.; S, Ameur.; N, Jaffrezic-Renault. (2006). Impedance
spectroscopy and affinity measurement of specific antibody-antigen interaction.
Materials Science and Engineering C, Vol. 26, pp. 546 – 550.
[16] M, Hnaien.; S, Hleli.; M, Diouani.; I, Hafaid.; W, Hassen.; N, Jaffrezic- Renault.; A,
Abdelghani. (2008). Immobilisation of Specific Antibody on SAM Functionalized
Gold Electrode for Rabies Virus Detection by Electrochemical Impedance
Spectroscopy. Biochemical Engineering Journal, Vol. 39, N0. 3, pp. 443-449.
[17] M, .Diouani.; S, Hleli.; I, Hafaid.; A, Snousi.; A,Ghram.; A,Abdelghani. (2008).
Immobilisation of Specific Antibody on Functionnalised Gold Microelectrode for
Avian Influenza Virus H7N1 Detection. Materials Science and Engineering C, Vol.
28, N0. 5-6 , pp. 580-583.