Applications of High Tc Superconductivity Part 12 pot
Bạn đang xem bản rút gọn của tài liệu. Xem và tải ngay bản đầy đủ của tài liệu tại đây (4.25 MB, 20 trang )
Superconducting Properties of Graphene Doped Magnesium Diboride
209
Fig. 6. Compared to the increment of magnetic J
cm
at 5K and transport J
ct
at 4.2K
superconducting crystals, and fraction of impurities as the main secondary phase by
different fabricated processing
(
Horvat, J. et al., 2008). It is clearly that the graphene doped
bulk sample via the diffusion process had the highest mass density, which improved the
most inter-grain connectivity to improve the J
c
so much. At the same time, according to the
Rowell connectivity analysis, the calculated active cross-sectional area fraction (A
F
)
represents the connectivity factor between adjacent grains, which is estimated by comparing
the measured value with that of a single crystal. (Rowell, J. M., 2003). The A
F
for all wire
samples via the powder-in-tube (PIT) method is almost half of the bulk sample via diffusion
process. With the wire doped samples, the A
F
value was increased as the sintering
temperature increased. This indicates that additional grain growth occurs due to high
temperature sintering. The larger grains are also accompanied by improved density and
grain connectivity. So, in order to improve the J
c
of the wire sample, the key point is how to
improve the inter-grain connectivity.
2.3.3 Flux pinning mechanism
Regarding the flux pinning mechanism, it is established that the core interaction, which
stands for the coupling of the locally distorted superconducting properties with the periodic
variation of the superconducting order parameter is dominant over the magnetic interaction
for MgB
2
due to its large GL coefficient κ (~26 in MgB
2
) . The core interaction includes two
types of mechanism: δTc and δl pinning. The δTc pinning refers to the spatial variation of
the GL coefficient associated with disorder due to variation in the transition temperature T
c
,
while δl pinning is associated with the variation in the charge-carrier mean free path l near
lattice defects . According to the collective pinning model, the disorder induced spatial
fluctuations in the vortex lattice can be clearly divided into different regimes depending on
the strength of the applied field: single-vortex, small-bundle, large-bundle, and charge-
density-wave (CDW)-type relaxation of the vortex lattice. The crossover field, B
sb
is defined
as a field separating single vortex regime into small bundles of vortices. Below B
sb
, J
c
is
almost field independent. The B
sb
as a function of reduced temperature (t=T/T
c
) is described
by the equation (Qin, M. J. et al, 2002):
Applications of High-Tc Superconductivity
210
2/3
2
2
1
(0)
1
sb sb
t
BB
t
(1)
for δT
c
pinning,
2
2
2
1
(0)
1
sb sb
t
BB
t
(2)
for δl pinning.
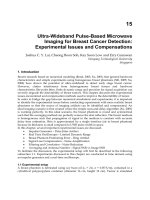
To define the pinning mechanism in our grapheme doped the samples, the crossover field,
B
sb,
as a function of temperature with graphene doped sample (G037) is plotted in Figure 7
as red squares. B
sb
is defined as a field where J
c
drops by 5% only compared to J
c
at zero
field. It can be seen that the curve for δT
c
pinning calculated from q. (1) is in a good
agreement with the experimental data, whereas, the curve for δl pinning according to Eq. (2)
does not fit to the experimental data. For polycrystalline, thin film, and single crystalline
MgB
2
samples, it has been found that the dominant pinning mechanism is δT
c
pinning,
which is related to spatial fluctuation of the transition temperature while most C-doped
MgB
2
samples displayed δl pinning mechanism (Wang, J. L. et al., 2008) as a result of strong
scattering and hence the shortening of the mean free path l owing to the presence of large
amount of impurities in the doped samples. This is reflected by the significant increase in
the residual resistivity. The local strain was suggested to be one of potential pinning centres.
Fig. 7. The crossover field B
sb
as a function of temperature with graphene doped sample
(G037) (Xu, X. et al., 2010)
However, we do not have strong evidence that the dominant pinning in the graphene doped
MgB2 is due to the local strain effect alone. In contrast, the graphene doping sets an
exceptional example, following the δT
c
pinning rather than δl pinning mechanism. This
demonstrates the unique feature of the graphene doping. The amorphous phases can also
Superconducting Properties of Graphene Doped Magnesium Diboride
211
act pinning centres, which is in favour for δT
c
pinning. Although the graphene doped
samples have a lot of defects these samples contain low concentration of impurities
compared to the samples by other forms of carbon dopants. One of major differences of
graphene doping from other dopants is that the samples are relatively pure as evidenced by
the low resistivity (20 µΩ cm) in the grapheme doped samples. Normally, the resistivity in
carbon doped MgB
2
ranges from 60 µΩ cm to as high as 300 µΩ cm. The high electrical
connectivity is beneficial for J
c
in low magnetic fields and high field performance; however
we can not find any correlation between electrical connectivity with the J
c
in the case here.
The graphene doped samples have higher resistivity than the un-doped MgB
2
sample (3 µΩ
cm), indicating electron scattering caused by graphene doping levels. But, it should be
pointed out that the increase in resistivity is much smaller than for any other forms of
carbon doped MgB
2,
Which is shown in Figure 8.
2.3.3 E
2g
mode and Raman peak shift
Tensile strain effects on superconducting transition temperature (T
c
) was observed in
graphene-MgB
2
alloys to pursue high T
c
in multi-gap superconductors. The enhancement of
energy gap for π-band indicates the weak rescale of density of state on Fermi surface. The
E
2g
mode split into two parts: one dominant soften mode responding to tensile strain and
another harden mode responding to carbon substitution effects.
Fig. 8. The temperature dependence of the resistivity (ρ) measured in different fields for
doped and undoped samples.
The existence of soften E
2g
mode in bulk samples suggests that modified graphene-MgB
2
alloys are the potential candidates for the high performance superconducting devices.
To confirm the effect of tensile strain on EPC, Raman scattering was employed for
measurement of phonon properties by a confocal laser Raman spectrometer (Renishaw
inVia plus) with a 100× microscope. The 514.5 nm line of an Ar
+
laser was used for excitation
and several spots were selected on the same sample to collect the Raman signals to make
sure that the results were credible. Fig. 9(a) shows the typical spectrum of pure MgB
2
consisting of three broad peaks. The most prominent phonon peak located at lower
frequency (ω
2
: centered at ~600 cm
-1
) is assigned to the E
2g
mode. The other two Raman
bands (ω
1
: centered at 400 cm
-1
and ω
4
: centered at 730 cm
-1
) have also been observed earlier
Applications of High-Tc Superconductivity
212
in MgB
2
and attributed to phonon density of states (PDOS) due to disorder. The EPC
strength in MgB
2
depends greatly on the characteristic of E
2g
mode, both frequency and
FWHM, while the other two modes, especially the ω
4
mode, are responsible for the T
c
depression in chemically doped MgB
2
(Kunc, K. et al, 2001). The graphene addition in MgB
2
induces splitting of E
2g
mode: one soften mode (ω
2
) and another harden mode (ω
3
), as shown
in Fig. 9. ω
2
shifts to low frequency quickly with the graphene addition because of the strong
tensile strain. The softness of E
2g
mode was observed only in MgB
2
–SiC thin films due to
tensile strain-induced bond-stretching, which resulted in a T
c
as high as 41.8 K. Although ω
2
modes are dominant in low graphene content samples, T
c
drops slightly. This is in
agreement with the energy gap behaviors because of the carbon substitution induced band
filling and interband scattering. ω
2
is marginal in G10 and vanishes in G20. ω
3
shifts to high
frequency slowly in low graphene content samples because the tensile strain has confined
the lattice shrinkage. However, the tensile strain can not counteract the intensive carbon
substitution effects when the graphene content is higher than 10 wt% and ω
3
takes the place
of ω
2
. It should be noted that ω
3
is not as dominant as ω
2
in pure MgB
2
and ω
4
is the strongest
peak as in the other carbonaceous chemical doped MgB
2
due to lattice distortion.
Furthermore, another peak ω
5
has to be considered in G10 and G20 to fit the spectra
reasonably. The Raman spectrum of G20 was separated from the mixed spectra of MgB
2
and
MgB
2
C
2
based on their different scattering shapes: MgB
2
shows broaden and dispersed
waves, while MgB
2
C
2
shows sharp peaks (Li, W. X. et al., 2008).
Fig. 9. The the typical spectrum of MgB
2
consisting of three broad peaks
The tensile strain was unambiguously detected in graphene-MgB
2
alloys made by diffusion
process and the π energy gap was broadening with the graphene addition. The bond-
stretching E
2g
phonon mode splits into one soften mode due to the tensile strain and another
harden mode due to the carbon substitution on boron sites. Although E
2g
mode splitting
have been observed in C doped MgB
2
, both the two peaks shift to higher frequency and this
is the first time to observe the coexistence of two modes shifting to opposite directions. The
T
c
value does not show enhancement because of impurity scattering effects and carbon
substitution. However, higher T
c
values are expected in graphene-MgB
2
alloys processed by
proper techniques or made of stabilized graphene.
Superconducting Properties of Graphene Doped Magnesium Diboride
213
2.3.4 Upper critical field and irreversibility field
Figure 10 shows the upper critical field, H
c2
, and the irreversibility field, H
irr
, versus the
normalised T
c
for all the samples. It is noted that both H
c2
and H
irr
are increased by graphene
doping. The mechanism for enhancement of J
c
, H
irr
, and H
c2
by carbon containing dopants
has been well studied. The C can enter the MgB
2
structure by substituting into B sites, and
thus J
c
and H
c2
are significantly enhanced due to the increased impurity scattering in the
two-band MgB
2
(Gurevich, A.,2003). Above all, C substitution induces highly localised
fluctuations in the structure and T
c
, which
have also been seen to be responsible for the
enhancements in J
c
, H
irr
, and H
c2
by SiC doping.
Fig. 10. Upper critical field, H
c2
, and irreversibility field, H
irr
, versus normalised transition
temperature, T
c
, for all graphenedoped and undoped MgB
2
samples (Xu, X. et al., 2010).
Furthermore, residual thermal strain in the MgB
2
-dopant composites can also contribute to
the improvement in flux pinning (Zeng, R. et al. 2009). In the present work, the C
substitution for B (up to 3.7 at.%) graphene doping is lower, from the table 1, the change of
the a-parameter is smaller, according to Avdeev et al result (Avdeev, M. et al., 2003), the
level of C substitution, x in the formula Mg(B
1-x
C
x
) , can be estimated as x=7.5 × Δ(c/a),
where Δ(c/a) is the change in c/a compared to a pure sample. As both the a-axis and the c-
axis lattice parameters determined from the XRD data showed little change within this
doping range the level of carbon substitution is low at this doping level. This is in good
agreement with the small reduction in T
c
over this doping regime. At 8.7 at% doping, there
is a noticeable drop in the a-axis parameter, suggesting C substitution for B, which is also
consistent with the reduction in T
c
. The source of C could be the edges of the graphene
sheets, although the graphene is very stable at the sintering temperature (850
o
C), as there
have been reports of graphene formation on substrates at temperatures ranging from 870-
1320
o
C (Coraux, J. et al., 2009). The significant enhancement in J
c
and H
irr
for G037 can not
be explained by C substitution only.
2.3.5 Microstructure by TEM
The microstructure revealed by high resolution transmission electron microscope (TEM)
observations show that G037 sample has grain size of 100-200 nm which is consistent with
Applications of High-Tc Superconductivity
214
value of the calculated grain size in table 1. The graphene doped samples have relatively
higher density of defects compared with the undoped sample as shown in the TEM images
of figure 11(a) and (c). The density of such defects is estimated to be 1/3 areas of TEM
images, indicating high density in the doped samples. In figures 11(b) it should be noted
that the order of fringes varies from grain to grain, indicates that the defect is due to highly
anisotropic of the interface.
Fig. 11. (a) TEM image showing the defects with grains of the G037 sample with order of
fringes varies between grains. Defects and fringes are indicated by arrow, and (b) HRTEM
image of fringes. TEM images show large amount of defects and fringes can be observed in
the graphene doped sample G037. (c) TEM image of the undoped sample for reference (Xu,
X. et al., 2010).
Superconducting Properties of Graphene Doped Magnesium Diboride
215
Similar fringes have been reported in the MgB
2
(Zeng, R. et al. 2009),where these fringes
were induced by tensile stress with dislocations and distortions which were commonly
observed in the areas. As the graphene doped samples were sintered at 850
o
C for 10 hrs, the
samples are expected to be relatively crystalline and contain few defects. Furthermore, as
already shown above the C substitution level is low in graphene doped samples. Thus, the
large amount of defects and amorphous phases on the nanoscale can be attributed to the
residual thermal strain between the graphene and the MgB
2
after cooling because the
thermal expansion coefficient of graphene is very small while that for MgB
2
is very large
and highly anisotropic. The large thermal strain can create a large stress field, and hence
structure defects and lattice distortion. These defects and distortions on the order of the
coherence length, , can play a role as effective pinning centres that are responsible for the
enhanced flux pinning and J
c
in the graphene doped MgB
2
. The thermal strain-induced
enhancement of flux pinning has also been observed in the SiC-MgB
2
composite as there is s
noticeable difference in thermal expansion coefficient between MgB
2
and SiC (Coraux, J. et
al., 2009).
3. Conclusion
In conclusion, the effects of graphene doping on the lattice parameters, T
c
, J
c
, and flux
pinning in MgB
2
were investigated over a range of doping levels. By controlling the
processing parameters, an optimised J
c
(B) performance is achieved at a doping level of 3.7
at.%. Under these conditions, J
c
was enhanced by an order of magnitude at 8 T and 5 K
while T
c
was only slightly decreased. The strong enhancement in the flux pinning is argued
to be attributable to a combination of C substitution for B and thermal strain-induced
defects. Also, the evidence from collective pinning model suggests the δT
c
pinning
mechanism rather than the δl pinning for the graphene doped MgB
2
, contrary to most doped
MgB
2
. The strong enhancement of J
c
, H
c2
, and H
irr
with low levels of graphene doping is
promising for large-scale MgB
2
wire applications.
Tensile strain effects on superconducting transition temperature (T
c
) was observed in
graphene-MgB
2
alloys to pursue high T
c
in multi-gap superconductors. The enhancement of
energy gap for π-band indicates the weak rescale of density of state on Fermi surface. The
E
2g
mode split into two parts: one dominant soften mode responding to tensile strain and
another harden mode responding to carbon substitution effects. The existence of soften E
2g
mode in bulk samples suggests that modified graphene-MgB
2
alloys are the potential
candidates for the high performance superconducting devices.
The effects of graphene doping in MgB
2
/Fe wires were also investigated. At 4.2K and 10T,
the transport J
c
was estimated to be for the wire sintered at 800
o
C for 30 minutes, the doped
sample is almost improved as one order, compared with the best un-doped wire sample.
The strong enchantment of the temperature dependence of the upper critical field (H
c2
) and
the irreversibility field (H
irr
) is found from the resistance (R) – temperature (T). But the
calculated active cross-sectional area fraction (A
F
) represents the connectivity factor between
adjacent grains is lower, which is the main factor to improve transport J
c
in limitation. It
should mention that in recently research activity, two groups can improve the mass density
and the grain connectivity very well. One is the internal Mg diffusion processed (IMD)
multi-filamentary wire, which is developed by Togano (Hur, J. M. et al., 2008). The other
one is the cold high pressure densification (CHPD) in-situ MgB
2
wire by Flukiger
18
. If can
Applications of High-Tc Superconductivity
216
combine these methods with the graphene doping, the strong enhancement of J
c
, H
c2
, and
H
irr
with low levels of graphene doping is promising for large-scale MgB
2
wire in industrial
applications.
4. Acknowledgment
We acknowledge support from the ARC (Australia Research Council) Project (DP0770205,
LP100100440). The author would like to thank Dr. T. Silver for her helpful discussions. This
work was supported by Hyper Tech Research Inc., OH, USA, and the University of
Wollongong.
5. References
Novoselov, K. S. et al. (2004). Electric field effect in atomically thin carbon films. Science,
Vol.306, pp. 666–669, ISSN 0036-8075
Stankovich, S. et al. (2006). Graphene-based composite materials. Nature, Vol. 442, pp. 282–
286, ISSN 0028-0836
Dou, S. X. et al. (2007). Mechanism of enhancement of electromagnetic properties of MgB
2
by
nano-SiC doping. Phys. Rev. Lett., Vol 98, pp. 097002-1, ISSN 0031-9007
Ma, Y. et al. (2006). Significantly enhanced critical current densities in MgB
2
tapes made by a
scalable nanocarbon addition route. Appl. Phys. Lett., Vol 88, pp. 072502-5, ISSN
0003-6951
Senlowocz, B. J. et al. (2005). Improved upper critical field in bulk-form magnesium diboride
by mechanical alloying with carbon. Appl. Phys. Lett., Vol 86, pp. 202502-5, ISSN
0003-6951
Kumakura, H. et al. (2004). Upper critical fields of powder-in-tube-processed MgB
2
/Fe tape
conductors. Appl. Phys. Lett., Vol 84, pp. 3669-71, ISSN 0003-6951
Sumption, M. et al. (2005). Large upper critical field and irreversibility field in MgB
2
wires
with SiC additions. Appl. Phys. Lett., Vol 86, pp. 092507-10 ISSN 0003-6951
Dou, S. X. et al. (2003). Effect of carbon nanotube doping on critical current density of MgB
2
superconductor. Appl. Phys. Lett., Vol 83, pp. 4996-9 ISSN 0003-6951
Kim, J. H. et al. (2006). Carbohydrate doping to enhance electromagnetic properties of MgB
2
superconductors. Appl. Phys. Lett., Vol. 89, pp. 142505 -8 ISSN 0003-6951
Wilke, R. H. T. et al. (2008). Systematic effects of carbon doping on the superconducting
properties of Mg(B
1-x
C
x
)
2
. Phys. Rev. Lett., Vol 92, pp. 062001 ISSN 0003-6951
Tung, V. C. et al. (2009). High-throughput solution processing of large-scale graphene.
Nature Nanotech., Vol 4, pp. 25-29, ISSN 1748-3387
Kim, K. S. et al. (2009). Large-scale pattern growth of graphene films for stretchable
transparent electrodes. Nature , Vol 457, pp. 706-710, ISSN 0028-0836
Hernandez, Y. et al. (2008). High-yield production of graphene by liquid-phase exfoliation
of graphite. Nature Nanotech. ,Vol 3, pp. 563–568, ISSN 1748-3387
Li, D. et al. (2008). Processable aqueous dispersions of graphene nanosheets. Nature
Nanotech. ,Vol 3, pp. 101–105, ISSN 1748-3387
Li, X. et al. (2008). Chemically derived, ultrasmooth graphene nanoribbon semiconductors.
Science Vol 319, pp. 1229–1232 ISSN 0036-8075
Superconducting Properties of Graphene Doped Magnesium Diboride
217
Choucair, M. Thordarson, P. and Stride, J. A. Gram-scale. (2009). Production of graphene
based on solvothermal synthesis and sonication. Nature Nanotech. , Vol 4, pp. 30-33,
ISSN 1748-3387
Nagamatsu, J. et al. (2001). Superconductivity at 39 K in magnesium diboride. Nature, Vol
410, No.6824, pp. 63-64, ISSN 0028-0836
Kunc, K. et al. (2001). MgB
2
under pressure: phonon calculations, Raman spectroscopy, and
optical reflectance. Journal of Physics -Condensed Matter, Vol 13, No.44, pp. 9945-
9962, ISSN 0953-8984
Soltanian, S. et al. (2005). High transport critical current density and large H
c2
and H
irr
in
nanoscale SiC doped MgB
2
wires sintered at low temperature. Superconductor
Science & Technology, Vol 18, No.5, pp. 658-666, ISSN 0953-2048
Yamamoto, A. et al. (2005). Universal relationship between crystallinity and irreversibility
field of MgB
2
. Appl. Phys. Lett., Vol 86, No.21 pp. 212502-5 ISSN 0003-6951
Dou, S. X. et al. (2002). Enhancement of the critical current density and flux pinning of MgB
2
superconductor by nanoparticle SiC doping. Appl. Phys. Lett., Vol 81, No. 18, pp.
3419-3421, ISSN 0953-2048
Yeoh, W. K. et al. (2006). Control of nano carbon substitution for enhancing the critical
current density in MgB
2
. Superconductor Science & Technology, Vol 19, No.6, pp. 596-
599, ISSN 0953-2048
Kim, J. H. et al. (2008). Correlation between doping induced disorder and superconducting
properties in carbohydrate doped MgB
2
. Journal of Applied Physics, Vol 104, No. 6,
pp. 063911-6, ISSN 0021-8979
Dikin, D. A. et al. (2007). Preparation and characterization of graphene oxide paper. Nature
Vol 448, pp. 457–460, ISSN 0028-0836
Xu, X. et al. (2010). Graphene doping to enhance the flux pinning and supercurrent carrying
ability of a magnesium diboride auperconductor. Superconductor Science &
Technology, Vol 23, pp. 085003-7, ISSN 0953-2048
Williamson, G. K., and Hall, W. H. (1953). X-ray line broadening from filed Aluminium and
Wolfram. Acta Metall. Vol 1, pp. 22-31, ISSN 0001-6160
Horvat, J. et al. (2008).
Transport and magnetic critical current in superconducting MgB
2
wires. Superconductor Science & Technology, Vol 21, pp. 065003-8, ISSN 0953-2048
Qin, M. J. (2002). Evidence for vortex pinning induced by fluctuations in the transition
temperature of MgB
2
superconductors. Phys. Rev. B., Vol 65, pp. 132508(4), ISSN
0163-1829
Wang, J. L. et al. (2008). Effects of C substitution on the pinning mechanism of MgB
2
. Phys
Rev. B Vol 77, pp. 174501(7), ISSN 0163-1829
Li, W. X. et al. (2008). Raman study of element doping effects on the superconductivity of
MgB
2
. Phys. Rev. B., Vol 77, pp. 094517(9), ISSN 0163-1829
Gurevich, A. (2003). Enhancement of the upper critical field by nonmagnetic impurities in
dirty two-gap superconductors. Phys. Rev. B., Vol 67, pp.184515(7), ISSN 0163-1829
Zeng, R. et al. (2009). Thermal strain-induced enhancement of electromagnetic properties in
SiC-MgB
2
composites. Appl. Phys. Lett., Vol 94, 042510-3, ISSN 0003-6951
Avdeev, M. et al. (2003). Crystal chemistry of carbon-substituted MgB
2
. Physica C, Vol 387
No.3-4, pp. 301-306. ISSN 0921-4534
Coraux, J. et al. (2009). Growth of graphene on Ir(111). New J. Phys., Vol 11, pp. 023006-22.
ISSN 1367-2630
Applications of High-Tc Superconductivity
218
Hur, J. M. et al. (2008). Fabrication of high-performance MgB
2
wires by an internal Mg
diffusion process. Superconductor Science & Technology, Vol 21, pp. 032001-4, ISSN
0953-2048
Flukiger, R.
Hossain, M. S. A. and Senatore, C. (2009) Strong enhancement of J
c
and B
irr
in
binary in situ MgB
2
wires after cold high pressure densification. Superconductor
Science & Technology, Vol 22, pp. 085002-8, ISSN 0953-2048
Rowell, J. M. (2003). The widely variable resistivity of MgB
2
samples. Superconductor Science
& Technology, Vol 16, pp. R17-R27, ISSN 0953-2048
11
Preparation of Existing and Novel
Superconductors using a Spatial
Composition Spread Approach
Kevin C. Hewitt, Robert J. Sanderson and Mehran Saadat
Dalhousie University, Department of Physics and Atmospheric Science, Halifax NS
Canada
1. Introduction
We describe in this chapter a promising system and method to search for novel
superconductors by investigating appropriately chosen antiferromagnets and creating
carriers by doping using a high throughput spatial composition spread (combinatorial)
approach. The method has been applied to the cuprate superconductors and has the
potential to enhance our understanding of these materials and push the boundaries of the
field by quickly exploring novel ones.
Finding novel superconducting materials, which superconduct at much higher temperatures,
now seems to be a realistic goal because of three recent developments: the 2008 discovery of
superconductivity in iron arsenide based materials; the observation that a number of
superconductors are doped antiferromagnets; and the tremendous progress researchers have
made over the past 20 years in understanding the physical properties of existing
superconductors. These developments suggest a path to novel superconductors - explore the
electrical transport properties of doped antiferromagnets. While a number of applications of
existing superconductors have been realized, their widespread use depends on raising the
transition temperatures substantially above the current world record T
c
of 138 K.
Expanding the number of known systems which exhibit superconductivity also allows
researchers to identify its essential elements. These observations help reduce the number of
models which purport to explain the mechanism of pair formation, and allow researchers to
ignore irrelevant peculiarities of a particular system. In general, the preparation of novel
phases of matter increases the likelihood of the discovery of novel material properties. The
combinatorial approach to materials discovery (Xiang et al, 1995) allows one to realize these
goals at an unprecedented rate.
Discoveries by groups in Japan and China over the past few years have added to the class of
systems for which antiferromagnetic order exists in close proximity to superconductivity,
and in some cases may even coexist. Iron arsenide-based, cuprate, fulleride and heavy
fermion superconductors [detailed references below] populate this class, and the diversity of
hosts highlight how useful it is to search for new examples of superconductors in aid of an
empirical identification of the important parameters on which to build a correct theory. As
the number of examples has grown, the importance of spin fluctuations has emerged. This
chapter describes a route to discover novel superconductors in doped antiferromagnets to
enhance our understanding of superconductivity. To accomplish these goals we use a
Applications of High-Tc Superconductivity
220
combinatorial approach to materials discovery, which we have recently demonstrated
allows us to map the superconducting properties of the La214 cuprate superconductor and
search for new superconductors by quickly and efficiently exploring phase space in a chosen
system. The single layer K
2
CuF
4
and double layer K
3
Cu
2
F
7
perovskites will be shown to be
likely candidates to exhibit superconductivity on the border of antiferromagnetic or
ferromagnetic phases. Rapid characterization using high throughput resistivity apparatus,
such as the one (Hewitt et al, 2005) developed in our lab, allows one to identify
superconducting phases at an accelerated pace.
The spatial composition spread approach is described in section 2, its application to cuprate
superconductors in section 3 and section 4 proposes likely superconductors on the boundary
of antiferromagnetic and ferromagnetic phases.
2. Spatial composition spread approach
Combinatorial materials science (CMS) methods represent a powerful technique to produce
a large number of compositions on a spatially addressable substrate. In particular, one may
produce a continuous variation in composition across a substrate using physical vapor
deposition techniques. For example, one can locate three evaporation targets at the vertices
of a triangle to prepare a ternary phase diagram (Kennedy et al, 1965); or four targets at the
corners of a square to prepare a quaternary phase diagram (van Dover et al, 1998) by sputter
deposition. The drawback of this approach is that a non-linear variation in composition is
produced as a function of position on the substrate. In order to obtain a linear relationship
which would allow for a much easier interpretation of the data, we altered the flux
produced by sputtering targets through design of masks which intercept the flux to create a
linear or constant deposition as a function of position. Although CMS methods have been
used to show that particular superconducting phases can be prepared (Xiang et al, 1995), to
the author’s knowledge the composition spread approach has not been used for this
purpose until recently by our group (Sanderson and Hewitt, 2005, 2007) and subsequently
by a Brookhaven group (Logvenov et al, 2007) using molecular beam epitaxy.
Fig. 1. Schematic showing the sputter flux generated by sputtering a circular target with a
circular magnetron.
Preparation of Existing and Novel Superconductors using a Spatial Composition Spread Approach
221
To implement a linear composition spread approach, the target deposition profile needs to
be altered to provide the appropriate linear (or constant) variation across the substrate. One
way to produce this variation is to interrupt the flux with a physical mask placed over the
target. The process of determining the target mask profiles, for the Corona Vacuum Coaters
V-3T sputtering system used in our lab is described in detail here, as outlined elsewhere
(Dahn et al, 2002).
The sputtering flux from a circular magnetron can be determined by sputtering a target in
front of a stationary substrate and measuring the mass as a function of position. The result
for an aluminum target sputtered in an argon atmosphere at 5.6 mTorr is shown in Figure 2.
A Gaussian profile of the form
fits the data well, with the full width at half-
max, ω = 10 cm.
Fig. 2. Mass deposited per unit energy for an aluminum target sputtered in front of a
stationary substrate table in a chamber with 5.6 mTorr Argon.
To intimately mix the elements the table must be rotated at a high rate, so one must calculate
the deposition a rotating substrate. To obtain a specific deposition profile (linear out, linear
in, constant) one must be able to calculate the amount of material deposited upon a rotating
substrate, through a target mask. Figure 3 illustrates the geometry of the problem in which
vectors r
T
(table centre to target centre location on the table), r
1
(from table centre to start of
the deposited film) and r
2
(distance from the table centre to the film end) are drawn. If r
1
and
r
2
are equidistant from r
T
, then the deposition would be the same at r
1
and r
2
when the
substrate table is stationary. However, when the table is rotating, a point at r
1
has a smaller
tangential velocity than a point at r
2
, so more flux needs to reach r
2
to produce the same
deposition. For the Corona Vacuum Coaters V-3T sputtering system r
T
= 13.33 cm, r
1
= 9.5
cm and r
2
= 17.1 cm.
Applications of High-Tc Superconductivity
222
To calculate the mask profile needed consider the geometry shown in Fig. 3B. R is a vector
from the centre of the substrate table to a point below the centre of the target on the table,
while q is a vector from the centre of the target to the point on the substrate where the flux
is being calculated. By integrating the flux along the heavy arc shown in Figure 3B the
deposition D(s) can be found.
Fig. 3. Vectors defining important locations on the substrate table (A) and those needed to
define the target mask (B).
It can be shown easily that,
√
2 (1)
and the deposition as a function of radial position (s) is,
(2)
The expression of D(s) can be used to determine the desired deposition profile, whether
linearly increasing or decreasing with s, or simply a constant independent of s. Finally, the
mask shape can be numerically determined by solving Equations 1 and 2 for θ
max
and s. The
mask shape is found by converting the θ
max
and s values to x and y coordinates. Masks have
been designed for a constant deposition, as well as depositions that vary linearly, increasing
inwards and outwards. With these three masks a wide variation of film compositions can be
made. Figure 4 shows an image of each mask as well as masses of the film deposited onto a
rotating substrate through the corresponding mask.
The results presented in the next section usually employ the set-up depicted in Figure 5.
Using targets of composition A (placed behind the linear-in mask, blue in Fig. 5) and B
(placed behind the linear out mask, red in Fig. 5), results in compositions varying linearly as
A
1-x
B
x
with radial position (s).
Preparation of Existing and Novel Superconductors using a Spatial Composition Spread Approach
223
Fig. 4. Mass deposited through the linear in, linear out and constant masks. The dashed lines
are a guide to the eye.
Fig. 5. Schematic side view (left) and actual (right) front-view image of the sputtering
machine set-up with linear-in (at 4:00) and linear-out (at 12:00) masks placed in front of each
target (color on-line).
Applications of High-Tc Superconductivity
224
3. Densely mapping the phase diagram of the cuprate superconductors
We first applied the linear composition spread approach to the cuprate superconductor
Bi2212 (Sanderson and Hewitt, 2005, 2007), and then La214 (Saadat and Hewitt, 2010). The
results for La214 are described here.
The cuprates are doped antiferromagnetic Mott-Hubbard insulators, becoming Fermi liquid
metals at large hole concentrations. (They can also be electron doped, although the T
c
’s are
not as high, reflecting some type of electron-hole asymmetry.) The limiting regimes are well
described by the two-dimensional Hubbard model (Hubbard, 1963). When the onsite
coulomb repulsion (U) dominates the kinetic energy of hopping (t) (U>>t), the solutions to
the Hubbard Hamiltonian produce highly localized electron wavefunctions which gives rise
to an insulator, and super-exchange interaction produces the Néel state. When the hopping
term (t) dominates (t>>U), the solution is a modified Bloch wave function which gives rise
to the Fermi liquid state. At intermediate hole concentrations where t and U are comparable,
the transition from localized to itinerant electrons produces interesting physics and remains
enigmatic. It is within this region of the phase diagram where superconductivity occurs.
Thus it is important to understand the normal state properties of metal-insulator transitions
(Mott, 1968), in order to decipher the nature of the superconducting state. Also, in this
region of phase space there exists a partial suppression of low energy excitations, a
Pseudogap (PG) (Timusk and Statt, 1999), which appears below a temperature T* > T
c
. Its
exact description is a subject of intense study because it may hold the key to understanding
the transition to the superconducting state. Theories of the PG can be divided into two
broad categories: ones which identify it as a precursor to the onset of superconductivity, or
others which classify it as a competing phase. It is thought that a dense map of the doping
dependence of T* is the key to deciphering the nature of the PG (Norman et al, 2005).
Whether T* merges with T
c
in the overdoped regime or ends at optimal doping determines
whether the PG is a “friend” or “foe” of superconductivity.
We have recently obtained data showing that one can densely map the temperature-hole
concentration phase diagram of La
2-x
Sr
x
CuO
4+δ
(0 ≤ x ≤ 0.18) using the spatial composition
spread approach, as described in section 2 of this chapter, and presented in our recent article
(Saadat et al, 2010). First applied to the cuprate superconductor Bi2212 (Sanderson and
Hewitt, 2005, 2007), it was used to synthesize a La
2-x
Sr
x
CuO
4+δ
(0 ≤ x ≤ 0.18) library. In this
approach, targets of La
2
CuO
4
and La
1.82
Sr
0.18
CuO
4
were co-sputtered with specially
designed target masks, which ultimately produce a linear composition gradient varying
from x = 0 (at 0 mm) to x = 0.18 (at 75 mm) on a set of eight single crystal substrates. The
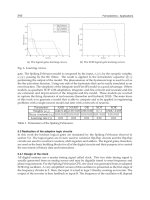
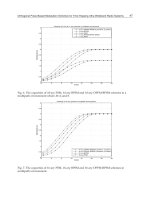
libraries’ structures are characterized by X-ray diffraction (Fig. 6) and cation composition by
Energy and Wavelength Dispersive Spectroscopy (EDS/WDS) (Fig. 7).
While we have shown it is possible to prepare single phase films in this manner, they are
polycrystalline. Epitaxial films are required to separate contributions to T* from c-axis and
ab-plane transport. Polycrystalline films are sufficient, however, to measure T
c
. Therefore, a
high-throughput resistivity apparatus (Hewitt et al, 2005) was used to measure the DC
resistivity of the 52 member library.
T
c
and T* were determined and plotted versus Sr content as shown in Fig. 9. We found that
T
c
is suppressed near 1/8 (x = 0.125) doping, consistent with the formation of a stripe phase
(Tranquada et al, 1995). The lowest Sr content (x) at which superconductivity appears is 0.03,
not at the expected value of 0.05 (Ando et al, 2004). Independent measurements of the hole
Preparation of Existing and Novel Superconductors using a Spatial Composition Spread Approach
225
Fig. 6. X-ray diffraction of film library deposited onto three substrates (SrLaAlO
4
, SrTiO
3
and
MgO). The results (top panel of three) show the peaks can all be indexed to the La214
compound, and in the bottom panel of three the region where peaks sensitive to the
tetragonal to orthorhombic phase transition ([110] – [020/200]) are found.
Fig. 7. Elemental composition of the La
2-x
Sr
x
CuO
4
(0<x<0.18) library on MgO (100).
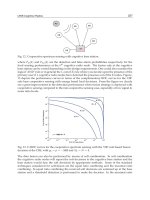
Applications of High-Tc Superconductivity
226
Fig. 8. The DC resistivity of the La
2-x
Sr
x
CuO
4
(0<x<0.18) library deposited onto SrLaAlO
4
substrates.
concentration can be obtained by measuring the intensity of a feature located 2 eV below the
O Kedge (530 eV) by X-ray absorption spectroscopy (XAS) (Kuiper et al, 1988). These
measurements would not only allow us to evaluate whether this unexpected result is a truly
novel feature and not simply a consequence of oxygen non-stoichiometry and/or film strain,
it would also test a theory that predicts the existence of charge 2e bosons in the PG state
(Leigh et al, 2007; Choy et al, 2008).
4. Prospective 2D antiferromagnetic and ferromagnetic superconductors
In this chapter we also propose promising hosts for superconductivity and describe the use
of the combinatorial approach to rapidly and efficiently scan the horribly large phase space
of possible dopings. In the field of superconductivity there are very few “right”
substitutions which produce superconductivity, and then only over a rather limited range of
dopings.
Until recently, the cuprates and heavy fermion systems have presented a rather unique
example of superconductivity in doped antiferromagnets. The phase diagram of the recently
discovered FeAs-based (e.g. RE(O,F)FeAs, RE = La, Sm, or Ce (Luetkens et al, 2009; Drew et
al, 2009; Zhao et al, 2008) and (Ba,K)Fe
2
As
2
(Chen et al, 2009) superconductors share many
features with the cuprates: a) they are doped antiferromagnets, b) superconductivity occurs
Preparation of Existing and Novel Superconductors using a Spatial Composition Spread Approach
227
Fig. 9. T
c
and T* derived from the resistivity data of Fig. 8, for a La
2-x
Sr
x
CuO
4
(0<x<0.18)
library deposited onto SrLaAlO
4
substrates using the spatial composition spread approach.
in 2D planes, though corrugated in FeAs-based materials, c) the planes are doped by
adjacent charge reservoir layers, and d) the maximum superconducting transition
temperature is a similar fraction (~1/3) of the maximum Néel temperature. Recent re-
examination of the fulleride (A
3
C
60
; A = K, Cs, and Rb) superconductors has revealed that
they are also doped antiferromagnetic insulators (Arvanitidis , 2007; Takabayashi, 2009). The
phase diagram of cobaltate (Na
x
CoO
2
.yH
2
O) (Foo et al, 2004; Takada et al, 2003) and heavy
fermion (e.g. CeCoIn
5
) (Petrovic et al, 2001) materials have this property as well.
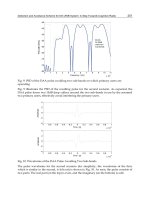
A consistent picture is emerging (Uemura, 2009) that unconventional superconductivity is
intimately related to antiferromagnetism (Fig. 10). Imai and coworkers have shown recently
(Imai, 2009) that the strength of antiferromagnetic spin fluctuations in FeSe are correlated
with the pressure-induced increase in T
c
, suggesting a link between spin fluctuations and
the mechanism of superconductivity, and have prompted some to suggest that it is a
common thread linking organic, heavy-fermion, actinide, cuprate and Fe superconductors
(Scalapino, 2009; Uemura, 2009). Spin fluctuation mediated pairing has always been a strong
candidate for the mechanism of superconductivity in the cuprates, among the more than
twenty candidates (Cho, 2006).
Monthoux and Lonzarich have proposed (Monthoux & Lonzarich, 1999; Monthoux &
Lonzarich, 2001; Monthoux et al, 2007) a spin fluctuation based mechanism for
superconductivity in systems close to a ferromagnetic or antiferromagnetic instability,
making the convincing argument that on the border of long-range magnetic order the
dominant interaction channel must be of magnetic origin and depend on the relative spin
orientations of the interacting quasiparticles. Superconductivity is predicted to be more
robust in doped antiferromagnets vs ferromagnets, and the amplitude of the oscillations in
the interaction is enhanced by low dimensionality. For example, the range of temperature
and pressure over which superconductivity is observed was increased by about one order of
Applications of High-Tc Superconductivity
228
Fig. 10. Phase diagram of (a) RE(O,F)FeAs, (b) (Ba,K)Fe
2
As
2
, (c) YBa
2
Cu
3
O
7
, (d) A
3
C
60
, (e)
CeRhIn
5
, (f)
4
He and (g) Na
x
CoO
2
.yH
2
O demonstrating the proximity of superconducting
and AF phases (adapted from Uemura, 2009).