Food waste and sustainable food waste management in the baltic sea region
Bạn đang xem bản rút gọn của tài liệu. Xem và tải ngay bản đầy đủ của tài liệu tại đây (7.28 MB, 231 trang )
Environmental Science
Walter Leal Filho
Marina Kovaleva
Food Waste and
Sustainable Food
Waste Management in
the Baltic Sea Region
Tai Lieu Chat Luong
Environmental Science and Engineering
Environmental Science
Series editors
Rod Allan, Burlington, Canada
Ulrich Förstner, Hamburg, Germany
Wim Salomons, Haren, The Netherlands
More information about this series at />
Walter Leal Filho Marina Kovaleva
•
Food Waste and Sustainable
Food Waste Management
in the Baltic Sea Region
123
Walter Leal Filho
Marina Kovaleva
Life Sciences
Hamburg University of Applied Sciences
Hamburg
Germany
ISSN 1431-6250
ISBN 978-3-319-10905-3
DOI 10.1007/978-3-319-10906-0
ISBN 978-3-319-10906-0
(eBook)
Library of Congress Control Number: 2014949358
Springer Cham Heidelberg New York Dordrecht London
© Springer International Publishing Switzerland 2015
This work is subject to copyright. All rights are reserved by the Publisher, whether the whole or part of
the material is concerned, specifically the rights of translation, reprinting, reuse of illustrations,
recitation, broadcasting, reproduction on microfilms or in any other physical way, and transmission or
information storage and retrieval, electronic adaptation, computer software, or by similar or dissimilar
methodology now known or hereafter developed. Exempted from this legal reservation are brief
excerpts in connection with reviews or scholarly analysis or material supplied specifically for the
purpose of being entered and executed on a computer system, for exclusive use by the purchaser of
the work. Duplication of this publication or parts thereof is permitted only under the provisions of the
Copyright Law of the Publisher’s location, in its current version, and permission for use must always be
obtained from Springer. Permissions for use may be obtained through RightsLink at the Copyright
Clearance Center. Violations are liable to prosecution under the respective Copyright Law.
The use of general descriptive names, registered names, trademarks, service marks, etc. in this
publication does not imply, even in the absence of a specific statement, that such names are exempt
from the relevant protective laws and regulations and therefore free for general use.
While the advice and information in this book are believed to be true and accurate at the date of
publication, neither the authors nor the editors nor the publisher can accept any legal responsibility for
any errors or omissions that may be made. The publisher makes no warranty, express or implied, with
respect to the material contained herein.
Printed on acid-free paper
Springer is part of Springer Science+Business Media (www.springer.com)
Preface
Today, the amount of food thrown away worldwide, reaches around 1.3 billion
tonnes per year. This book presents the findings of an extensive piece of research on
the state of the problem of food waste in Belarus, Estonia, Germany, Latvia,
Lithuania, Poland and Sweden. The results show that the scale of the problem with
regard to food waste varies between each country and is limited by an insufficient
number of studies in the area. In all countries except Germany and Sweden, the
problem is most prevalent in the area of food waste generated by the manufacturing
sector, mostly stemming from unused or inefficient use of by-products. In Germany
and Sweden, the main problem is food thrown away by households that is still
suitable for human consumption. The values reach 47–65 % and 35 %, respectively.
The method to reduce or prevent food waste most often applied across the seven
countries is the donation of food. In addition, Germany has initiated a large number
of engagement campaigns and activities aimed at reduction of food waste, whereas,
Sweden has launched projects only focused on single organisations or institutions.
The other reduction and prevention methods are similar to those used for biodegradable waste in the countries included in this study. The results gathered in this
study show some potential measures/methods and areas, which may be considered
in future work in order to reduce the amount of food waste generated in each of the
countries included in the study.
The authors would like to thank, the Estonian Food Bank; Federation of Polish
Food Banks; Center for Environmental Solutions in Belarus; Sustainable Business
Hub in Malmö, Sweden; Latvian Food Bank ‘Paēdušai Latvijai’; Lithuanian Food
Bank ‘Maisto bankas’; Kieler Tafel in Germany; European Federation of Food
Banks and ‘Hanzas Maiznīcas’ company in Latvia, who have willingly shared their
time to provide data and assist with this study.
v
Contents
1
Introduction .
1.1 Scope .
1.1.1
1.1.2
1.1.3
1.1.4
References. . .
2
Literature Review . . . . . . . . . . . . . . . . .
2.1 Legislation . . . . . . . . . . . . . . . . . .
2.2 Waste Management Hierarchy . . . .
2.2.1
Differences and Similarities
Management Hierarchies . .
2.3 Bio-Waste . . . . . . . . . . . . . . . . . .
2.4 Food Waste . . . . . . . . . . . . . . . . .
References. . . . . . . . . . . . . . . . . . . . . . .
3
................................
................................
Food Losses. . . . . . . . . . . . . . . . . . . . . . .
Food Residuals. . . . . . . . . . . . . . . . . . . . .
By-Products, Including Animal By-Products.
Food Waste . . . . . . . . . . . . . . . . . . . . . . .
................................
..........
..........
..........
in the Waste
..........
..........
..........
..........
Causes of Food Waste Generation . . . . . . . . . . . .
3.1 Consumer Behaviour . . . . . . . . . . . . . . . . . .
3.2 Lack of Awareness . . . . . . . . . . . . . . . . . . .
3.3 Labelling . . . . . . . . . . . . . . . . . . . . . . . . . .
3.4 Aesthetic Standards . . . . . . . . . . . . . . . . . . .
3.5 Food Merchandising . . . . . . . . . . . . . . . . . .
3.6 Legislation/Regulations as an Obstacle . . . . .
3.6.1
European Marketing Standards . . . . .
3.7 Companies Private Standards and Reputation .
3.8 Overproduction and Excess Stock . . . . . . . . .
3.9 Food Prices/Financial Incentives . . . . . . . . . .
3.10 Technical Factors . . . . . . . . . . . . . . . . . . . .
.
.
.
.
.
.
.
.
.
.
.
.
.
.
.
.
.
.
.
.
.
.
.
.
.
.
.
.
.
.
.
.
.
.
.
.
.
.
.
.
.
.
.
.
.
.
.
.
.
.
.
.
.
.
.
.
.
.
.
.
.
.
.
.
.
.
.
.
.
.
.
.
.
.
.
.
.
.
.
.
.
.
.
.
.
1
4
5
6
6
6
6
.........
.........
.........
9
10
11
.
.
.
.
.
.
.
.
.
.
.
.
.
.
.
.
.
.
.
.
.
.
.
.
.
.
.
.
.
.
.
.
.
.
.
.
14
17
20
26
.
.
.
.
.
.
.
.
.
.
.
.
.
.
.
.
.
.
.
.
.
.
.
.
.
.
.
.
.
.
.
.
.
.
.
.
.
.
.
.
.
.
.
.
.
.
.
.
.
.
.
.
.
.
.
.
.
.
.
.
.
.
.
.
.
.
.
.
.
.
.
.
.
.
.
.
.
.
.
.
.
.
.
.
.
.
.
.
.
.
.
.
.
.
.
.
.
.
.
.
.
.
.
.
.
.
.
.
31
31
34
35
36
37
38
39
39
40
41
43
vii
viii
Contents
3.10.1
3.10.2
3.10.3
References. .
Storage . . . . . . . . . .
Stock Transportation .
Poor Packaging . . . .
.................
.
.
.
.
.
.
.
.
.
.
.
.
.
.
.
.
.
.
.
.
.
.
.
.
.
.
.
.
.
.
.
.
.
.
.
.
.
.
.
.
.
.
.
.
.
.
.
.
.
.
.
.
.
.
.
.
.
.
.
.
43
44
44
48
4
Methods of Food Waste Reduction . . . . . . . . . . . . . . . . . . .
4.1 Public Awareness Raising/Education . . . . . . . . . . . . . . .
4.1.1
Awareness Campaigns and Informativeness . . . .
4.1.2
Guidelines . . . . . . . . . . . . . . . . . . . . . . . . . . .
4.1.3
Education . . . . . . . . . . . . . . . . . . . . . . . . . . .
4.2 Food Recovery and Redistribution . . . . . . . . . . . . . . . .
4.3 Legislation—Governmental Interventions . . . . . . . . . . . .
4.4 Economic Incentives/Financial Instruments. . . . . . . . . . .
4.4.1
Negative . . . . . . . . . . . . . . . . . . . . . . . . . . . .
4.4.2
Positive . . . . . . . . . . . . . . . . . . . . . . . . . . . . .
4.5 Forecasting and Correct Inventory Management/Planning.
4.6 Packaging . . . . . . . . . . . . . . . . . . . . . . . . . . . . . . . . .
4.7 Labelling . . . . . . . . . . . . . . . . . . . . . . . . . . . . . . . . . .
4.8 Companies Initiatives . . . . . . . . . . . . . . . . . . . . . . . . .
4.9 Separate Collection of Food Waste . . . . . . . . . . . . . . . .
4.10 Alternative Use. . . . . . . . . . . . . . . . . . . . . . . . . . . . . .
4.10.1 Energy Recovery . . . . . . . . . . . . . . . . . . . . . .
4.10.2 Novel Added-Value Materials/Products . . . . . . .
References. . . . . . . . . . . . . . . . . . . . . . . . . . . . . . . . . . . . . .
.
.
.
.
.
.
.
.
.
.
.
.
.
.
.
.
.
.
.
.
.
.
.
.
.
.
.
.
.
.
.
.
.
.
.
.
.
.
.
.
.
.
.
.
.
.
.
.
.
.
.
.
.
.
.
.
.
.
.
.
.
.
.
.
.
.
.
.
.
.
.
.
.
.
.
.
51
51
52
52
53
53
55
57
58
59
59
61
61
62
64
65
65
68
77
5
Research Methods . . . . . . . . . . . . . . . . . . . . . . . . . . . . . . . . . . .
81
6
Overview of the Baltic Region Countries . . . . .
6.1 Main Economic Activities . . . . . . . . . . . .
6.1.1
Belarus . . . . . . . . . . . . . . . . . . .
6.1.2
Estonia . . . . . . . . . . . . . . . . . . .
6.1.3
Germany . . . . . . . . . . . . . . . . . .
6.1.4
Latvia . . . . . . . . . . . . . . . . . . . .
6.1.5
Lithuania . . . . . . . . . . . . . . . . . .
6.1.6
Poland. . . . . . . . . . . . . . . . . . . .
6.1.7
Sweden . . . . . . . . . . . . . . . . . . .
6.2 Renewable Energy . . . . . . . . . . . . . . . . .
6.3 Food Consumption and Undernourishment .
6.3.1
Poverty Level. . . . . . . . . . . . . . .
6.3.2
Undernourishment. . . . . . . . . . . .
6.3.3
European Food Aid. . . . . . . . . . .
6.3.4
Food Expenditures . . . . . . . . . . .
83
83
83
85
87
87
87
88
89
90
91
91
92
93
94
.
.
.
.
.
.
.
.
.
.
.
.
.
.
.
.
.
.
.
.
.
.
.
.
.
.
.
.
.
.
.
.
.
.
.
.
.
.
.
.
.
.
.
.
.
.
.
.
.
.
.
.
.
.
.
.
.
.
.
.
.
.
.
.
.
.
.
.
.
.
.
.
.
.
.
.
.
.
.
.
.
.
.
.
.
.
.
.
.
.
.
.
.
.
.
.
.
.
.
.
.
.
.
.
.
.
.
.
.
.
.
.
.
.
.
.
.
.
.
.
.
.
.
.
.
.
.
.
.
.
.
.
.
.
.
.
.
.
.
.
.
.
.
.
.
.
.
.
.
.
.
.
.
.
.
.
.
.
.
.
.
.
.
.
.
.
.
.
.
.
.
.
.
.
.
.
.
.
.
.
.
.
.
.
.
.
.
.
.
.
.
.
.
.
.
.
.
.
.
.
.
.
.
.
.
.
.
.
.
.
.
.
.
.
.
.
.
.
.
.
.
.
.
.
.
.
.
.
.
.
.
.
.
.
.
.
.
.
.
.
.
.
Contents
6.4
Biodegradable Waste. . . .
6.4.1
Legislation . . . . .
6.4.2
Waste Generation
References. . . . . . . . . . . . . . . .
7
8
ix
...........
...........
and Treatment
...........
.
.
.
.
.
.
.
.
.
.
.
.
.
.
.
.
.
.
.
.
.
.
.
.
.
.
.
.
.
.
.
.
.
.
.
.
.
.
.
.
.
.
.
.
The State of the Problem of Food Waste in the Baltic
Region Countries . . . . . . . . . . . . . . . . . . . . . . . . . . . . . . . .
7.1 Food Waste Generation in the Baltic . . . . . . . . . . . . . . .
7.1.1
Food Waste Amounts According to the FAO
Food Balance Sheets . . . . . . . . . . . . . . . . . . . .
7.1.2
Food Waste Generated Based on the FAO
Technical Conversion Factors—Extraction Rates.
7.1.3
Belarus . . . . . . . . . . . . . . . . . . . . . . . . . . . . .
7.1.4
Estonia . . . . . . . . . . . . . . . . . . . . . . . . . . . . .
7.1.5
Germany . . . . . . . . . . . . . . . . . . . . . . . . . . . .
7.1.6
Latvia . . . . . . . . . . . . . . . . . . . . . . . . . . . . . .
7.1.7
Lithuania . . . . . . . . . . . . . . . . . . . . . . . . . . . .
7.1.8
Poland. . . . . . . . . . . . . . . . . . . . . . . . . . . . . .
7.1.9
Sweden . . . . . . . . . . . . . . . . . . . . . . . . . . . . .
7.2 Food Waste Treatment. . . . . . . . . . . . . . . . . . . . . . . . .
7.2.1
Belarus . . . . . . . . . . . . . . . . . . . . . . . . . . . . .
7.2.2
Biological Treatment in Belarus . . . . . . . . . . . .
7.2.3
Estonia . . . . . . . . . . . . . . . . . . . . . . . . . . . . .
7.2.4
Germany . . . . . . . . . . . . . . . . . . . . . . . . . . . .
7.2.5
Latvia . . . . . . . . . . . . . . . . . . . . . . . . . . . . . .
7.2.6
Lithuania . . . . . . . . . . . . . . . . . . . . . . . . . . . .
7.2.7
Poland. . . . . . . . . . . . . . . . . . . . . . . . . . . . . .
7.2.8
Sweden . . . . . . . . . . . . . . . . . . . . . . . . . . . . .
References. . . . . . . . . . . . . . . . . . . . . . . . . . . . . . . . . . . . . .
Discussion . . . . . . . . . . . . . . . . . . . . . . . . . . . . . . . . . . . . .
8.1 Food Waste Generation . . . . . . . . . . . . . . . . . . . . . . . .
8.1.1
Food Waste Amounts According to the FAO
Food Balance Sheets . . . . . . . . . . . . . . . . . . . .
8.1.2
Food Waste Generated Based on the FAO
Technical Conversion Factors—Extraction Rates.
8.1.3
Situation in Individual Countries. . . . . . . . . . . .
8.2 Food Waste Treatment. . . . . . . . . . . . . . . . . . . . . . . . .
8.2.1
Belarus . . . . . . . . . . . . . . . . . . . . . . . . . . . . .
8.2.2
Estonia . . . . . . . . . . . . . . . . . . . . . . . . . . . . .
8.2.3
Germany . . . . . . . . . . . . . . . . . . . . . . . . . . . .
8.2.4
Latvia . . . . . . . . . . . . . . . . . . . . . . . . . . . . . .
.
.
.
.
.
.
.
.
.
.
.
.
96
96
96
103
....
....
107
107
....
110
.
.
.
.
.
.
.
.
.
.
.
.
.
.
.
.
.
.
.
.
.
.
.
.
.
.
.
.
.
.
.
.
.
.
.
.
124
125
129
129
134
135
137
139
144
145
146
147
149
154
156
158
161
170
....
....
177
178
....
180
.
.
.
.
.
.
.
181
181
186
186
187
188
189
.
.
.
.
.
.
.
.
.
.
.
.
.
.
.
.
.
.
.
.
.
.
.
.
.
.
.
.
.
.
.
.
.
.
.
.
.
.
.
.
.
.
.
.
.
.
.
.
.
.
.
.
.
.
.
.
.
.
.
.
.
x
Contents
8.2.5
8.2.6
8.2.7
References. .
.
.
.
.
.
.
.
.
.
.
.
.
.
.
.
.
.
.
.
.
.
.
.
.
.
.
.
.
.
.
.
.
.
.
.
.
.
.
.
.
.
.
.
.
.
.
.
.
.
.
.
.
.
.
.
.
.
.
.
.
.
.
.
.
.
.
.
.
.
.
.
.
.
.
.
.
.
.
.
.
.
.
.
.
.
.
.
.
.
.
.
.
189
190
191
192
Conclusions and Recommendations .
9.1 Conclusions . . . . . . . . . . . . . .
9.1.1
Belarus . . . . . . . . . . .
9.1.2
Estonia . . . . . . . . . . .
9.1.3
Germany . . . . . . . . . .
9.1.4
Latvia . . . . . . . . . . . .
9.1.5
Lithuania . . . . . . . . . .
9.1.6
Poland. . . . . . . . . . . .
9.1.7
Sweden . . . . . . . . . . .
9.2 Recommendations . . . . . . . . . .
9.2.1
Belarus . . . . . . . . . . .
9.2.2
Estonia . . . . . . . . . . .
9.2.3
Germany . . . . . . . . . .
9.2.4
Latvia . . . . . . . . . . . .
9.2.5
Lithuania . . . . . . . . . .
9.2.6
Poland. . . . . . . . . . . .
9.2.7
Sweden . . . . . . . . . . .
References. . . . . . . . . . . . . . . . . . . .
.
.
.
.
.
.
.
.
.
.
.
.
.
.
.
.
.
.
.
.
.
.
.
.
.
.
.
.
.
.
.
.
.
.
.
.
.
.
.
.
.
.
.
.
.
.
.
.
.
.
.
.
.
.
.
.
.
.
.
.
.
.
.
.
.
.
.
.
.
.
.
.
.
.
.
.
.
.
.
.
.
.
.
.
.
.
.
.
.
.
.
.
.
.
.
.
.
.
.
.
.
.
.
.
.
.
.
.
.
.
.
.
.
.
.
.
.
.
.
.
.
.
.
.
.
.
.
.
.
.
.
.
.
.
.
.
.
.
.
.
.
.
.
.
.
.
.
.
.
.
.
.
.
.
.
.
.
.
.
.
.
.
.
.
.
.
.
.
.
.
.
.
.
.
.
.
.
.
.
.
.
.
.
.
.
.
.
.
.
.
.
.
.
.
.
.
.
.
.
.
.
.
.
.
.
.
.
.
.
.
.
.
.
.
.
.
.
.
.
.
.
.
.
.
.
.
.
.
.
.
.
.
.
.
.
.
.
.
.
.
.
.
.
.
.
.
.
.
.
.
.
.
.
.
.
.
.
.
.
.
.
.
.
.
.
.
.
.
.
.
.
.
.
.
.
.
.
.
.
.
.
.
.
.
.
.
.
.
.
.
.
.
.
.
.
.
.
.
.
.
.
.
.
.
.
.
.
.
.
.
.
.
.
.
.
.
.
.
.
.
.
.
.
.
.
.
.
.
.
.
.
.
.
.
.
.
.
.
.
.
.
.
.
.
.
.
.
.
.
.
.
.
.
.
.
.
.
.
.
.
.
.
.
.
.
.
.
.
.
.
.
.
.
.
.
.
.
.
.
.
.
.
.
.
.
.
.
.
.
.
.
.
.
.
.
.
193
193
194
195
195
196
197
197
198
199
200
201
201
202
202
203
203
204
Appendix A: Questionnaire in English . . . . . . . . . . . . . . . . . . . . . . . .
205
Appendix B: Questionnaire in Russian . . . . . . . . . . . . . . . . . . . . . . . .
211
Glossary . . . . . . . . . . . . . . . . . . . . . . . . . . . . . . . . . . . . . . . . . . . . . .
217
9
Lithuania .
Poland. . .
Sweden . .
.........
.
.
.
.
.
.
.
.
.
.
.
.
.
.
.
.
.
.
.
.
.
.
.
.
.
.
.
.
.
.
.
.
Abbreviations
ABPR
AD
BAT
BMELV
BMW
BOGOF
CBI
CEWEP
CHP
Defra
EAUC
EC
ECN
EEA
EU
EWWR
FAO
FEBA
FFV
FSC
GDP
GHG
IEEP
IES
ISO
ISWM
IVC
JRC
MBT
MRL
Animal By-Product Regulations
Anaerobic digestion
Best Available Technology
German Federal Ministry of Food Agriculture and Consumer Protection
Biodegradable Municipal Waste
Buy one get one free
Centre for the Promotion of Imports from developing countries
Confederation of European Waste-to-Energy Plants
Combined Heat and Power
Department for Environment, Food and Rural Affairs
Environmental Association for Universities and Colleges
European Commission
European Compost Network
European Environment Agency
European Union
European Week for Waste Reduction
Food and Agriculture Organization
European Federation of Food Banks
Fresh Fruits and Vegetables
Food Supply Chain
Gross Domestic Product
Greenhouse Gases
Institute for European Environmental Policy
Institute for Environment and Sustainability
International Standard Organisation
Integrated Solid Waste Management
In-vessel composting
Joint Research Centre, Institute for Environment and Sustainability
Mechanical-Biological Treatment
Maximum Residue Level
xi
xii
MS
MSW
NSW
RDF
RFID
SHR
TPR
US EPA
UK
UN
UNECE
US
Vito
WFD
WRAP
Abbreviations
Member States
Municipal Solid Waste
New South Wales
Refuse-Derived Fuel
Radio Frequency Identification technology
Swedish Hotel and Restaurant Association
Temporary Price Reduction
United States Environmental Protection Agency
United Kingdom
United Nations
United Nations Economic Commission for Europe
United States
Vision on Technology
Waste Framework Directive
Waste and Resources Action Programme
Chapter 1
Introduction
The rapidly changing world also has a great impact on food production and consumption patterns. Attitudes of society towards food has shifted over the years due
to rising income per capita, demographic shifts, changing lifestyles, and moral and
social values. Technological innovations and competition in the international food
market have driven changes in the variety and availability of food products (BIO
Intelligence Service et al. 2011). Nevertheless, the issue of food accessibility and
affordability still remains as topical today as it did decades ago. Today, globally,
9 million people die of hunger each year, and 800 million are undernourished (BIO
Intelligence Service et al. 2011).
At the same time, according to the FAO estimations, approximately 30 % of all
food produced for human consumption is lost or wasted throughout the global food
supply system (from initial agricultural production to final household consumption).
Food waste amounts to approximately 1.3 billion tonnes per year (Gustavsson et al.
2011). Breaking it down into different food categories, globally, roughly 30 % of
cereals, 40–50 % of root crops, fruits and vegetables, 20 % of oilseeds, meat and
dairy, and 30 % of fish are discarded annually (FAO 2012b). Worldwide, retailers
throw away 1.6 million tonnes of food per year (Institution of Mechanical Engineers
2013).
In medium- and high-income countries food is to a significant extent rejected at
the consumption stage due to wasteful behaviour by consumers, as a result of an
excessive amount of purchased food. In low-income countries food is mostly lost or
wasted during the early and middle stages of the food supply chain (e.g. harvesting,
transportation) and much less at the consumer level. However, overall, on a per
capita basis, much more food is thrown away in the industrialized world than in
developing countries (Gustavsson et al. 2011).
Such wasteful behaviour jeopardises not only the current, but also the future
state of food security in the world. This becomes evident in the light of the projected
60 % increase in the global demand for food by 2050, effects of climate change,
natural resource constraints (e.g. water scarcity), losses in yield and land area as a
result of environmental degradation, and competing demands, especially, for the
production of biofuels (Nellemann et al. 2009; FAO et al. 2012). Today, 60 % of
the world’s major ecosystems have already been degraded or are used unsustainably
© Springer International Publishing Switzerland 2015
W. Leal Filho and M. Kovaleva, Food Waste and Sustainable Food
Waste Management in the Baltic Sea Region, Environmental Science
and Engineering, DOI 10.1007/978-3-319-10906-0_1
1
2
1
Introduction
(European Commission 2011). The demand for food will also be driven by global
population growth: a larger number of wealthier people and required additional
resources to produce products for their more varied, high-quality diet (Foresight
2011).
In addition, food which is grown and produced but uneaten has significant
environmental and economic costs (FAO 2013). It leads to waste of resources used
in production, such as land, water, energy, fertilizers, as well as to unnecessary CO2
emissions, and has a direct and negative impact on the income of both farmers and
consumers (Gustavsson et al. 2011; Institution of Mechanical Engineers 2013). At
the European level alone, at least 170 million tonnes of CO2eq. (approximately 3 %
of total EU-27 emissions in 2008) are emitted annually, along all steps of the life
cycle of disposed of food, namely agricultural steps, food processing, transportation, storage, consumption steps and end-of-life impacts (BIO Intelligence Service
et al. 2011). Moreover, conservative estimates of water loss caused by discarded
food indicate that about half of the water withdrawn for irrigation is lost (World
Economic Forum 2009).
The direct economic cost of lost or wasted agricultural products (excluding fish
and seafood), based on producer prices only, is approximately EUR 548 billion
(USD 750 billion), which is equivalent to the GDP of Switzerland (FAO 2013). US
businesses and consumers lose about EUR 145 billion (USD 198 billion) per year
because of discarded food (Venkat 2011). In the UK thrown away food which is
suitable for human consumption costs EUR 12.4 billion (£10.2 billion) per year
(WRAP 2008).
The exact causes of rejected food are significantly dependent on the conditions
and local situation experienced by a country (Gustavsson et al. 2011). For instance,
in low-income countries, these causes are mainly connected to financial, managerial
and technical limitations in harvesting techniques, storage and cooling facilities in
difficult climatic conditions, infrastructure, packaging and marketing systems
(Gustavsson et al. 2011).
Whereas in medium/high-income countries the causes relate to consumer
behaviour (e.g. insufficient purchase planning, confusion of date labels, lack/
insufficient knowledge/information), quality standards (e.g. not perfect shape, size,
colour or time to ripeness of a food item), legislation, a lack of coordination
between different actors in the supply chain that leads to oversupply and overproduction, technical malfunctions and challenges to forecast consumer demand.
Unfortunately, the retail model views food disposal as a necessary part of the
business (Gunders 2012).
In the area of food service, the causes of food waste are large portion sizes and
undesired accompaniments, inflexibility of chain-store management and pressure to
maintain enough food supply to offer extensive menu choices at all times (Gunders
2012).
The available statistics regarding amounts of discarded food in a single county or
region is ‘impressive’. USA, Canada, Australia, and New Zealand collectively
dispose of 38 % of grain products, 50 % of seafood, 52 % of fruits and vegetables,
22 % of meat, and 20 % of milk (Gunders 2012).
1 Introduction
3
According to FAO, lost or wasted food per capita in Europe and North-America
amounts to 280–300 kg per year (Gustavsson et al. 2011). The European studies
bring a value of 179 kg per capita that in total comprise 89 million tonnes (BIO
Intelligence Service et al. 2011).
In developing countries, 35–50 % of lost or wasted food is caused by inefficiencies in the entire value chain of food products (mainly: harvesting; storage;
transportation and processing stages; World Economic Forum 2009).
In Asia, these amount to 10–37 % for cereals and oilseed, and to approximately
50 % for some perishable staples (World Economic Forum 2009).
In the United States approximately 7 % of planted fields are typically not harvested each year (Gunders 2012).
In the EU, the manufacturing sector generates 39 % of the total of food related
waste, or approximately 35 million tonnes (BIO Intelligence Service et al. 2011)
which is almost the same amount as in the USA—36.3 million tonnes (U.S. EPA
2013).
In the industrialised countries, the amount of food that is discarded by retail,
food service and household sectors raise the biggest concern. In 2008, in-store food
loss or waste in the United States was estimated to be 19.5 million tonnes:
equivalent to 10 % of the total food supply at the retail level. Approximately
4–10 % of food purchased by restaurants becomes kitchen loss, both edible and
inedible, before reaching the consumer (Gunders 2012). In the EU-27, the
wholesale/retail sector generates close to 8 kg of food loss or waste per capita,
representing around 4.4 million tonnes per year. The food service sector generates
an average of 25 kg per capita, 12.3 million tonnes overall (BIO Intelligence
Service et al. 2011).
At consumer level, the industrialised countries discard about 222 million tonnes,
which is almost as high as the total net food production in sub-Saharan Africa (230
million tonnes) (Gustavsson et al. 2011).
A consumer in Europe and North America discards on average between 95 and
115 kg per year, while in sub-Saharan Africa and South/Southeast Asia a consumer
will only discard of 6–11 kg per year on average (Gustavsson et al. 2011).
In the United States 40 % of food goes uneaten. Today, the average American
consumer wastes up 50 % more food than American consumers in the 1970s.
American families throw out approximately 25 % of purchased food (Gunders
2012). The same value is true for consumers in the UK.
In the EU, households produce the largest fraction of food related waste overall,
at about 42 % of the total or about 38 million tonnes (BIO Intelligence Service et al.
2011). A detailed country-level study conducted in the UK showed that 61 % or 4.1
million tonnes of food are discarded because it had not been managed well. 46 % of
the wasted food is in a fresh, raw or minimally processed state, 27 % having been
cooked or prepared in some way and 20 % ready to consume when purchased.
45 thousand tonnes of rice, 33 thousand tonnes of pasta and 105 thousand tonnes
of potato are thrown away each year, suggesting people prepare too much. Over one
quarter (nearly 1.2 million tonnes per year) of food is discarded in its packaging,
either opened or unopened. Annually, 2.9 billion whole and untouched fruit items,
4
1
Introduction
1.9 billion whole vegetables and 1.2 million bakery items are thrown away (WRAP
2008).
The experts claim that only in the EU, the total amount of discarded food
expected to rise by 40 % by 2020 (European Parliament Resolution (2011/2175
(INI)) 2012). Addressing the problem, the EU and UN have signed the ‘Joint
Declaration Against Food Waste’, where they commit to reduce the amount of
wasted food by 50 % by 2025 (Weber et al. 2011). In addition, the European
Parliament designated 2014 as the ‘European year against food waste’ (Gunders
2012). It is noted that halving the current global amount of discarded food could
reduce the food required by 2050 by an amount approximately equal to 25 % of
today’s production (Foresight 2011).
However, despite a number of studies undertaken which make the case for
tackling the problem, actual precise data on food loss and waste generation,
avoidance and management and its ultimate fate is scarce, sparse, fragmented,
disaggregated and difficult to verify, both on the global and national levels. This
indicates the need to conduct additional research in the area.
The goal of this book is to investigate and make a thorough review of the state of
the problem of food waste in the following countries in the Baltic Sea Region:
Belarus; Estonia; Latvia; Lithuania; Poland; Germany and Sweden. It includes an
analysis of the following aspects: the amount of food waste generated; its composition; stages in the food supply chain where the biggest quantities are accumulated; causes and applied treatment methods. Finally, the thesis will provide a
suggestion of possible measures necessary to be taken in order to reduce the amount
of food waste generated, based on the obtained results.
The seven countries mentioned above represent differing economies with differing consumer purchasing power. Therefore, the data on the amount of food waste
generated in each country gives a foundation to support or refute a hypothesis that
there is a strong negative dependence between an amount of household food waste
and a share of food expenditures, i.e., consumers who spend a smaller amount on
food generated a larger amount of food waste.
1.1 Scope
The complexity and, to a lesser extent, the ambiguity of the term ‘food waste’
makes it difficult to bring the results of many related studies to one common basis,
and reduces the possibility for comparison. Confusion around the definition of the
term ‘food waste’, the lack of a harmonized version of the term and the need to
establish such a term are also noted in the resolution of the European Parliament
(2011/2175(INI)) (European Parliament Resolution (2011/2175(INI)) 2012). In
order to define the scope of this work, firstly, it is necessary to build a topology of
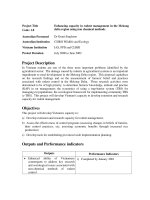
what today is referred to ‘thrown food’. An analysis of available studies and reports
has shown that researchers define wasted food by using a number of crossover,
1.1 Scope
5
Biodegradable
waste
Bio-waste
Food Wastage
Food Waste
Food Losses
Garden Waste
Paper
...
...
Food Residues
By-products
incl. animal
Fig. 1.1 Biodegradable waste hierarchy
interchangeable or, mutually exclusive terms such as ‘food loss/es’, ‘food waste’,
‘food wastage’, ‘food residues’, ‘bio-waste’, ‘biodegradable waste’ etc.
The topology below (Fig. 1.1) is built based on a foundation in the literature
terms and definitions regarding discarded food.
At the top of the hierarchy is biodegradable waste, of which one of the constituents is bio-waste. Bio-waste could be divided into a number of sub-types. One
of these is ‘food wastage’. The term includes all types of food or food products that
have been produced (e.g. grown, manufactured, cooked) for human consumption
and then thrown away. ‘Food wastage’ includes the following types of discarded
food:
1.1.1 Food Losses
Food losses are wholesome edible material intended for human consumption that is
instead lost as an unintended result of agricultural processes, lack of technology or
technical limitations in storage, packaging, and/or marketing, poor infrastructure
and logistics, insufficient skills, knowledge and management capacity of supply
chain actors (FAO 2012a; Lipinski et al. 2013) or consumed by pests (Foresight
2010; Lin et al. 2013; Pfaltzgra et al. 2013). These take place all along food supply
chain (FAO 2012b). Food losses may occur at the production, storage, processing,
distribution, retail stages, as well as before, during or after meal preparation (BIO
Intelligence Service et al. 2011).
6
1
Introduction
1.1.2 Food Residuals
Food residuals are unavoidable inedible and partly avoidable wastes such as skins,
bones, stalks, shells and leaves (WRAP 2009; Foresight 2010; BIO Intelligence
Service et al. 2011). They also include residues generated in restaurants, pubs,
coffee shops and certain food production facilities no longer intended for human
consumption (Lin et al. 2013).
1.1.3 By-Products, Including Animal By-Products
By-product is a useful and marketable product or service deriving from a manufacturing process that is not the primary product or service being produced (EEA
2013). Food by-products are edible material that generated during food processing
and manufacturing, and usually diverted away from the human food chain and fed
to animals (Foresight 2010). Animal by-products are “entire bodies or parts of
animals or products of animal origin … not intended for human consumption,
including ova, embryos and semen” (European Parliament and Council of the
European Union Regulation (EC) 1774/2002).
1.1.4 Food Waste
Food waste belongs to the category of avoidable waste. Discarded food still has
value and is very often fit for consumption (FAO 2012a). Food waste is food that is
spilled, spoiled, bruised or wilted. It may include whole or unopened packets or
individual items of food which are not eaten at all (WRAP 2008). Food waste arises
at any point in the food supply chain (Foresight 2010) as a result of inappropriate
behaviour of food chain actors (e.g. producers, retailers, the food service sector,
consumers) (FAO 2012b) as well as resulting from a lack of existing preventative
technologies. A share of each of the aforementioned food wastage sub-types could
be avoided by applying latest available instruments, therefore, until then, it might be
considered as food waste.
Based on the analysis presented above and the hierarchy which exists, the
current work will center on the ‘food waste’ sub-type.
References
BIO Intelligence Service, Umweltbundesamt, & Arcadis (2011). Guidelines on the preparation of
food waste prevention programmes. Retrieved from />prevention/pdf/prevention_guidelines.pdf.
References
7
EEA (2013). By-product. Environmental Terminology and Discovery Service (ETDS). Retrieved
September 22, 2013, from />European Commission (2011). Communication from the Commission to the European Parliament,
the Council, the European Economic and Social Committee and the Committee of the regions.
Roadmap to a Resource Efficient Europe COM(2011)571 (pp. 1–26). Retrieved from http://ec.
europa.eu/environment/resource_efficiency/pdf/com2011_571.pdf.
European Parliament and Council of the European Union Regulation (EC) 1774/2002. European
Parliament and Council of the European Union Regulation (EC) No 1774/2002 of 3 October
2002 laying down health rules concerning animal by-products not intended for human
consumption. Official Journal L 273 10.10.2002. Retrieved from />LexUriServ/LexUriServ.do?uri=OJ:L:2002:273:0001:0001:EN:PDF.
European Parliament Resolution (2011/2175(INI)) (2012). European Parliament resolution of 19
January 2012 on how to avoid food wastage: strategies for a more efficient food chain in the
EU (2011/2175(INI)), 2175(January) (pp. 1–8). Retrieved from />sides/getDoc.do?pubRef=-//EP//NONSGML+TA+P7-TA-2012-0014+0+DOC+PDF+V0//EN.
FAO (2012a). Food wastage footprint. An environmental accounting of food loss and waste.
Concept Note. Retrieved from />pathways/docs/Food_Wastage_Concept_Note_web.pdf.
FAO (2012b). Global initiative on food losses and waste reduction. Retrieved from http://www.
fao.org/docrep/015/i2776e/i2776e00.pdf.
FAO (2013). Food wastage footprint. Impacts on natural resources. Retrieved from http://www.
fao.org/docrep/018/i3347e/i3347e.pdf.
FAO, WFP, & IFAD (2012). The State of Food Insecurity in the World 2012. Economic growth is
necessary but not sufficient to accelerate reduction of hunger and malnutrition, Rome.
Retrieved from />Foresight (2010). How can waste reduction help to healthily and sustainably feed a future global
population of nine billion people?, London. Retrieved from />foresight/docs/food-and-farming/workshops/11-608-w4-expert-forum-reduction-of-foodwaste.pdf.
Foresight (2011). The future of food and farming: Challenges and choices for global
sustainability, London. Retrieved from />Gunders, D. (2012). Wasted: How America is losing up to 40 percent of its food from farm to fork
to landfill. Retrieved from />Gustavsson, J., et al. (2011). Global food losses and food waste—Extent, causes and prevention,
Rome. Retrieved from />Institution of Mechanical Engineers (2013). Global food waste not, want not, London. Retrieved
from />Lin, C. S. K., et al. (2013). Food waste as a valuable resource for the production of chemicals,
materials and fuels. Current situation and global perspective. Energy & Environmental Science,
6(2), 426–464. Retrieved August 13, 2013, from />Lipinski, B., et al. (2013). Reducing food loss and waste, Washington, DC. Retrieved from http://
www.worldresourcesreport.org.
Nellemann, C., et al. (2009). The environmental food crisis—The environment’s role in averting
future food crises. Retrieved from />Pfaltzgra, L. A., et al. (2013). Food waste biomass: a resource for high-value chemicals. Green
Chemistry, 15, 307–314. Retrieved from />c2gc36978h.
U.S. EPA (2013). 2011 Municipal solid waste characterization report, Washington, DC. Retrieved
from />rpt.pdf.
8
1
Introduction
Venkat, K. (2011). The climate change and economic impacts of food waste in the United States.
International Journal of Food System Dynamics, 2(4), 431–446. Retrieved from http://www.
cleanmetrics.com/pages/ClimateChangeImpactofUSFoodWaste.pdf.
Weber, B., Herrlein, S., & Hodge, G. (2011). The challenge of food waste, London. Retrieved from
www.planetretail.net.
World Economic Forum (2009). Driving sustainable consumption value chain waste driving
sustainable consumption value chain waste (pp. 1–8). Retrieved from orum.
org/pdf/sustainableconsumption/DSCOverviewBriefing-ValueChainWaste.pdf.
WRAP (2008). The food we waste. Retrieved from />WRAP (2009). Household food and drink waste in the UK, Banbury. Retrieved from http://www.
wrap.org.uk/sites/files/wrap/HouseholdfoodanddrinkwasteintheUK-report.pdf.
Chapter 2
Literature Review
Every year 11.2 billion tonnes of solid waste are collected worldwide (UNEP
2011). In upcoming years the amount of accumulated waste will continue to
increase together with growing population, an urbanization rate, overall economic
and GDP/GNI per capita growth, an increase in production and consumption, and
changes in a consumption pattern. Furthermore, the latest World Bank report
predicts that annual global solid waste management costs will increase from USD
205.4 billion to about USD 375.5 billion by 2025 (Hoornweg and Bhada-Tata
2012). However, there is a positive aspect to this waste—its huge economic
potential. Today the world waste market, from collection to recycling, is estimated
at USD 410 billion a year, not including the sizable informal segment in developing
countries (UNEP 2011).
According to the Eurostat data, the European Union alone generates about 3
billion tonnes of waste annually, and due to the OECD projections by 2020, this
amount will increase by 45 % in comparison to 1995 (European Commission
2013b). Such a quantity of waste and its complexity not only have a significant
adverse environmental impact, causing pollution, greenhouse gas emissions, and
posing threats to human health, but also wastes a huge amount of material and
energy resources (European Commission 2010; EEA 2013b).
Highly dependent on imported raw materials, Europe, in its long-term goals and
strategies strives to reduce the amount of waste generated by improving its resource
efficiency through recycling, avoiding waste and using unavoidable waste as a
resource wherever it possible (European Commission 2010).
Waste prevention has been identified as one of the top priorities in the EU’s
Sixth Environment Action Programme (European Commission 2013b) as well as in
the proposal of the European Commission for the 7th Environment Action Programme and the Roadmap to a resource efficient Europe (EEA 2013a).
The European Union’s approach to waste management is based on the following
principles:
• Waste prevention, which is closely linked with improving manufacturing
methods and influencing consumers to demand greener products and less
packaging.
© Springer International Publishing Switzerland 2015
W. Leal Filho and M. Kovaleva, Food Waste and Sustainable Food
Waste Management in the Baltic Sea Region, Environmental Science
and Engineering, DOI 10.1007/978-3-319-10906-0_2
9
10
2 Literature Review
• Recycling and reuse as an alternative to waste prevention in cases when it is not
possible.
• Improvement of final disposal and monitoring as the last option, where waste is
safely incinerated or landfilled (European Commission 2013b).
2.1 Legislation
These principles are reflected in the European framework of waste legislation. The
framework includes a variety of requirements and technical standards for waste
management in general (for all waste streams), for specific waste streams (e.g.
packaging waste) and for specific waste treatment modes such as landfill and waste
incineration (Neubauer 2007; EAUC 2013). All of these standards are implemented
through a large number of EU Directives and Regulations, the cornerstone of which
is the EU Waste Framework Directive considered as the “basic law” of the EU
Waste Policy. The Directive dates from 1975 and was re-edited in 2006 (Neubauer
2007) as a result of the 2005 Thematic Strategy on Waste Prevention and Recycling
(European Commission 2010).
The Thematic Strategy on the Prevention and Recycling of Waste (COM (2005)
666) adopted in 2005 (Commission of the European Communities Communication
COM (2005) 666 2005) became a main driver for reforming out-dated principles
and requirements of the EU waste legislation and bringing a new approach which is
dictated by the realities of the world today. The Strategy defines the long term goal
of switching the EU to a recycling society that seeks to avoid waste and uses waste
as a resource. It promotes prevention, recycling and re-use measures as well as an
application of a life-cycle orientated approach to waste management. It sets minimum EU standards for recycling activities and a framework for specific national
policies. Moreover, the document recommends an improvement of the knowledge
base on the impact of resource use, waste generation and management (Commission of the European Communities Communication COM (2005) 666 2005).
According to the Strategy, the Revised Waste Framework Directive (2008/98/
EC) (2008) sees waste as a valued resource by strengthening its economic value and
sets out targets for EU Member States to recycle 50 % of their municipal waste by
2020 (European Commission 2010). The countries are also required to introduce
legislation on waste collection, reuse, recycling and disposal (European Commission
2013b). In addition to the definition of key concepts related to waste management,
the document clarifies the difference between waste and by-products, sets criteria
and conditions for situations when waste ceases to be waste and focuses on reducing
the environmental impacts of waste generation. The Directive extends producer
responsibilities and requires that the Member States establish waste management
plans as well as waste prevention programs (Directive 2008/98/EC 2008).
However, based on the review of the progress towards achieving the Strategy’s
objectives, experts have stated that despite an improvement of legislation, increased
2.1 Legislation
11
recycling rates, a reduction of the amount of waste going to landfill and of the relative
environmental impacts per ton of waste treated, after 5 years, the Strategy’s main
objectives still remain valid (European Commission Report COM (2011) 13 2011).
Another important directive that sets out the main requirements for waste disposal is the EU Landfill Directive (1999/31/EC) (Council Directive 1999/31/EC
1999). It is necessary to stress that by defining the term ‘waste’ the directive refers
to the Council Directive on waste (75/442/EC) from 1975 (Council Directive 75/
442/EEC 1975). The document includes a definition of waste types with no reference to the waste list adopted in Commission Decision 2000/532/EC (2000)
(Commision Decision 2000/532/EC 2000), which could result in collisions, confusions, and a necessary revision of the Directive.
The Directive sets maximum capacities for landfill sites and defines targets for
the reduction of biodegradable municipal waste (BMW) going to landfills. It also
bans certain waste streams from being put into landfill sites. The document requires
the member states to set up a national strategy for operations aimed at the reduction
of BMW, such as recycling, composting, recovery and biogas production. It contains requirements for opening and maintaining a landfill during its operational and
after-care phases (Council Directive 1999/31/EC 1999).
However, the results of the assessment of achievements in this area show that in
2010 despite significant successes in increasing material recycling the majority of
the European countries still send more than half of their municipal waste to landfill
(EEA 2013a).
The next significant document is the Directive (94/62/EC as amended by 2004/
12/EC 2004) on packaging and packaging waste (European Parliament and Council
Directive 94/62/EC 1994; Directive 2004/12/EC 2004), which takes precedence
over the Waste Framework Directive where packaging and packaging waste are
concerned (Arcadis et al. 2010). The document clarifies the definition of the term
‘waste’, by introducing a number of additional criteria and defines such operations
as ‘recovery’, ‘recycling’, ‘energy recovery’, ‘organic recycling’ and ‘disposal’. It
also obliges the member states to set up return, collection and energy recovery
systems, and to encourage the use of materials obtained from recycled packaging
waste. A reduction of the overall volume of packaging is stated as the best means of
preventing the creation of packaging waste. The document discusses a necessity of
a harmonized reporting technique and clear guidelines for data provision. It also
requires implementation of preventive measures with an emphasis on the minimization of environmental impact (Directive 2004/12/EC 2004).
2.2 Waste Management Hierarchy
Looking at food waste historically, The early 1970s could be considered as a
turning point for waste management in Europe. The 1972 Report to the Club of
Rome and the oil crisis in 1973 drew attention to an issue of the scarcity of raw
materials. These events induced the change in societys’ perception of the term
12
2 Literature Review
‘waste’, methods of waste handling and necessary transitions in waste management
(Kemp and van Lente 2011). In 1979, a Dutch politician Ad Lansink developed a
priority list for the various waste management methods, which became known as
‘Lansink’s Ladder’ and became official policy in 1981 (Raven 2007). At the top of
the Ladder is ‘prevention of waste’, followed by ‘re-use (of products)’, ‘recycling
(of materials)’, ‘incineration (with energy-production)’ and ‘landfilling’ as the last
option (Kemp and van Lente 2011).
Today’s waste prevention framework, which uses the ‘Lansink’s Ladder’ as a
prototype, is widely used in various waste related areas such as legislation and
numerous projects, initiatives and strategies. The current framework is a five-step
hierarchy of waste management and waste treatment options ordered according to
what is best for the environment (UK Department of Energy and Climate Change
and Defra 2011). It is a set of rules for waste management planning, qualified waste
collection and treatment (Neubauer 2007). Such a framework is helpful for
understanding how management approaches can be used to influence materials as
they flow through the material life cycle (U.S. EPA 2009). However, in each
particular case the hierarchy passes through “modifications”. Having waste prevention as a final goal, different expert groups and institutions adjust the waste
hierarchy by extending or narrowing the content of its stages.
In the US it is implemented by the U.S. Environmental Protection Agency
(EPA). The EPA works under the Resource Conservation and Recovery Act, primary law, which governs the disposal of solid and hazardous waste in the country.
Under this law the EPA encourages practices that reduce the amount of waste
needing to be disposed of, such as waste prevention, recycling, and composting (U.
S. EPA 2013b). The agency has ranked the most environmentally preferable
options for waste management from ‘source reduction’ (including reuse) to
‘treatment and disposal’, with ‘recycling’, ‘composting’ and ‘energy recovery’
between (Fig. 2.1) (U.S. EPA 2012b).
Fig. 2.1 Waste Management
Hierarchy (U.S. EPA 2012b)
2.2 Waste Management Hierarchy
13
Fig. 2.2 Waste hierarchy
(UNEP Division of
Technology, Industry and
Economics International
Environmental Technology
Centre 2010)
UNEP’s various programmes and projects also endeavour to align with the waste
management hierarchy (Fig. 2.2) used by the International Solid Waste Association
(UNEP Division of Technology, Industry and Economics International Environmental Technology Centre 2010).
The association describes the hierarchy as ‘a valuable conceptual and political
prioritisation tool which can assist in developing waste management strategies
aimed at limiting resource consumption and protecting the environment’ (ISWA
2009).
A waste management hierarchy is also a framework used in the approach of
Integrated Solid Waste Management (ISWM) (Fig. 2.3). This strategic concept is
used for managing all sources of waste: prioritising waste avoidance and minimisation; practicing segregation; promoting the 3Rs (Reduce, Re-use, Recycle);
implementing safe waste transportation; and treatment and disposal in an integrated
manner with an emphasis on maximising resource-use efficiency (UNEP 2011).
Encouraged by the Thematic Strategy on the Prevention and Recycling of Waste
(Commission of the European Communities Communication COM (2005) 666
2005), the EU waste policy has put an increasing focus on waste prevention
(WRAP 2012). The waste management hierarchy and its stages (Fig. 2.4) are
defined in the WFD.