Nuclear Power Deployment Operation and Sustainability Part 12 docx
Bạn đang xem bản rút gọn của tài liệu. Xem và tải ngay bản đầy đủ của tài liệu tại đây (2.48 MB, 35 trang )
Nuclear Power – Deployment, Operation and Sustainability
374
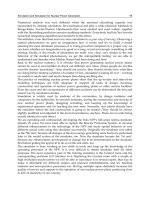
FUJI-U3. Therefore, two different designs of MSR can be used since 2029. Spent fuel salt
from FUJI-U3 is also reprocessed after one batch cycle and fed to next generation of FUJI-U3.
Capacity of LWR is 948 GWe and that of MSR including both FUJI-Pu2 and FUJI-U3 is 392
GWe at around 2050. Thorium MSR also produces its own spent fuel. However the amount
is considerably smaller than the amount from uranium LWR. This is because spent fuel of
thorium MSR comes out of reactor after its lifetime being 30 years. On the other hand, spent
fuel of LWR occurs every year. It is estimated here that thorium MSR will be
commercialized in 2020's. Therefore, spent fuel of thorium MSR will appear around 2050's.
Its quantitative evaluation has been demonstrated in the previous work (Kamei, 2008).
0
0.1
0.2
0.3
0.4
0.5
0.6
0.7
0.8
0.9
1
2000 2010 2020 2030 2040 2050
Electricity Capacity [10
3
GWe]
0
100
200
300
400
500
600
700
800
900
1,000
Storage of Spent Fuel [10
3
t]
Electricity capacity of FUJI-U3
Electricity capacity of FUJI-Pu2
Spent fuel (without MSR)
Spent fuel (with MSR)
Electricity capacity of LWR
FUJI-U3
FUJI-Pu2
Fig. 3. Calculation result of Implementation capacity of thorium MSR (case 1)
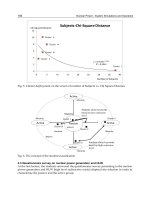
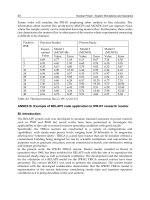
Other result is shown in Fig. 4. It is assumed here that capacity of uranium fuel cycle will be
constant within next 40 years by considering the effect of Fukushima Daiichi nuclear power
plant accident. In this case, implementation capacity of thorium MSR will be about 258 GWe
around at 2050, which is small because supply of fissile plutonium is reduced.
Implementation Strategy of Thorium Nuclear Power in the Context of Global Warming
375
0
0.1
0.2
0.3
0.4
0.5
0.6
0.7
0.8
0.9
1
2000 2010 2020 2030 2040 2050
Electricity Capacity [10
3
GWe]
0
100
200
300
400
500
600
700
800
900
1,000
Storage of Spent Fuel [10
3
t]
Electricity capacity of FUJI-U3
Electricity capacity of FUJI-Pu2
Spent fuel (without MSR)
Spent fuel (with MSR)
Electricity capacity of LWR
FUJI-U3
FUJI-Pu2
FUJI-Pu2
Fig. 4. Calculation result of Implementation capacity of thorium MSR (case 2)
The amount of plutonium from dismantled weapon head is estimated to be about 91.9 t and
145 t for the USA and Russia, respectively (International Panel on Fissile Materials, 2008).
Additional 40 t of plutonium can be separated based on the agreement between the USA
and Russia to reduce number of nuclear weapons to be 2,000. Briefly speaking, contribution
of plutonium from weapon head is about 15 GWe around at 2050 to additionally implement
thorium MSR to the implementation capacity by spent nuclear fuel from uranium fuel cycle.
6. Sustainable development with thorium utilization
In this section, relation between thorium utilization and its surroundings will be discussed
in a view of comprehensive approach on sustainable development. The key issues are
protection of radioactive hazard by thorium, rare-earth production accompanied with
thorium, electric vehicle using lots of rare-earth and CO
2
reduction from human activities.
6.1 Production of thorium as by-product of rare-earth
One of the important sectors to reduce CO
2
emission is transportation sector. Many motor
companies have presented to supply EV or hybrid-vehicle (HV) recently as summarized in
Nuclear Power – Deployment, Operation and Sustainability
376
Table 4. Reborn GM in 2009 put EV for their new backbone like “Chevrolet Volt”. Chevrolet
Volt was given the award of 2011 Green Car of the Year. Many new EV companies appeared
in China, which became the world largest production and sales of cars. BYD, which was just
a battery company, is one of the most famous EV companies in China.
Country Company Brand
Japan Toyota Prius (HV)
Nissan Leaf (EV)
Honda Insight (HV), CR-Z (HV)
Mitsubishi i-MiEV (EV)
EU VW New compact coupe (HV)
Audi e-tron (EV)
BMW MINI E (EV)
Daimler Smart EV (EV)
Renault Z. E. (EV)
PSA OEM, Mitsubishi (EV)
USA GM Chevrolet Volt (EV)
Ford Focus EV (EV)
Tesla motors Roadster (EV)
Korea Hyundai i10 electric (EV)
China BYD e6 (EV)
India Tata Indica Vista EV (EV)
Table 4. Development of Low-Carbon Vehicle
Rare-earth materials such as neodymium and dysprosium are minerals for fabricating a
strong permanent magnetic of electric motor. World annual production of rare-earth
materials is about 120 thousands t at 2010 (Watanabe, 2008). The production amount is
expected to increase at about 3 or 5 % every year. At moment, China shares 97 % of rare-
earth production in the world. These materials can be mined from other Asian countries,
too. However, accompanying thorium as by-product of rare-earth mining becomes a
radioactive waste having possibility to bring environmental hazard (Nishikawa, 2010).
Thorium is not commercially used as nuclear fuel until now. It has been left as radioactive
waste, which become environmental and social concerns at the resource countries. Detail
investigation is needed but roughly residual thorium is estimated to be produced at least 10
thousand t every year. This makes it difficult for Japanese trade companies to find rare-
earth.
6.2 Consumption of thorium
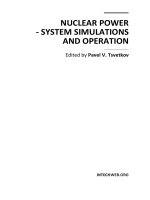
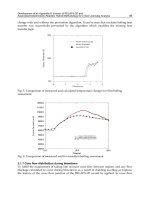
Consumption of thorium has been simulated by using the capacity of thorium fuel cycle
demonstrated in the previous section. The result is shown in Fig. 5.
Here, it is assumed that 1 % of rare-earth production corresponds to the amount of thorium.
It is also assumed that initial value of thorium storage at 2005 is zero. Typical designs of
thorium MSR, FUJI-Pu2 and FUJI-U3, require 31.3 t and 56.4 t of thorium as initial value,
respectively. Stockpile of thorium will be about 40 thousand t around at 2024, when
commercial utilization of thorium MSR begins. Though stockpile of thorium will be
accumulated by production of rare-earth, thorium is also consumed and the stockpile will
Implementation Strategy of Thorium Nuclear Power in the Context of Global Warming
377
be about 60 thousand t around at 2050. If there is no utilization of thorium, its stockpile will
be more than 130 thousand t.
0
20
40
60
80
100
120
140
160
180
2005 2015 2025 2035 2045
Thorium [10
3
t]
0
100
200
300
400
500
600
Rare-earth [10
3
t]
Accumulation of thorium (without utilization)
Total requiremen of thorium as fuel
Accumulation of thorium (with utilization)
Annual production of rare-earth
Fig. 5. Consumption of thorium.
6.3 CO
2
reduction from transportation sector
CO
2
emission from transportation sector has been simulated based on the prediction of
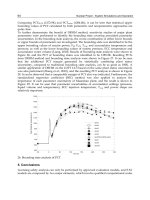
capacity of thorium MSR also described in the previous section. The result is shown in Fig. 6.
It is assumed here that number of vehicles increases with 3.5% of growth rate, which is same
to the recent trend (The Japan Automobile Manufacturers Association, 2009). Number of
vehicle in the world around at 2005 is about 900 million. This emitted 4.5 Gt of CO
2
. Number
of vehicle will be about 4 billion around at 2050 emitting 18.6 Gt of CO
2
. If 100 million EV
are supplied every year since 2010, all vehicles can be replaced with EV at 2050. Even
though this estimation is somewhat large, it is assumed in order to evaluate higher case of
CO
2
reduction. 392 GWe of thorium MSR can supply electricity to 2.75 billion EV. This is
obtained that EV is supplied its electricity by thorium MSR with 80 % of load factor. It is
assumed that one EV can drive 10 km per 1 kWh, drives averaged 10,000 km in a year. This
corresponds to 60 million t of CO
2
emission from thorium MSR. This was calculated that 1
kWh of nuclear power emits 0.022 kg with its load factor being 80 %. If the rest of 1.25
billion cars are also EV and supplied its electricity by coal fire plant, CO
2
emission is 1.23 Gt.
It was assumed that coal fire plant emits 0.975 kg of CO
2
per 1 kWh. Total CO
2
emission is
Nuclear Power – Deployment, Operation and Sustainability
378
1.29 Gt both from thorium MSR and coal fire plant. It can be seen that collaborative
implementation of thorium MSR and EV has a great potential to CO
2
reduction by solving
the problem of sectoral approach.
0
2
4
6
8
10
12
14
16
18
20
2005 2015 2025 2035 2045
CO
2
emission from cars [Gt]
0
10
20
30
40
50
60
70
80
90
100
CO
2
emission from thorium nuclear power [Mt]
From cars(all cars are gasoline cars)
From gasoline cars (rest of EV)
From EV(supplied only by coal fire plant)
From coal fire plant (rest of thorium nuclear power)
From EV (by both thorium and coal)
From thorium nuclear power (for supplying EV)
Fig. 6. CO
2
reduction by thorium utilization.
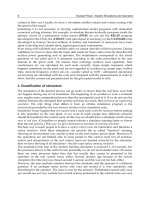
6.4 Concept of “The Bank”
Implementation capacity of thorium MSR is limited by the amount of supply of fissile
material. Thorium is recognized as radioactive waste and residual of rare-earth mining. As
indicated in the Fig.5, thorium will not be necessarily completely consumed even though it
is utilized as nuclear fuel. Therefore, there is a possibility that thorium, which is not
managed correctly, cause environmental hazard. In order to promote progress of EV for the
reduction of CO
2
emission from transportation sector, rare-earth mining is indispensable.
Thus it is also necessary to manage thorium for keeping environment healthy. Estimation of
implementation capacity of thorium MSR is based on the supply of fissile material from
uranium fuel cycle since thorium does not contain its own fissionable isotope. And the other
important point is that it will need more than 10 years for the first commercial
implementation of thorium nuclear power. There are several countries, which hold thorium
Implementation Strategy of Thorium Nuclear Power in the Context of Global Warming
379
as future energy source like India, but most of the countries have no plan to store thorium.
Therefore it is necessary to storage thorium. Such an idea proposed here is called “The
Bank”. This is named from “thorium energy bank”. Outline of “The Bank” is illustrated in
Fig. 7.
Country of thorium
nuclear power
Country of
“THE BANK”
Country of rare-earth
mining and use,
thorium nuclear power
Country of rare-
earth use
Country of rare-earth
mining and use
Country of rare-earth mining
Debt (Th,
233
U)
Return (Th)
Interest (
233
U)
Profit:
-Security
-Guarantee
-Low cost
Deposit (Th)
Rare-earth
Thorium (Th)
Fissile (
233
U)
Profit:
-Environment
-Commodity
Function of “The Bank”:
-Storage (Th,
233
U, FP, TRU)
-Reprocessing
-Fuel fabrication
The Bank
THorium Energy Bank
The Bank
THorium Energy Bank
Deposit (Th)
Fig. 7. Concept of “The Bank”.
The most important purpose of “The Bank” is to store thorium obtained as residual of rare-
earth mining. This is mainly for protecting environment of mining country of rare-earth
from radioactive thorium. The other function is to lend thorium to countries, which does not
own its thorium resource. Former US president Jimmy Carter proposed a concept of a
nuclear fuel bank. This is to provide fissile material, enriched uranium, in order not to
expand the technology of enrichment having fear of nuclear proliferation. Similar proposal
was also brought from former director of IAEA, Dr. El Baradei. US President Obama also
indicated at the speech in Prague, 2009 that the concept of nuclear fuel bank will be an
important role to bring peace nuclear power. “The Bank” accepts both thorium and
uranium-233 as fertile material and as fissile material, respectively.
However, “The Bank” will not have any uranium- 233 at the beginning of its operation.
Thus other fissile material such as plutonium must be provided from uranium fuel cycle.
Once thorium fuel is used at some country, the spent thorium fuel will be returned to “The
Bank”. Uranium-233 is the interest of debt of thorium. Trend of demand toward rare-earth
and thorium will be different. Rare-earth is now eagerly required but thorium is not now.
“The Bank” will be an international organization. Head office of “The Bank” can be located
in Norway, Sweden, Australia and Japan, which have no risk of nuclear proliferation. It will
Nuclear Power – Deployment, Operation and Sustainability
380
be better that the country of the head office has an ability to handle radioactive material. The
head office will have several functions. One of the functions is to store separated thorium
during the refining process of rare-earth mining. The stored thorium can be lent to
countries. These countries have to return both thorium and fissionable uranium-233 in the
spent thorium fuel to “The Bank”. Uranium-233 is produced by absorption of neutron of
thorium. Uranium-233 is the interest against the debt of thorium from “The Bank”. As far as
the capacity of thorium nuclear power in the world is limited by the supply of plutonium
from uranium fuel cycle, amount of produced thorium from rare-earth mining is larger than
the consumption of thorium as nuclear fuel. Thus, price of thorium will be kept at low level.
The other function of “The Bank” is reprocessing of spent thorium fuel. If LWR or HWR are
used as power reactor, solid fuel rod including thorium and fissile materials (uranium-233
or plutonium) will be returned. If MSR is used, frozen fuel salt will be returned. For the
former case, direct fluorination method called FERDA will be able to apply obtaining
plutonium and uranium-233 from solid spent fuel. For the latter case, dry-process method
using molten-salt will be available for reprocessing.
The last function of “The Bank” is to fabricate thorium fuel. If countries plan to implement
thorium nuclear power, there is a possibility that it is not allowed to have fuel fabricating
facility depending on the international discussion. United Arab Emirates (UAE) can be
considered as such a case. UAE has signed with the USA in the agreement of nuclear power.
UAE implements nuclear power plant but they do not have enrichment and reprocessing
facilities. Nuclear fuel will be fed by the USA and spent nuclear fuel will be sent to France or
other countries. “The Bank” will have several branch offices. The function of the branch
office will just to store and lend thorium.
It is not necessarily request to all the countries to join this frame of “The Bank”. Some
countries such as India having thorium resource and functions of re-processing and fuel
fabrication can continue their own plans. The function of “The Bank” will be attractive to the
countries having rare-earth resources but having no plan to utilize thorium. Countries in the
South-East Asia such as Vietnam or Myanmar will correspond to this case.
Recently, there are many researches on breeding of uranium-233 from thorium by utilizing
accelerator or fusion technologies. However it is estimated to take more than 20 years to be
commercialization. Therefore it is necessary to store thorium until such a wide utilization.
7. Conclusion
In this chapter, emerging tendency of thorium nuclear power has been introduced. It is
impossible to describe all information running in the world at this time. However, outline of
thorium utilization could be explained. Though thorium utilization has a very attractive
feature, quantitative evaluation will be necessary to make a new energy supply vision in the
near future. Implementation strategy of thorium fuel cycle discussed in this chapter will be a
help for such a purpose. Several results demonstrated here based on the mass-balance of
fissile materials show that thorium nuclear power will be available but still be limited. In
spite of this result, it should not be said that thorium nuclear power is not enough. The
concept of sustainability contains lots of different aspects. If thorium is not correctly used, it
becomes an environmental hazard. However, if thorium is used, it produces clean and safe
energy. We learned that present uranium LWR has a possibility of severe accident from
Fukushima Daiichi nuclear power plant. However, most countries do not have huge
earthquake. Therefore, uranium LWR can be used by enhancing its safety. Thorium fuel
Implementation Strategy of Thorium Nuclear Power in the Context of Global Warming
381
cycle will be introduced with a collaboration of this established uranium fuel cycle which
supplies plutonium as fissile material to thorium fuel cycle. Though more detailed scenario
for the implementation of thorium fuel cycle will be needed including fuel reprocessing, an
international frame work for nuclear safeguard, thorium fuel cycle has an attractive option
to provide carbon-free primary energy source.
8. References
Dean, T. (2007). New age nuclear, COSMOS, Vol. 8, pp.40-49
Garber, K. (2009). Taking Some Risk out of Nuclear Power, U.S.News & World Report, Vol.
146, No. 3, pp.70-72
Howard, M., & Graham, T. (2007). The Lost Chance, Newsweek, Feb., pp.63
Furukawa, K., Lecocq, A., Kato, Y., & Mitachi. K. (1990). Summary report: thorium molten-
salt nuclear energy synergetics, Journal of nuclear science and technology, Vol. 27,
pp.1157-1178
Furukawa, K., Arakawa, K., Erbay, L. B., Ito Y., Kato Y., Kiyavitskaya H., Lecocq A., Mitachi
K., Moir R., Numata H., Pleasant J. P., Sato Y., Shimazu Y., Simonenco V.A., Sood
D. D., Urban C., & Yoshioka, R. (2008). A road map for the realization of global-
scale thorium breeding fuel cycle by single molten-fluoride flow. Energy Conversion
& Management, Vol. 49, pp.1832-1848
Future Summit Report. (2008). Future Summit 2008
Honma, Y. & Shimazu, Y. (2007). Fuel Cycle Study on Pu-Th based Molten Salt Reactors for
Sustainable Fuel Supply, Proceedings of TU2007, Beijing, China, December 4-6, 2007
International Atomic Energy Agency. (2005). Thorium fuel cycle - Potential benefits and
challenges
International Energy Agency. (2007). CO2 Emissions from Fuel Combustion 1971-2005
International Energy Agency. (2009). World energy outlook
International Panel on Fissile Materials. (2008). Global Fissile Material Report 2008
Kamei, T. (2008). Evaluation index of sustainable energy supply technique and its analysis,
Proceedings of 2nd international symposium on symbiotic nuclear power systems for 21st
century, Harbin, China, September 8-10, 2008
Kamei, T., Mitachi, K., Kato Y., & Furukawa K. (2008). A new energy system suitable for the
sustainable society: THORIMS-NES - fuels and radio-wastes, Proceedings of MS8,
Kobe, Japan, October 19-23, 2008
Kamei, T., Kato Y., Mitachi, K., Shimazu, Y., & Furukawa K. (2009). Thorium molten-salt
nuclear energy synergetics for the huge size fission industry, Proceedings of ANFM
2009, Pittsburgh, USA, April 12-15, 2009
Knight, S. (2008). New Power Generation, The Financial Times, May 31st, pp.1-7
Mitachi, K., Yamamoto, T., & Yoshioka, R. (2007). Self-sustaining Core Design for 200 MWe
Molten-Salt Reactor with Thorium-Uranium Fuel: FUJI-U3-(0), Proceedings of
TU2007, Beijing, China, December 4-6, 2007
Moir, R. W. (2002). Cost of electricity from molten salt reactors (MSR), Nuclear technology,
Vol. 138, pp.93-95
Nishikawa, Y. (2010). Thorium and Rare-earth resources, Annual report of Metal Economics
Research Institute, No. 163
Peachey, C. (2009). A thought for thorium. Nuclear engineering international, SEP., pp.33-34
Nuclear Power – Deployment, Operation and Sustainability
382
Rosental, MW., Haubenreich, PN., & Briggs, RB. (1972). The Develop. Status of Molten-Salt
Breeder Reactors, ORNL-4812
Roy, C., & Robertson, C. (1971). Conceptual Design Study of a Single-Fluid Molten-Salt
Breeder Reactor, ORNL-4541
Suzuki, T. (2009). Towards Nuclear Disarmament and Non-Proliferation:10 Proposals from
Japan, 11.02.2010, Available from
The Japan Automobile Manufacturers Association, Inc. (2009). World Motor Vehicle Statistics
The Ministry of Petroleum and Energy of Norway. (2008). Thorium as an energy source
thorium as an energy source - opportunities for Norway, 06.05.2009, Available from
Uhlir, J., Marecek, M., & Precek, M. (2008). Progress in development of Fluoride volatility
reprocessing technology, Proceedings of ATALANTE 2008, Montpellier, France, May
18-22, 2008
USGS. (2009). Thorium Minerals Yearbook
Watanabe, N. (2008). Rare-earth research and development, AIST Today, Vol.8, No. 5
Weinberg, A. (1997). The proto-history of the molten salt system, Journal of acceleration plasma
research, Vol. 2, pp.23-6
16
Thorium Fission and Fission-Fusion Fuel Cycle
Magdi Ragheb
Department of Nuclear, Plasma and Radiological Engineering
University of Illinois at Urbana-Champaign
216 Talbot Laboratory, Urbana, Illinois
USA
1. Introduction
With the present-day availability of fissile U
235
and Pu
239
, as well as fusion and accelerator
neutron sources, a fresh look at the Thorium-U
233
fuel cycle is warranted. Thorium, as an
unexploited energy resource, is about four times more abundant than uranium in the Earth’s
crust and presents a more abundant fuel resource as shown in Table 1.
Element Symbol Abundance
[gms / ton]
Lead Pb 16
Gallium Ga 15
Thorium Th 10
Samarium Sm 7
Gadolinium Gd 6
Praseodymium Pr 6
Boron B 3
Bromine Br 3
Uranium U 2.5
Beryllium Be 2
Tin Sn 1.5
Tungsten W 1
Molybdenum Mo 1
Mercury Hg 0.2
Silver Ag 0.1
Uranium
235
U
235
0.018
Platinum Pt 0.005
Gold Au 0.02
Table 1. Relative abundances of some elements in the Earth’s crust.
Nuclear Power – Deployment, Operation and Sustainability
384
Fig. 1. Thorium dioxide with 1 percent cerium oxide impregnated fabric, Welsbach
incandescent gas mantles (left) and ThO
2
flakes (right). Yttrium compounds now substitute
for Th in mantles.
2. Properties of thorium
Thorium (Th) is named after Thor, the Scandinavian god of war. It occurs in nature in the
form of a single isotope: Th
232
. Twelve artificial isotopes are known for Th. It occurs in
Thorite, (Th,U)SiO
4
and Thorianite (ThO
2
+ UO
2
). It is four times as abundant as uranium
and is slightly less abundant than lead.
It can be commercially extracted from the Monazite placer deposit mineral containing 3-22
percent ThO
2
with other rare earth elements or lanthanides. Its large abundance makes it a
valuable resource for electrical energy generation with supplies exceeding both coal and
uranium combined. This would depend on breeding of the fissile isotope U
233
from thorium
according to the breeding reactions:
1 232 233
090 90
233 233 0 *
90 91 -1
233 233 0 *
91 92 -1
1 232 233 0 *
090 92 -1
n + Th Th +
Th Pa + e + +
Pa U + e + +
__________________________________
n + Th U + 2 e + 2 3
(1)
Together with uranium, its radioactive decay chain leads to the stable Pb
208
lead isotope
with a half-life of 1.4 x 10
10
years for Th
232
. It contributes to the internal heat generation in
the Earth, together with other radioactive elements such as U and K
40
.
As Th
232
decays into the stable Pb
208
isotope, radon
220
or thoron forms in the decay chain.
Rn
220
has a low boiling point and exists in gaseous form at room temperature. It poses a
radiation hazard through its own daughter nuclei and requires adequate ventilation in
underground mining. Radon tests are needed to check for its presence in new homes that
are possibly built on rocks like granite or sediments like shale or phosphate rock containing
significant amounts of thorium. Adequate ventilation of homes that are over-insulated
becomes a design consideration in this case.
Thorium, in the metallic form, can be produced by reduction of ThO
2
using calcium or
magnesium. It can also be produced by electrolysis of anhydrous thorium chloride in a
fused mixture of Na and K chlorides, by calcium reduction of Th tetrachloride mixed with
anhydrous zinc chloride, and by reduction with an alkali metal of Th tetrachloride.
Thorium Fission and Fission-Fusion Fuel Cycle
385
Thorium is the second member of the actinides series in the periodic table of the elements.
When pure, it is soft and ductile, can be cold-rolled and drawn and it is a silvery white metal
retaining its luster in air for several months. If contaminated by the oxide, it tarnishes in air
into a gray then black color oxide (Fig. 1).
Thorium oxide has the highest melting temperature of all the oxides at 3,300 degrees C. Just
a few other elements and compounds have a higher melting point such as tungsten and
tantalum carbide. Water attacks it slowly, and acids do not attack it except for hydrochloric
acid.
Thorium in the powder form is pyrophyric and can burn in air with a bright white light. In
portable gas lights the Welsbach mantle is prepared with ThO
2
with 1 percent cerium oxide
and other ingredients (Fig. 1).
As an alloying element in magnesium, it gives high strength and creep resistance at high
temperatures.
Tungsten wire and electrodes used in electrical and electronic equipment such as electron
guns in x-ray tubes or video screens are coated with Th due to its low work function and
associated high electron emission. Its oxide is used to control the grain size of tungsten used
in light bulbs and in high temperature laboratory crucibles.
Glasses for lenses in cameras and scientific instruments are doped with Th to give them a
high refractive index and low dispersion of light.
In the petroleum industry, it is used as a catalyst in the conversion of ammonia to nitric acid,
in oil cracking, and in the production of sulfuric acid.
3. Advantages of the thorium fuel cycle
The following advantages of the thorium fuel cycle over the U
235
-Pu
239
fuel cycle have been
suggested:
1.
Breeding is possible in both the thermal and fast parts of the neutron spectrum with a
regeneration factor of η > 2.
2.
Expanded nuclear fuel resources due to the higher abundance of the fertile Th
232
than
U
238
. The USA resources in the state of Idaho are estimated to reach 600,000 tons of 30
percent of Th oxides. The probable reserves amount to 1.5 million tons. There exists
about 3,000 tons of already milled thorium in a USA strategic stockpile stored in the
state of Nevada.
3.
Lower nuclear proliferation concerns due to the reduced limited needs for enrichment
of the U
235
isotope that is needed for starting up the fission cycle and can then be later
replaced by the bred U
233
. The fission-fusion hybrid totally eliminates that need (Bethe,
1978). An attempted U
233
weapon test is rumored to have evolved into a fizzle because
of the presence of the U
232
isotope contaminant concentration and its daughter products
could not be reduced to a practical level.
4.
A superior system of handling fission product wastes than other nuclear technologies
and a much lower production of the long-lived transuranic elements as waste. One ton
of natural Th
232
, not requiring enrichment, is needed to power a 1,000 MWe reactor per
year compared with about 33 tons of uranium solid fuel to produce the same amount of
power. Thorium would be first purified then converted into a fluoride. The same initial
fuel loading of one ton/year is discharged primarily as fission products to be disposed
of for the fission thorium cycle.
5.
Ease of separation of the lower volume and short lived fission products for eventual
disposal.
Nuclear Power – Deployment, Operation and Sustainability
386
Fig. 2. Regeneration factor as a function of neutron energy for the different fissile isotopes.
6.
Higher fuel burnup and fuel utilization than the U
235
-Pu
239
cycle.
7.
Enhanced nuclear safety associated with better temperature and void reactivity
coefficients and lower excess reactivity in the core. Upon being drained from its reactor
vessel, a thorium molten salt would solidify shutting down the chain reaction,
8.
With a tailored breeding ratio of unity, a fission thorium fueled reactor can generate its
own fuel, after a small amount of fissile fuel is used as an initial loading.
9.
The operation at high temperature implies higher thermal efficiency with a Brayton gas
turbine cycle (thermal efficiency around 40-50 percent) instead of a Joule or Rankine
steam cycle (thermal efficiency around 33 percent), and lower waste heat that can be
used for process heat for hydrogen production, sea water desalination or space heating.
An open air cooled cycle can be contemplated eliminating the need for cooling water
and the associated heat exchange equipment in arid areas of the world (Fig. 3.).
10.
A thorium cycle for base-load electrical operation would provide a perfect match to
peak-load cycle wind turbines generation. The produced wind energy can be stored as
compressed air which would be used to cool a thorium open cycle reactor, substantially
increasing its thermal efficiency, yet not requiring a water supply for cooling.
11.
The unit powers are scalable over a wide range for different applications such as
process heat or electrical production. Small units of 100 MWe of capacity each can be
designed, built and combined for larger power needs.
12.
Operation at atmospheric pressure for a molten salt as a coolant without pressurization
implies the use of standard equipment with a lower cost than the equipment operated
at a 1,000-2,000 psi high pressure in the Light Water Reactor (LWRs) cycle.
Depressurization would cause the pressurized water coolant to flash into steam and a
loss of coolant.
Thorium Fission and Fission-Fusion Fuel Cycle
387
13. In uranium-fuelled thermal reactors, without breeding, only 0.72 percent or 1/139 of the
uranium is burned as U
235
. If we assume that about 40 percent of the thorium can be
converted into U
233
then fissionned, this would lead to an energy efficiency ratio of 139
x 0.40 = 55.6 or 5,560 percent more efficient use of the available resource compared with
U
235
.
14.
Operational experience exists from the Molten Salt reactor experiment (MSRE) at Oak
Ridge National Laboratory (ORNL), Tennessee. A thorium fluoride salt was not
corrosive to the nickel alloy: Hastelloy-N. Corrosion was caused only from tellurium, a
fission product (Ragheb et. al., 1980).
Fig. 3. Dry cooling tower in foreground, wet cooling tower in background in the THTR-300
pebble bed Th reactor, Germany.
Four approaches to a thorium reactor are under consideration:
1. Use of a liquid molten Th fluoride salt,
2. Use of a pebble bed graphite moderated and He gas cooled reactor,
3. The use of a seed and blanket solid fuel with a thermal Light Water Reactor (LWR)
cycle,
4. A driven system using fusion or accelerator generated neutrons.
4. Thorium abundance
Thorium is four times as abundant than uranium in the Earth’s crust and provides a fertile
isotope for breeding of the fissile uranium isotope U
233
in a thermal or fast neutron
spectrum.
In the Shippingport reactor it was used in the oxide form. In the HTGR it was used in
metallic form embedded in graphite. The MSBR used graphite as a moderator and hence
was a thermal breeder and a chemically stable fluoride salt, eliminating the need to process
or to dispose of fabricated solid fuel elements. The fluid fuel allows the separation of the
Nuclear Power – Deployment, Operation and Sustainability
388
stable and radioactive fission products for disposal. It also offers the possibility of burning
existing actinides elements and does need an enrichment process like the U
235
-Pu
239
fuel
cycle.
Thorium is abundant in the Earth’s crust, estimated at 120 trillion tons. The Monazite black
sand deposits are composed of 3-22 percent of thorium. It can be extracted from granite
rocks and from phosphate rock deposits, rare earths, tin ores, coal and uranium mines
tailings.
It has even been suggested that it can be extracted from the ash of coal power plants. A 1,000
MWe coal power plant generates about 13 tons of thorium per year in its ash. Each ton of
thorium can in turn generate 1,000 MWe of power in a well optimized thorium reactor. Thus
a coal power plant can conceptually fuel 13 thorium plants of its own power. From a
different perspective, 1 pound of Th has the energy equivalent of 5,000 tons of coal. There
are 31 pounds of Th in 5,000 tons of coal. If the Th were extracted from the coal, it would
thus yield 31 times the energy equivalent of the coal.
The calcium sulfate or phospho-gypsum resulting as a waste from phosphorites or
phosphate rocks processing into phosphate fertilizer contains substantial amounts of
unextracted thorium and uranium.
Uranium mines with brannerite ores generated millions of tons of surface tailings containing
thoria and rare earths.
The United States Geological Survey (USGS), as of 2010, estimated that the USA has reserves
of 440,000 tons of thorium ore. A large part is located on properties held by Thorium Energy
Inc. at Lemhi Pass in Montana and Idaho (Fig. 5). This compares to a previously estimated
160,000 tons for the entire USA.
The next highest global thorium ores estimates are for Australia at 300,000 tons and India
with 290,000 tons.
5. Thorium primary minerals
Thorium occurs in several minerals:
1. Monazite, (Ce,La,Y,Th)PO
4
, a rare earth-thorium phosphate with 5-5.5 hardness. Its
content in Th is 3-22 percent with 14 percent rare earth elements and yttrium. It occurs
as a yellowish, reddish-brown to brown, with shades of green, nearly white, yellowish
brown and yellow ore. This is the primary source of the world’s thorium production.
Until World War II, thorium was extracted from Monazite as a primary product for use
in products such as camping lamp mantles. After World War II, Monazite has been
primarily mined for its rare earth elements content. Thorium was extracted in small
amounts and mainly discarded as waste.
2. Thorite, (Th,U)SiO
4
is a thorium-uranium silicate with a 4.5 hardness with yellow,
yellow-brown, red-brown, green, and orange to black colors. It shares a 22 percent Th
and a 22 percent U content. This ore has been used as a source of uranium, particularly
the uranium rich uranothorite, and orangite; an orange colored calcium-rich thorite
variety.
3. Brocktite, (Ca,Th,Ce)(PO
4
)H
2
O.
4. Xenotime, (Y,Th)PO
4
.
5. Euxenite, (Y,Ca,Ce,U,Th)(Nb,Ta,Ti)
2
O
6
.
6. Iron ore, (Fe)-rare earth elements-Th-apatite, Freta deposits at Pea Ridge, Missouri,
Mineville, New York, and Scrub Oaks, New Jersey.
Thorium Fission and Fission-Fusion Fuel Cycle
389
Ore Composition
Thorite (Th,U)SiO
4
Thorianite (ThO
2
+ UO
2
)
Thorogummite Th(SiO4)
1-x
(OH)
4x
Monazite (Ce,La,Y,Th)PO
4
Brocktite (Ca,Th,Ce)(PO
4
)H
2
O
Xenotime (Y,Th)PO
4
Euxenite (Y,Ca,Ce,U,Th)(Nb,Ta,Ti)
2
O
6
Iron ore Fe + rare earths + Th apatite
Table 2. Major Thorium ores compositions.
6. Global and USA thorium resources
Estimates of the available Th resources vary widely. The largest known resources of Th
occur in the USA followed in order by Australia, India, Canada, South Africa, Brazil, and
Malaysia.
Country
ThO
2
Reserves
[metric tonnes]
USGS estimate
2010
ThO
2
Reserves
[metric
tonnes]
NEA estimate
***
Mined
amounts
2007
[metric
tonnes]
*
USA 440,000 400,000 -
**
Australia 300,000 489,000 -
Turkey 344,000
India 290,000 319,000 5,000
Venezuela 300,000
Canada 100,000 44,000 -
South
Africa
35,000 18,000 -
Brazil 16,000 302,000 1,173
Norway 132,000
Egypt 100,000
Russia 75,000
Greenland 54,000
Canada 44,000
Malaysia 4,500 800
Other
countries
90,000 33,000 -
Total 1,300,000 2,610,000 6,970
*
Average Th content of 6-8 percent.
**
Last mined in 1994.
***
Reasonably assured and inferred resources available at up to $80/kg Th.
Table 3. Estimated Global Thorium Resources (Van Gosen et. al., 2009).
Nuclear Power – Deployment, Operation and Sustainability
390
The Steenkampskraal Mine in South Africa, located 350 km Northwest of Cape Town was
operated by the Anglo American Company as the world’s largest producer of Thorium and
rare earth elements over the period 1952-1963. It was acquired by the Rare Earth Extraction
Company (Rareco).
Concentrated deposits occur as vein deposits, and disseminated deposits occur as massive
carbonatite stocks, alkaline intrusions, and black sand placer or alluvial stream and beach
deposits.
Carbonatites are rare carbonate igneous rocks formed by magmatic or metasomatic
processes. Most of these are composed of 50 percent or higher carbonate minerals such as
calcite, dolomite and/or ankerite. They occur near alkaline igneous rocks.
The alkaline igneous rocks, also referred to as alkali rocks, have formed from magmas and
fluids so enriched in alkali elements that Na and K bearing minerals form components of the
rocks in larger proportion than usual igneous rocks. They are characterized by feldspathoid
minerals and/or alkali pyroxenes and amphiboles (Hedrick, 2009).
Deposit type Mining District Location ThO
2
reserves
[metric tonnes]
Vein deposits Lehmi Pass district Montana-Idaho
64,000
Wet Mountain area Colorado 58,200
Hall Mountain Idaho 4,150
Iron Hill Colorado 1,700 (thorium
veins)
690 (Carbonatite
dikes)
Diamond Creek Idaho -
Bear Lod
g
e Mountain
s
Wyoming -
Monroe Canyon Utah -
Mountain Pass district
California -
Quartzite district Arizona -
Cottonwood area Arizona -
Gold Hill district New Mexico -
Capitan Mountain New Mexico -
Laughlin Peak New Mexico -
Wausau, Marathon
County
Wisconsin -
Bokan Mountain Alaska -
Massive Carbonatite stocks Iron Hill Colorado 28,200
Mountain Pass California 8,850
Black Sand Placer, Alluvial
Deposits
Stream deposits North, South
Carolina
4,800
Stream placers Idaho 9,130
Beach placers Florida-Georgia
14,700
Alkaline Intrusions Bear Lod
g
e Mountain
s
Wyoming -
Hicks Dome Illinois -
Total, USA 194,420
Table 4. Locations of USA major ThO
2
proven reserves (Hedrick, 2009).
Thorium Fission and Fission-Fusion Fuel Cycle
391
Fig. 4. Th concentrations in ppm and occurrences in the USA. Source: USA Geological
Survey Digital Data Series DDS-9, 1993.
Fig. 5. Lehmi Pass is a part of Beaverhead Mountains along the continental divide on the
Montana-Idaho border, USA. Its Th veins also contain rare earth elements, particularly
Neodymium.
Nuclear Power – Deployment, Operation and Sustainability
392
Fig. 6. Black sand Monazite layers in beach sand at Chennai, India. Photo: Mark A. Wilson
(Hedrick, 2009).
Fig. 7. Thorite (Th, U)SiO
4
, a thorium-uranium silicate (Van Gosen, 2009).
7. Global and USA uranium resources
Depleting hydrocarbon fuel resources and the growing volatility in fossil fuel prices, have
led to an expansion in nuclear power production. The Station Blackout accident, caused by a
combined earthquake and tsunami event at the Fukushima Daiichi reactors on March 11,
2011 will lead to a reconsideration of the relative advantages and disadvantages of the
existing U
238
-Pu
239
fuel cycle against the alternative Th
232
-U
233
fuel cycle.
Thorium Fission and Fission-Fusion Fuel Cycle
393
As of 2010, there were 56 nuclear power reactors under construction worldwide, of which 21
are in China. Some are replacing older plants that are being decommissioned, and some are
adding new installed capacity. The Chinese nuclear power program is probably the most
ambitious in history. It aims at 50 new plants by the year 2025 with an additional 100, if not
more, completed by the year 2050. Standardized designs, new technology, a disciplined
effort to develop human skills and industrial capacities to produce nuclear power plant
components all point to a likely decline in plant construction costs in coming years and
growing interest in new nuclear projects with ensuing pressure on nuclear fuels.
Fig. 8. Number of power reactors under construction worldwide. Total: 56. Net electrical
capacity: 51.9 MWe. Data source: IAEA, 2010.
It should be noted that there are currently 150 international reactor projects in some
advanced permitting stage. An additional 300 projects are in some early planning stage.
Added to a significant fraction of the currently 439 operating power reactors will likely
double global nuclear capacity in the coming couple decades (most countries seem willing
to try to extend the operating lives of existing reactors through safety-compliant upgrades
and retrofits). Building a nuclear power plant practically requires contracting its fuel supply
for 40-60 years. When adding all new projects it is reasonable to conclude that fuel
requirements could double in the coming couple decades.
About 30 percent of the known recoverable global uranium oxide resources are found in
Australia, followed by Kazakhstan (17 percent), Canada (12 percent), South Africa (8
percent), Namibia (6 percent), and Russia, Brazil and the USA, each with about 4 percent of
the world production.
The uranium resources are classified into “conventional” and “non-conventional” resources.
The conventional resources are further categorized into “Reasonably Assured Resources,”
RAR and the believed-to-exist “Inferred Resources,” IR.
The RAR and IR categories are further subdivided according to the assumed exploitation
cost in USA dollars. These cost categories are given as < 40 $/kg, < 80 $/kg, and < 130 $/kg.
1
1
1
1
1
1
1
2
2
2
2
5
6
9
21
0 5 10 15 20 25
Argentina
Finland
France
Japan
Pakistan
USA
Islamic Republic of Iran
Bulgaria
Slovak Republic
Ukraine
Taiwan
India
Republic of Korea
Russia
China
Nuclear Power – Deployment, Operation and Sustainability
394
The non-conventional resources are split into “Undiscovered Resources,” UR, further
separated into “Undiscovered Prognosticated Resources,” UPR with assumed cost ranges of
< 80 $/kg and < 130 $/kg, and “Undiscovered Speculative Resources” USR.
The USR numbers are given for an estimated exploitation cost of < 130 $/kg and also for a
category with an unknown cost.
In the twentieth century, the USA was the world leading uranium producer until it was
surpassed by Canada and Australia. In 2007, Canada accounted for 23 percent and Australia
for 21 percent of global production, with the USA at 4 percent. Africa is becoming a new
frontier in uranium production with Namibia 7 percent, Niger 8 percent, and South Africa 1
percent. Exploration and new mine development is ongoing in Botswana, Tanzania. Jordan
and Nigeria.
The federal, provincial and local governments in Australia have all unilaterally and
forcefully banned the development of any new uranium mines, even though existing mines
continue operation. The French company Areva was not successful in receiving approval to
build a new uranium mine in Australia. It has mining activities in the Niger Republic and
received exploration licenses in other countries such as Jordan.
Canadian producer Cameco rates as the first world producer of uranium oxide, followed by
French Areva, and then Energy Resources of Australia (68 percent owned by Rio Tinto),
which produces some 6,000 tons per year.
As of 2007, five operating uranium mines existed in the USA, with 3 in Texas, one in
Wyoming and one in Northern Nebraska. The state of Texas has a positive attitude towards
uranium mining, and energy production in general, with an advantageous regulatory
framework that streamlines the permit process using in situ leaching of uranium. Texas,
being an “Agreement State,” implies that the USA Nuclear Regulatory Commission (NRC)
has delegated its authority to the state regulatory agencies such as the Texas Commission on
Environmental Quality (TCEQ), and companies deal directly with the state agencies in
Texas rather than with the federal government’s NRC. Most of the uranium mining
operations in the USA and Kazakhstan use in situ leach methods, also designated as In Situ
Recovery (ISR) methods. Conventional methods are used in 62 percent of U mining, with 28
percent as ISR and 9 percent as byproduct extraction.
By 2008, U production in the USA fell 15 percent to 1,780 tonnes U
3
O
8
. The U production in
the USA is currently from one mill at White Mesa, Utah, and from 6 ISR operations. In 2007,
four operating mines existed in the Colorado Plateau area: Topaz, Pandora, West Sunday
and Sunday-St. Jude. Two old mines reopened in 2008: Rim Canyon and Beaver Shaft and
the Van 4 mine came into production in 2009.
As of 2010, Cameco Resources operated two ISL operations: Smith Ranch-Highland Mine in
Wyoming and Cross Butte Mine in Nebraska, with reserves of 15,000 tonnes U
3
O
8
. The
Denison Mines Company produced 791,000 tonnes of U
3
O
8
in 2008 at its 200 t/day White
Mesa mill in Southern Utah from its own and purchased ore, as well as toll milling.
Uranium in the Colorado Plateau in the USA has an average grade of 0.25 percent or 2,500
ppm uranium in addition to 1.7 percent vanadium within the Uravan Mineral Belt.
Goliad County, Texas has an average grade of 0.076 percent (760 ppm) uranium oxide in
sandstone deposits permeated by groundwater suggesting in situ leaching methods where
water treated with carbon dioxide is injected into the deposit. The leachate is pumped and
passed over ion exchange resins to extract the dissolved uranium.
Thorium Fission and Fission-Fusion Fuel Cycle
395
Country Production
[tonnes U]
Share of
world
production
[percent]
Main
owner
Extraction
method
Mine
Canada 6,383 15 Cameco Conv McArthur
River
Australia 4,527 10 Rio Tinto Conv Ranger
Namibia 3,449 8 Rio Tinto Conv Rδssing
Australia 3,344 8 BHP
Billiton
Byproduct Olympic
Dam
Russia 3,050 7 ARMZ Conv Priargunsk
y
Niger 1,743 4 Areva Conv Somair
Canada 1,368 3 Cameco Conv Rabbit
Lake
Niger 1,289 3 Areva Conv Cominak
Canada 1,249 3 Areva Conv McLean
Kazakhsta
n
1,034 2 Uranium
One
ISR Akdata
Total 27,436 62
Table 5. World main producing uranium mines, 2008. Source: World Nuclear Association,
WNA.
Phosphate rocks containing just 120 ppm in U have been used as a source of uranium in the
USA. The fertilizer industry produces large quantities of wet process phosphoric acid
solution containing 0.1-0.2 gram/liter (g/l) of uranium, which represent a significant
potential source of uranium.
8. Nonproliferation characteristics
In the Th-U
233
fuel cycle, the hard gamma rays associated with the decay chain of the formed
isotope U
232
with a half life of 72 years and its spontaneous fission makes the U
233
in the
thorium cycle with high fuel burnup a higher radiation hazard from the perspective of
proliferation than Pu
239
.
The U
232
is formed from the fertile Th
232
from two paths involving an (n, 2n) reaction, which
incidentally makes Th
232
a good neutron multiplier in a fast neutron spectrum:
1 232 1 231
090 090
25.52
231 0 231
90 1 91
1 231 232
091 91
1.31
232 0 232
91 1 92
2
h
d
nTh nTh
Th e Pa
nPa Pa
Pa e U
(2)
Nuclear Power – Deployment, Operation and Sustainability
396
and another involving an (n, γ) radiative capture reaction:
1 232 233
090 90
22.2
233 0 233
90 1 91
27
233 0 233
91 1 92
233 1 1 232
92 0 0 92
2
m
d
nTh Th
Th e Pa
Pa e U
Un nU
(3)
The isotope U
232
is also formed from a reversible (n, 2n) and (n, γ) path acting on the bred
U
233
:
1 233 1 232
092 092
1 232 233
092 92
2nU nU
nU U
(4)
The isotope Th
230
occurs in trace quantities in thorium ores that are mixtures of uranium and
thorium. U
234
is a decay product of U
238
and it decays into Th
230
that becomes mixed with the
naturally abundant Th
232
. It occurs in secular equilibrium in the decay chain of natural
uranium at a concentration of 17 ppm. The isotope U
232
can thus also be produced from two
successive neutron captures in Th
230
:
1 230 231
090 90
25.52
231 0 231
90 1 91
1 231 232
091 91
1.31
232 0 232
91 1 92
h
d
nTh Th
Th e Pa
nPa Pa
Pa e U
(5)
The hard 2.6 MeV gamma rays originate from Tl
208
isotope in the decay chain of aged U
232
which eventually decays into the stable Pb
208
isotope:
72
232 228 4
92 90 2
1.913
228 224 4
90 88 2
3.66
224 220 4
88 86 2
55.6
220 216 4
86 82 2
0.15
216 212 4
84 82 2
10.64
212 212 0
82 83 1
60.6
212 212 0
83 84 1
64%
83
a
a
d
s
s
h
m
UThHe
Th Ra He
Ra Rn He
Rn Po He
Po Pb He
Pb Bi e
Bi Po e
60.6
212 208 4
81 2
36%
0.298
212 208 4
84 82 2
3.053
208 208 0
81 82 1
()
() (2.6146)
m
s
m
Bi Tl He
Po Pb stable He
Tl Pb stable e MeV
(6)
As comparison, the U
233
decay chain eventually decays into the stable Bi
209
isotope:
Thorium Fission and Fission-Fusion Fuel Cycle
397
5
1.592 10
233 229 4
92 90 2
7340
229 225 4
90 88 2
14.8
225 225 0
88 89 1
10.0
225 221 4
89 87 2
4.8
221 217 4
87 85 2
32.3
217 213 4
85 83 2
45.6
213 213
83 84
xa
a
d
d
m
ms
m
UThHe
Th Ra He
Ra Ac e
Ac Fr He
Fr At He
At Bi He
Bi Po
0
1
4.2
213 209 4
84 82 2
3.28
209 209 0
82 83 1
()
s
h
e
Po Pb He
Pb Bi stable e
(7)
A 5-10 proportion of U
232
in the U
232
-U
233
mixture has a radiation equivalent dose rate of
about 1,000 cSv (rem)/hr at a 1 meter distance for decades making it a highly proliferation
resistant cycle if the Pa
233
is not separately extracted and allowed to decay into pure U
233
.
The Pa
233
cannot be chemically separated from the U
232
if the design forces the fuel to be
exposed to the neutron flux without a separate blanket region, making the design fail-safe
with respect to proliferation and if a breeding ratio of unity is incorporated in the design.
Such high radiation exposures would lead to incapacitation within 1-2 hours and death
within 1-2 days of any potential proliferators.
The International Atomic Energy Agency (IAEA) criterion for fuel self protection is a lower
dose equivalent rate of 100 cSv(rem)/hr at a 1 meter distance. Its denaturing requirement for
U
235
is 20 percent, for U
233
with U
238
it is 12 percent, and for U
233
denaturing with U
232
it is 1
percent.
The Indian Department of Atomic Energy (DAE) had plans on cleaning U
233
down to a few
ppm of U
232
using Laser Isotopic Separation (LIS) to reduce the dose to the occupational
workers.
The contamination of U
233
by the U
232
isotope is mirrored by another introduced problem
from the generation of U
232
in the recycling of Th
232
due to the presence of the highly
radioactive Th
228
from the decay chain of U
232
.
9. Radiation dosimetry
The International Atomic Energy Agency (IAEA) criterion for occupational protection is an
effective dose of 100 cSv (rem)/hr at a 1 meter distance from the radiation source.
It is the decay product Tl
208
in the decay chain of U
232
and not U
232
itself that generates the
hard gamma rays. The Tl
208
would appear in aged U
233
over time after separation, emitting a
hard 2.6416 MeV gamma ray photon. It accounts for 85 percent of the total effective dose 2
years after separation. This implies that manufacturing of U
233
should be undertaken in
freshly purified U
233
. Aged U
233
would require heavy shielding against gamma radiation.
In comparison, in the U-Pu
239
fuel cycle, Pu
239
containing Pu
241
with a half life of 14.4 years,
the most important source of gamma ray radiation is from the Am
241
isotope with a 433
years half life that emits low energy gamma rays of less than 0.1 MeV in energy. For
weapons grade Pu
239
with about 0.36 percent Pu
241
this does not present a major hazard but
the radiological hazard becomes significant for reactor grade Pu
239
containing about 9-10
percent Pu
241
.
Nuclear Power – Deployment, Operation and Sustainability
398
The generation of Pu
241
as well as Pu
240
and Am
241
from U
238
follows the following path:
1 238 239
092 92
23.5
239 0 239
92 1 93
2.35
239 0 239
93 1 94
1 239 240
094 94
1 240 241
094 94
14.7
241 0 241
94 1 95
m
d
a
nU U
UeNp
Np e Pu
nPu Pu
nPu Pu
Pu e Am
(8)
Plutonium containing less than 6 percent Pu
240
is considered as weapons-grade.
The gamma rays from Am
241
are easily shielded against with Pb shielding. Shielding against
the neutrons from the spontaneous fissions in the even numbered Pu
238
and Pu
240
isotopes
accumulated in reactor grade plutonium requires the additional use of a thick layer of a
neutron moderator containing hydrogen such as paraffin or plastic, followed by a layer of
neutron absorbing material and then additional shielding against the gamma rays generated
from the neutron captures.
The generation of Pu
238
and Np
237
by way of (n, 2n) rather than (n, γ) reactions, follows the
path:
1 238 1 237
092 092
6.75
237 0 237
92 1 93
1 237 238
093 93
2.12
238 0 238
93 1 94
2
d
d
nU nU
UeNp
nNp Np
Np e Pu
(9)
The production of Pu
238
for radioisotopic heat and electric sources for space applications
follows the path of chemically separating Np
237
from spent LightWater Reactors (LWRs) fuel
and then neutron irradiating it to produce Pu
238
.
Isotopic
composition
[percent]
Pu
239
weapons
grade
Pu
239
reactors
grade
U
233
U
233
+ 1
ppm U
232
U
232
0.0000 0.0001
U
233
100.0000
99.9999
Pu
238
0.0100 1.3000
Pu
239
93.8000 60.3000
Pu
240
5.8000 24.3000
Pu
241
0.3500 9.1000
Pu
242
0.0200 5.0000
Density
[gm/cm
3
]
19.86 19.86 19.05 19.05
Radius [cm] 3.92 3.92 3.96 3.96
Weight [kg] 5 5 5 5
Table 6. Typical compositions of fuels in the uranium and thorium fuel cycles (Kang, von
Hippel, 2001).