Integrated Waste Management Volume I Part 7 docx
Bạn đang xem bản rút gọn của tài liệu. Xem và tải ngay bản đầy đủ của tài liệu tại đây (1.32 MB, 35 trang )
New Municipal Solid Waste Processing Technology Reduces
Volume and Provides Beneficial Reuse Applications for Soil Improvement and Dust Control
201
mg CO2-C kg
-1
soil
-1
d
-1
Dove Field Soil
17.9 Mg ha
-1
35.8 Mg ha
-1
71.6 Mg ha
-1
143 Mg ha
-1
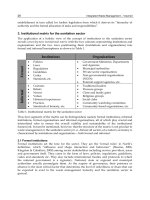
Day Fluff* MWC** Fluff MWC Fluff MWC Fluff MWC
30 24.74 3.50 34.02 4.20 56.12 6.65 80.85 9.81
60 9.94 0.53 17.76 1.93 24.74 1.93 35.10 2.98
90 5.98 1.58 9.64 2.10 13.97 2.45 17.63 4.90
Borrow Pit Soil
17.9 Mg ha
-1
35.8 Mg ha
-1
71.6 Mg ha
-1
143 Mg ha
-1
Day Fluff MWC Fluff MWC Fluff MWC Fluff MWC
30 8.72 2.80 21.54 2.80 36.30 4.90 76.08 7.71
60 4.22 1.05 6.61 2.10 13.57 0.18 26.39 2.63
90 0.11 0.00 3.07 0.00 4.65 2.28 16.85 3.68
* Fluff = Un-composted municipal waste
** MWC = Municipal waste compost
Table 4. Comparison of carbon evolution rates between soils, additives, rates, and
incubation duration.
Total inorganic N and NO
3
levels were considerably higher in the compost treatments than
in the Fluff treatments, indicating that decomposition of the Fluff resulted in significant N
immobilization (Table 6). No changes in inorganic N concentration were observed in the
Borrow Pit Fluff treatments through 90 d, but the Dove Field Fluff treatments did increase
slightly over time, with an inverse relationship between rate and inorganic N concentration
after 90 d of incubation. Ammonia levels did not differ at the same magnitude. Ammonia
concentrations in the compost treatments remained very low and relatively constant across
rates and soils but decreased slightly over time. Ammonia concentrations in the Dove Field
% C mineralized of additive TOC
Dove Field
17.9 Mg ha
-1
35.8 Mg ha
-1
71.6 Mg ha
-1
143 Mg ha
-1
Day Fluff* MWC** Fluff MWC Fluff MWC Fluff MWC
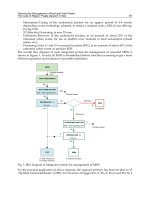
30 15.45 1.06 11.68 1.14 9.58 1.49 7.43 1.41
60 26.71 1.71 19.27 2.55 15.06 2.19 11.31 2.00
90 25.85 3.30 19.86 3.06 17.83 2.65 12.36 2.64
Borrow Pit
17.9 Mg ha
-1
35.8 Mg ha
-1
71.6 Mg ha
-1
143 Mg ha
-1
Day Fluff MWC Fluff MWC Fluff MWC Fluff MWC
30 4.78 0.94 6.46 0.54 6.02 1.13 6.47 1.04
60 9.70 2.18 10.32 2.07 9.22 1.16 9.16 1.51
90 8.91 2.18 11.32 2.07 10.29 2.07 10.34 2.23
* Fluff = Un-composted municipal waste; ** MWC = Municipal waste compost
Table 5. Comparison of percent carbon mineralization of additive total organic carbon
(TOC) between soils, additives, rates and incubation duration.
Integrated Waste Management – Volume I
202
Fluff treatments peaked at day 60 and decreased to their initial levels by day 90, indicating
that net ammonification had occurred during the incubation but net nitrification had begun
by the end of the 90 d. Even at the peak, however, NH
4
levels still remained at low
concentrations (<11 mg kg
-1
). The low concentrations of NH
4
indicate that potential toxicity
from NH
4
buildup would not be a problem in these soils even at rates of 143 Mg ha
-1
. In the
Borrow Pit soil, neither net ammonification nor nitrification was ever indicated throughout
the incubation as both NH
4
and NO
3
concentrations stayed consistently low. This
consistency indicates a severe N deficiency in this soil and was probably responsible for the
slower decomposition of the Fluff.
Total Inorganic N Concentration (mg kg
-1
)
Dove Field Soil
17.9 Mg ha
-1
35.8 Mg ha
-1
71.6 Mg ha
-1
143 Mg ha
-1
Day Fluff* MWC** Fluff MWC Fluff MWC Fluff MWC
30 2.60 38.54 3.71 59.65 4.17 85.22 3.778 117.68
60 14.89 51.80 12.16 67.34 10.13 108.06 6.586 139.94
90 22.93 56.12 15.35 68.78 7.47 101.57 5.218 132.688
Borrow Pit Soil
17.9 Mg ha
-1
35.8 Mg ha
-1
71.6 Mg ha
-1
143 Mg ha
-1
Day Fluff MWC Fluff MWC Fluff MWC Fluff MWC
30 0.00 18.54 0.00 29.11 0.00 55.93 0.50 112.92
60 0.40 17.30 0.93 30.61 1.08 64.55 1.01 123.58
90 0.00 14.64 0.30 31.68 0.11 61.86 0.63 123.79
* Fluff = Un-composted municipal waste; ** MWC = Municipal waste compost
Table 6. Differences in total inorganic nitrogen concentration between soils, additives, rates,
and incubation duration.
Because both soils were relatively infertile and both C and N mineralization of the Fluff
were closely tied to the fertility status of the soils, it is likely that Fluff decomposition will
occur at a faster rate in more fertile soils. When used in infertile soils, N immobilization will
occur for an extended period due to incorporation into microbial biomass, with potential
negative consequences for vegetation initially, but fertilization with a readily available N
source may alleviate the period of this immobilization. On the other hand, slower
degradation of the material may provide the best long term benefit as leaching losses would
be minimized and N inputs would more closely resemble natural soils, as was found with
yard waste compost that led to net immobilization initially (Claassen and Carey, 2004). For
vegetation that requires significant N inputs, the mature compost would work well as it
provided a steady and significant amount of N throughout the 90 d. In settings where
available N could be detrimental, such as native plant restorations or in other instances
where weed pressure is undesirable and detrimental, Fluff application could be a simple
way to decrease available N in the short term, but would most likely provide a slowly
available source over the longer term. Restoration of late-seral plant communities has
previously been achieved through high C:N organic soil amendments such as sucrose and
sawdust that limit available N (McLendon and Redente, 1992; Morgan, 1994; Paschke et al.,
2000). Additionally, any increase in the organic C content of soil can provide significant
New Municipal Solid Waste Processing Technology Reduces
Volume and Provides Beneficial Reuse Applications for Soil Improvement and Dust Control
203
benefits, especially in degraded soils where vegetative cover is minimal. Soil organic matter
reduces compactibility (Zhang et al., 1997), increases water holding capacity (Hudson, 1994),
increases particle aggregation (McDowell and Sharpley, 2003), and reduces erodibility
(Gilley and Risse, 2000; Barthes et al., 1999).
The comparison between these data and other studies using raw household waste (Bernal et
al., 1998) indicates that the MWC used here had a much lower rate of C mineralization
relative to the unprocessed waste in the previous study, with the only major difference
between the organic materials being the processing technology used to produce MWC.
Because the MWC had such a low rate of C mineralization relative to the raw waste, the
processing must have a significant effect on the material’s degradation rate. If the
carbonaceous material resulting from this process increases the residence time of added C in
soil, this could be a significant benefit for increasing organic matter in soils. The increase in
soil C and decrease in soil N from the un-composted Fluff indicates that it would be best
suited for highly degraded soils where establishment of native perennial communities
adapted to N limitation is desired.
4. Fluff uses
This waste processing technology is currently in use in Warren County, TN, where a 95%
recycling rate has been achieved for the county’s municipal waste, with the bulk of the
organic byproduct composted for use as topsoil replacement in the horticultural industry
(Croxton et al., 2004). While the resulting Fluff material has been used successfully after
composting in the horticulture industry, Fluff may also be an effective soil amendment
before composting to improve soil physical and chemical properties, thereby enhancing
land rehabilitation efforts. The Fluff is unique in both origin and physical attributes when
compared to other soil amendments, and land application studies have recently been
conducted by the US Army Corps of Engineers to improve Army training ground
rehabilitation, based on results of the incubation studies described above. The United States
Army generated over 1.2 million metric tons of solid waste in the United States in Fiscal
Year 2003 but has a limited number of landfills, increasing costs to ship garbage off post
(Solid Waste Annual Reporting, 2004). However, with almost 5 million hectares of land in
the United States, including 73 installations with greater than 4,000 hectares each, the Army
has enough acreage to support large-scale land utilization of organic waste byproducts
(DoD, 2001). Large blocks of this land are in need of rehabilitation due to historic and
contemporary Army training activities, but often lack sufficient topsoil, organic matter, and
nutrients required for successful rehabilitation. By diverting organic matter from landfills to
degraded training lands, the Army could incorporate reuse of municipal waste into land
management, decrease waste disposal costs, and improve land rehabilitation efforts on
Army training and testing ranges.
Due to the expenses involved with overcoming these land rehabilitation limitations, a cheap
alternative material is needed. An effort to utilize organic waste byproducts by the Army
could be greatly enhanced if the need for large scale composting facilities for municipal
waste could be eliminated. The use of a highly processed organic pulp such as Fluff could
divert organic matter from landfills to degraded training lands. On marginal lands such as
degraded training areas, organic amendments such as Fluff can be beneficial when used to
enhance vegetation establishment. The increased soil organic matter should increase the soil
water holding capacity and pH, lower soil bulk density, and provide a slowly available
Integrated Waste Management – Volume I
204
source of nutrients. Studies were conducted to test the hypothesis that an undecomposed
material such as Fluff is beneficial as an organic soil amendment that can aid in the
establishment of native grasses. While many similarities exist between the land application
of other agricultural and industrial waste products such as poultry litters, animal manures
(Karlen et al., 1998), and composted biosolids, Fluff is a unique byproduct which required
experimental studies to understand the impacts to vegetative establishment, plant nutrient
status and impacts to soil quality.
4.1 Land application and vegetation establishment
As previously noted, a potential problem with non-composted organic material is the high
C:N ratio, which could create a soil environment with low N availability. However, the
creation of low N availability may be an advantage for establishing native vegetation that is
adapted to nutrient limited soils and would benefit greatly from a reduction in weed
competition for N (Paschke et al., 2000; Barbour et al., 1999; Wilson and Gerry, 1995;
McLendon and Redente, 1992). Perennial warm season grasses, such as those native to the
Tallgrass Prairie of North America, are well adapted to harsh environmental conditions,
including low N availability, giving them a competitive advantage in poor soils (Jung et al.,
1988; Wilson and Gerry, 1995; Skeel and Gibson, 1996; Levy et al., 1999). These grasses are
used abundantly in reclamation, as they develop extensive root systems that penetrate deep
into soils, providing a very effective safeguard against erosion (Drake, 1983). Although these
species are highly suited to conservation planting, establishment is a significant barrier to
successful utilization, as weedy species can easily overtake them and cause failure,
especially in N rich soils (Launchbaugh, 1962; Wedin and Tilman, 1993, 1996; Munshower,
1994; Warnes and Newell, 1998; Reever and Seastedt, 1999; Brejda, 2000).
Studies have been conducted to evaluate the use of Fluff as a soil amendment to successfully
rehabilitate damaged military training lands, which often lack sufficient topsoil, organic
matter, and nutrients required for successful rehabilitation (Busby et al., 2006; Busby et al.,
2010). Busby et al. (2010) carried out a field study in North-Central Tennessee at the Fort
Campbell Military Reservation, on an abandoned hay field currently used for Army training
activities. Soil at the site was a Sengtown silt loam (fine, mixed, semiactive, thermic, Typic
Paleudalfs) (Soil Survey of Montgomery County, Tennessee, 1975). Application of Fluff was
made at rates varying from 0 to 36 Mg ha
-1
. Three warm season grasses species (Big
Bluestem - Andropogon gerardii , Switchgrass - Panicum virgatum, and Indiangrass -
Sorghastrum nutans) and one cool season grass (Virginia Wildrye - Elymus virginicus) were
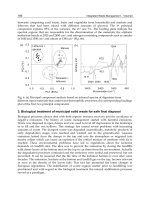
planted. In a separate study, two sites on Fort Benning Military Reservation, GA, were
established. The sites chosen were designated as “Dove Field” [a moderately degraded
Troup sandy loam soil] and as “Borrow Pit” [highly degraded Borrow Pit soil (highly
disturbed Orangeburg Fine-loamy soil (Soil Survey of Muscogee County, Georgia, 1983)
(Fig. 2). At these sites, treatment plots consisted of a control where nothing was done, a
control with revegetation only, and application of Fluff at rates varying from 0 to143 Mg ha
-1
with revegetation. As in Tennessee, native grasses Big Bluestem, Switchgrass, Indiangrass,
and Virginia Wildrye were planted. Vegetation sampling, including plant biomass (Bonham,
1983), plant nutrient composition, plant species composition (Sharrow and Tober, 1979) and
basal vegetative cover, were measured at the end of each of two growing seasons. Plant
biomass was collected, consisting of composite samples of all species present. Analysis was
performed for total Carbon (C), nitrogen (N), aluminum (Al), boron (B), barium (Ba),
New Municipal Solid Waste Processing Technology Reduces
Volume and Provides Beneficial Reuse Applications for Soil Improvement and Dust Control
205
calcium (Ca), cobalt (Co), chromium (Cr), copper (Cu), iron (Fe), potassium (K), magnesium
(Mg), manganese (Mn), sodium (Na), phosphorus (P), lead (Pb), silicon (Si), and zinc (Zn).
4.2 Vegetation growth and composition
At the Fort Campbell experimental sites, vegetation consisted primarily of agricultural
grasses and forbs typical of early successional communities with 49 species in 24 families
recorded for the entire study area. After two growing seasons following Fluff application
and seeding with the desired warm and cool season grasses, total basal vegetative cover
differences were not significant across years or treatments. Annual grass and total annual
cover were relatively unaffected by Fluff treatment but were significantly higher in the
unseeded control treatment than in the 36 Mg ha
-1
treatment. The 36 Mg ha
-1
treatment had
significantly higher total perennial, perennial grass, and planted grass cover than both the
seeded and unseeded controls. Big bluestem, indiangrass, and switchgrass cover were
unaffected by treatment.
Based on the results of the species composition and basal cover analyses, establishment of 2
of the 3 native warm season prairie grasses was enhanced with pulp application rates of 36
Mg ha
-1
. Indiangrass appears to be relatively unresponsive to the Fluff, but switchgrass and
big bluestem showed notable density and cover increases at the highest application rate.
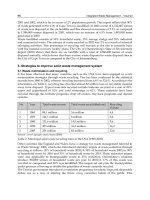
Fig. 2. Borrow Pit field sites on Fort Benning Military Reservation, GA; A) initial application
of Fluff, B) plant growth after 2 years.
No differences in biomass were found between the Fluff treatments and seeded control. The
lack of change in biomass in the unseeded control plots compared to the seeded plots was
most likely due to dominance by ruderal species in the unseeded control plots that typically
lack the biomass found in the seeded perennial grasses. Because annual grass cover
remained constant but its relative percent composition decreased, it can be concluded that
the Fluff was in some way beneficial to the prairie grasses but not inhibitory to weedy
species during the first 2 growing seasons following application of up to 36 Mg ha
-1
. This
would be expected for sites with relatively good soil fertility such as those seen at the Fort
Campbell experimental sites.
At Fort Benning, a total of 21 species were sampled in the research plots over 2 years.
Combined, planted grass species comprised 98.2% of the total species composition of the
Borrow Pit and 87.3% of the Dove Field. Application rate had no effect on percent
composition of total planted grasses at either site. Switchgrass appeared to be the best suited
A B
Integrated Waste Management – Volume I
206
species as it dominated all seeded sites and comprised the highest relative percentage
composition and basal cover of all species present (Fig. 2). It also responded most favorably
to Fluff application as basal cover increased significantly with increasing application rate at
both sites. Additionally, switchgrass performed so well that the majority of plants produced
seed during the first growing season at both sites, which may have contributed to increased
dominance the following year. Big bluestem appeared to be unaffected by application rate at
the Dove Field site, but basal cover increased significantly with increasing application rate at
the Borrow Pit. Given that the more fertile Dove Field site was more conducive to vegetation
establishment than the Borrow Pit, this may have been the result of oversupplying nutrients
at high application rates which big bluestem was not able to fully exploit at the Dove Field.
However, higher application rates overcame deficiencies and created more favorable
growing conditions at the Borrow Pit which positively influenced big bluestem growth.
Indiangrass initially performed well in the Dove Field, but remained only a minor
vegetation component at the Borrow Pit. Given that indiangrass diminished over time and
in response to increased Fluff, while the other two dominant species increased, it appears
that indiangrass was not able to effectively compete with switchgrass and big bluestem at
either site in the presence of Fluff amended soil. Indiangrass high relative composition in the
controls indicates that it was competitive in unamended soils, but its low relative
composition in the higher application rates indicates that it was not able to effectively
exploit any benefits provided by the amended soils in the manner observed by switchgrass.
Further, because it was so much more prevalent in the Dove Field than in the Borrow Pit,
indiangrass was not as tolerant to the highly unfavorable growing conditions in the Borrow
Pit as were the other species.
Biomass was much higher in the Dove Field than in the Borrow Pit across application rates,
but both sites responded very well to increased Fluff application (Table 7). In the Dove
Field, biomass remained relatively constant in the unseeded control at less than 300 g m
-2
but almost doubled in the 143 Mg ha
-1
treatment from 539 to 1059 g m
-2
from 2003 to 2004. In
the Borrow Pit, the unseeded control lacked any biomass throughout the study, but the 143
Mg ha
-1
treatment increased from 345 to 582 g m
-2
over time.
Fluff Rate Dove Field
Borrow Pit
2003 2004 2003 2004
Mg ha
-1
(g m
-2
)
Unseeded Control 243 291 0 0
0 269 392 18 14
18 344 617 46 90
64 428 613 73 122
72 468 749 202 403
143 539 1059 345 582
Table 7. Biomass yields as affected by Fluff application for the Dove Field and Borrow Pit
study sites in 2003 and 2004.
Weedy annual grasses were not affected at the level originally hypothesized. It was
expected that annual weeds, with characteristic shallow root systems and intolerance to
shading, would respond negatively to increased competition with taller, deeper rooted
perennial prairie grasses. Even though annual grasses were unaffected, the increases in
New Municipal Solid Waste Processing Technology Reduces
Volume and Provides Beneficial Reuse Applications for Soil Improvement and Dust Control
207
switchgrass and big bluestem cover show a positive result of pulp application. Because the
planted grass species constituted almost all vegetation that was sampled in the seeded plots
(98% in the Borrow Pit and 87% in the Dove Field) and resulted in mean basal cover values
of 7.5% and 12.2%, respectively, establishment of a native grass community was considered
successful at both sites.
4.3 Plant chemical analysis
Plant chemical composition was also measured to monitor potential changes in plant uptake
patterns due to Fluff additions. The measurements were made not only to determine
potential changes in the plant health by measuring plant nutrient concentration, but also to
measure the potential for environmental concerns with the uptake of heavy metals. In the
silt loam soils in Tennessee, soil concentrations of many metals and nutrients were
unaffected by Fluff addition, but plant P and Pb accumulation was increased by the 36 Mg
ha
-1
treatment. However, the increase in Pb was insignificant (1.5 mg kg
-1
for the highest
Fluff rate) with respect to established regulatory limits. The increase in soil P concentrations
in the high pulp rates alleviated an apparent P deficiency in the study site soils.
Based on these findings, it would be beneficial to use this material as a soil amendment for
reestablishing perennial warm-season grasses on disturbed acidic soils with limited P
availability. Rates of at least 36 Mg ha
-1
should be used to achieve noticeable benefits to
seeded species, although the upper limit for these benefits has not been determined. The
annual limit of Fluff application from a regulatory standpoint based solely on levels of Pb in
the material compared to allowable levels in biosolids application would be approximately
230 Mg ha
-1
year
-1
, with a cumulative limit attained near 4600 Mg ha
-1
. However, due to
logistical challenges and the potentially negative effects on soil physical and chemical
properties, these rates would not be advisable. If the highest application rate used in this
study were repeated once every five years, the limit would be reached in about 650 years.
However, to maintain native grass stands, the annual application rate would be significantly
lower due to potential negative compositional changes that could result from nitrogen
deposition over time.
In the sandy soils at Ft. Benning, more distinct differences were observed with the
increasing rates of Fluff. Plant nutrition was improved at both sites, however, due to very
distinctive soils between sites, the effects were dissimilar. At the more productive Dove
Field site, plant N, P, K, and Na concentrations increased with increasing Fluff application.
At the highly disturbed Borrow Pit site, plant P and Na concentrations also increased with
increasing Fluff, as well as Mg concentration. An apparent Fe toxicity problem at the highly
degraded site was alleviated by high applications of Fluff, as the control plots and lower
application rate treatments accumulated extremely high levels of plant Fe. Plant Ba
concentration was also reduced by increasing application of Fluff at both sites. The
improved plant nutrition and improvements in cover and biomass of perennial native
vegetation at both sites indicates an undecomposed organic material such as Fluff can
positively influence the establishment of native vegetation in disturbed soils with highly
variable properties. Results indicate that greater benefits are achieved with higher levels of
soil degradation when using fluff to aid in establishment of warm-season prairie grasses.
4.4 Impacts on soil
An important consideration in the utilization of Fluff as a soil amendment is what impact it
might have on soil condition or quality. To examine the potential impact on soil chemical
Integrated Waste Management – Volume I
208
and physical conditions, soil samples (Prior, et al., 2004) were collected following the
application of Fluff on degraded US Army training grounds in both sandy loam and silt
loam soils (Torbert et al., 2007; Busby et al., 2010). Soil samples were obtained at depths of
0-5, 5-10, 10-20, and 20-30, 30-60 and 60-90 cm and analyzed for total N and C, nitrate, and
ammonia (Nelson and Sommers, 1996). Extractable Al, As, B, Ca, Cd, Cr, Cu, Fe, K, Mg, Mn,
Na, Ni, P, Pb, S, Se, and Zn concentrations as well as soil pH and bulk density were also
determined (Bremmer, 1996; Soltanpour et al., 1996; Hue and Evans, 1986).
4.4.1 Silty-loam soils
For silty loam soils, few treatment effects were found for soil nutrients analyzed. Soil C and
P concentration was higher with 36 Mg ha
-1
fluff application than in the unseeded control,
but soil N was unaffected by Fluff application. Impacts were also noted for soil K, Ca, Mn,
and Cu with Fluff application. Few differences were observed for soil heavy metals, but
Fluff application did impact Pb, Al, and As when extracted with Mehlich III extractant
(Mehlich, 1984). Mean As concentrations were lower in the Fluff treatments than the
unseeded control, and Pb concentration increased approximately 1.5 mg kg
-1
in the 36 Mg
ha
-1
treatment over the controls.
The analysis of soil chemical properties indicated that Fluff application can significantly
increase available P in soils. The increase in extractable soil P in the highest application rates
combined with a stable and sufficient level of plant P indicated that an adequate amount of
labile P was supplied by Fluff rates greater than 18 Mg ha
-1
in this silt loam soil. Whether the
effect of increased plant P accumulation is a direct result of Fluff supplied P or by some
other mechanism is unknown. Because weedy plants usually respond better to fertilization
than warm season prairie grasses, this result may have been due to increased mycorrhizal
infectivity as weedy grasses did not diminish with increasing application rate, but prairie
grasses increased (Noyd et al., 1995, 1996). However, given that soil P levels only increased
in the depths where Fluff was incorporated, decomposition of the Fluff and subsequent
mineralization of P was most likely responsible. The added P from Fluff may have
promoted N immobilization, which would affect annual species more than the planted
perennial grasses, as the prairie grasses are much more efficient at nutrient utilization
(Brejda, 2000). This would explain why plant shoot P concentration, soil P concentration,
cover of planted grasses, and Fluff application rate were all directly related, but soil and
shoot N concentrations and annual grass cover were unaffected.
Although soil Pb levels increased significantly from a statistical standpoint in the upper
profiles at high Fluff rates, there was no significant change from a regulatory standpoint:
amounting to a net increase of approximately 1.5 mg kg
-1
in the top 30 cm of the soil profile
at the highest Fluff application rate. Additionally, both P and Pb only increased in the top 10
cm where the Fluff was incorporated, indicating that no movement into the lower soil
profile was occurring after 2 growing seasons. Because Pb is very tightly bound by soil
organic matter, it does not readily leach through the soil profile and is largely unavailable
for plant uptake (Kabata-Pendias, 2001).
4.4.2 Sandy-loam soils
In sandy loam soils (Torbert et al., 2007), the addition of Fluff had an impact on the soil bulk
density level in the surface soil (0-5 cm). While no significant difference was noted for
depths below 0-5 cm at either study site, the impact of improving the soil bulk density in the
soil surface would be important for soil quality and native grass establishment. At the Dove
New Municipal Solid Waste Processing Technology Reduces
Volume and Provides Beneficial Reuse Applications for Soil Improvement and Dust Control
209
Field, the soil bulk density was in the range of 1.56 g cm
-3
at the initiation of the study, but
with the application of 143 Mg ha
-1
Fluff, soil bulk density was drastically reduced to 1.17 g
cm
-3
. An even larger impact was observed with the soil at the Borrow Pit site, where the
initial level of soil bulk density was 1.83 g cm
-3
. The addition of Fluff at this site reduced the
soil bulk density to 1.22 g cm
-3
with application rates of 143 Mg ha
-1
.
The level of reduction observed with Fluff application would have an important impact on
soil condition at both locations. Soil bulk densities above 1.5 g cm
-3
have generally been
shown to be detrimental to root growth and plant yield (Gliski and Lipiec, 1990). The
reduction in the level of bulk density observed in this first year would be much more
conducive to both plant establishment and root growth of the native grasses. The soil bulk
density levels observed from second year soil sampling indicated that the soil physical
condition had been substantially improved and that this improvement would likely persist.
The improvement in soil bulk density alone would indicate that the degraded soil
conditions commonly associated with US Army training activities could be substantially
ameliorated with high Fluff application rates.
The ability of the soil to provide plant nutrients is controlled by many factors, such as
organic matter content, soil pH, and soil texture (Potash and Phosphate Inst., 2003; Mengel
and Kirkby, 1982). Many of these factors, such as soil organic matter content, are reduced in
degraded soils, thereby reducing the ability of the soil to provide adequate plant nutrient
supply. As noted, the Fluff contained substantial amounts of essential plant nutrients, which
would have been present with the application of the Fluff (Table 1). However, these
nutrients would not necessarily be available for plant uptake, depending on the condition of
the soil, particularly the soil pH level, and the decomposition and release of the nutrients in
the Fluff (Potash and Phosphate Inst., 2003).
Extractable soil nutrients (Mehlich, 1984), measured at the end of the first growing season
for both sites, are shown in Table 8. The application of Fluff increased extractable nutrients
in the surface soil layer at both sites. At the Dove Field, a less degraded soil compared to the
Borrow Pit, Fluff application resulted in a significant impact on P, B, Ca, Co, and Zn. The
soil concentration of Ca and P were particularly improved with the application of Fluff, with
Ca concentrations increasing from 195 to 1835 mg kg
-1
and P concentrations increasing from
29 to 145 mg kg
-1
with the application of 143 Mg ha
-1
of Fluff. The concentration of
extractable P in soil often limits plant production in agricultural scenarios, which results in
the need to add P fertilizer to improve soil fertility (Potash and Phosphate Inst., 2003).
At the Borrow Pit, the soil was extremely degraded, resulting in almost no vegetation at the
site at the start of the study and the initial soil fertility level being extremely low. The
application of Fluff resulted in a significant increase in the extractable soil nutrients B, Ca,
Co, Cu, Fe, K, Mg, Mn, P, and Zn (Table 8). This increase was likely due not only to the
addition of these nutrients with the Fluff, but also due to the improvement in the soil pH
level that was observed with increasing levels of Fluff application. As soil pH level increases
toward neutral, the availability of most plant nutrients improves (Potash and Phosphate
Inst., 2003). The addition of Fluff increased the soil extractable levels of plant macro- and
micro-nutrients to levels that would allow adequate plant growth.
Soil extracts were also analyzed for concentration of the heavy metals Cd, Cr, Ni, and Pb
(Table 9), which have USEPA limits for biosolids application (U.S. Government 40 C.F.R. Part
503, 1999). The concentration of Cd was increased with increasing Fluff application and Pb
increased as well, but only at the highest application rate. The concentration of Cr, Ni, and Pb
were also increased, but only at the highest application rate. None of the heavy metal
Integrated Waste Management – Volume I
210
concentrations found in the soil would be of concern in terms of the maximum cumulative
loading limits as regulated for biosolids (U.S. Government 40 C.F.R. Part 503, 1999).
Fluff
rate
P K Ca Mg Mn Fe Zn B Cu Co Na
Mg ha
-1
(mg kg
-1
)
Dove Field
0 29.7 53.5 225 59.6 21.6 11.6 1.56 0.05 0.32 0.08 6.3
18 58.3 57.4 572 79.0 28.1 14.0 6.80 0.27 0.54 0.13 13.0
64 64.2 53.0 745 46.9 25.8 15.3 8.52 0.11 0.72 0.14 9.1
72 66.0 66.6 663 44.8 33.0 14.6 9.72 0.16 1.53 0.14 9.3
143 145 86.5 1835 79.2 33.3 16.3 25.4 0.54 1.67 0.17 19.4
Borrow Pit
0 2.02 9.1 25 2.5 1.0 3.9 0.9 0.01 0.14 0.01 8.1
18 12.0 11.8 194 7.1 1.5 5.6 2.8 0.08 0.31 0.02 12.1
64 5.5 19.0 101 7.6 1.7 5.6 1.7 0.05 0.59 0.02 9.7
72 65.7 24.6 835 18.8 6.0 12.4 17.0 0.23 2.06 0.05 15.2
143 102 36.8 1511 41.0 8.6 23.3 19.7 0.71 2.42 0.10 93.9
Table 8. Soil extractable plant nutrient concentrations in the 0-5 cm soil depth for the Dove
field and Borrow Pit study sites.
The application of the Fluff had a large impact on the soil pH, especially in the soil sampled
after the first growing season. The Fluff would not be a liming material (McLean, 1982), but
because of the near neutral pH and large Ca content of the Fluff material, the application of
Fluff raised the soil pH. In the first year of the study, soil pH had a linear response to
increasing Fluff application at both study sites. This increase in soil pH could be critical to
the establishment of native grasses. Soil pH at or below the 5.3 level would be very detrimental
to plant growth, resulting in nutrient deficiencies and potential Al toxicity (Potash and
Phosphate Inst., 2003). The level of soil pH observed in the control plots would partially
explain the complete failure of plant growth that was observed in the Borrow Pit site.
Fluff rate Ba Cd Cr Ni Pb
Mg ha
-1
(mg kg
-1
)
Dove Field
0 0.63 0.05 0.03 0.08 0.00
18 0.47 0.12 0.11 0.16 0.27
64 0.45 0.08 0.11 0.45 0.03
72 0.45 0.10 0.11 0.22 0.02
143 0.52 0.21 0.28 0.50 0.80
Borrow Pit
0 0.47 0.01 0.01 0.02 0.15
18 0.54 0.01 0.04 0.10 0.31
64 0.75 0.01 0.02 0.05 0.21
72 1.04 0.07 0.14 0.31 0.87
143 1.97 0.13 0.35 0.77 2.26
Table 9. Soil extractable heavy metal concentrations in the 0-5 cm soil depth for the Dove
Field and Borrow Pit study sites.
New Municipal Solid Waste Processing Technology Reduces
Volume and Provides Beneficial Reuse Applications for Soil Improvement and Dust Control
211
Soil C and N concentration was measured at both study sites. Soil C and N concentration is
one of the most important factors for assessing soil quality (Wienhold et al., 2004) that
impacts soil physical, chemical, and biological functions of the soil. The buildup of soil C
can be essential to the long term health of the soil system.
At the Dove Field, in plots where no Fluff was applied, soil C concentration was
approximately 13 g kg
-1
in the surface 0-5 cm depth and declined with increasing soil depth,
down to 3.3 g kg
-1
at the 30-60 cm soil depth layer. Soil N concentration was found to be 0.6
g kg
-1
in the soil surface (0-5 cm) and fell to 0.2 g kg
-1
at the 30-60 cm soil depth layer. These
levels of soil C and N are in the range expected for degraded sandy loam soils in the region.
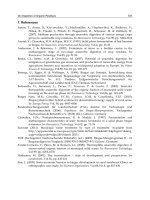
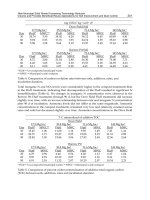
The application of Fluff had a large impact on the soil concentration of C in the soil surface
(0-5 cm), increasing with increasing Fluff application up to approximately 39 g kg
-1
(Fig. 3).
Likewise, a significant linear regression was observed for soil N, increasing with increasing
Fluff application rate (Fig. 3). No significant impact from the application of Fluff was
observed for soil concentration of C and N below the 0-5 cm depth at this location.
In the highly degraded Borrow Pit site, the soil concentrations of C and N were extremely
low where no Fluff had been applied, with a C concentration of 2.2 g kg
-1
and N
concentration of 0.1 g kg
-1
. Interestingly, little difference was observed throughout the entire
soil profile for C and N concentration, as reflected by the extremely low concentrations and
the lack of any plant growth. However, the application of Fluff resulted in a significant
influence on soil C in the surface 0-5 cm depth increment, with an increase to approximately
20.2 g kg
-1
for the 143 Mg ha
-1
Fluff application rate (Fig. 4). Likewise, the soil N level was
increased with increasing Fluff application, to approximately 1.0 g N kg
-1
with the 143 Mg
ha
-1
application rate. This level of increase in soil C and N at this depth demonstrated an
improvement in soil condition and is in the range that would be considered excellent for a
sandy loam soil in this region.
Unlike the Dove Field soil, significant linear regression was observed for increasing soil C
and N with increasing Fluff application below the 0-5 cm depth (Fig. 4). While small
compared to the impact that was observed in the 0-5 cm depth, a distinct increase in both C
and N concentration could be observed with the increasing application of Fluff at the 5-10,
10-20, and 20-30 cm depth increments. This increase could be partially caused by the
movement of soluble C and N compounds deeper into the soil profile. However, this
increase was most likely the result of increased plant rooting with the establishment of the
native grasses. The increased grass biomass observed with increased Fluff application rate
would have been accompanied by increased root biomass below the soil surface resulting in
increased organic matter input into the soil. This improvement in soil C and N not only at
the soil surface where Fluff was incorporated, but deeper into the soil profile would be
invaluable to improving the soil/plant environment on a highly disturbed soil.
The results of this study indicated that the application of a non-composted organic
amendment to highly acidic, degraded soils would improve soil conditions and provide a
healthier soil environment for plant establishment. The improved conditions were most
prominent on the more highly degraded soil, indicating that the more degraded the soil the
higher the potential benefit from the addition of organic amendments (even non-composted
organic amendments).
4.5 Dust control
The organic byproduct of the WastAway Garbage Recycling System has proven effective as
a soil amendment to reestablish native grasses following disturbance on installation training
Integrated Waste Management – Volume I
212
Dove Field
0.0
4.0
8.0
12.0
16.0
20.0
24.0
28.0
32.0
36.0
40.0
0
18 36 72 134
Soil C concentration (g kg
-1
)
Depth
0-5 5-
10 10
-
20 20
-
30
Fluff Application (Mg ha
-1
)
134
0.0
0.4
0. 8
1.2
1.6
2.0
2.4
2.8
3.2
3.6
4.0
0
18 36 72
Dove Field
Soil N concentration (g kg
-1
)
Dove Field
0.0
4.0
8.0
12.0
16.0
20.0
24.0
28.0
32.0
36.0
40.0
0
18 36 72 134
Soil C concentration (g kg
-1
)
Depth
0-5 5-
10 10
-
20 20
-
30
Dove Field
0.0
4.0
8.0
12.0
16.0
20.0
24.0
28.0
32.0
36.0
40.0
0
18 36 72 134
Soil C concentration (g kg
-1
)
Depth
0-5 5-
10 10
-
20 20
-
30
Depth
0-5 5-
10 10
-
20 20
-
30
Fluff Application (Mg ha
-1
)
134
0.0
0.4
0. 8
1.2
1.6
2.0
2.4
2.8
3.2
3.6
4.0
0
18 36 72
Dove Field
Soil N concentration (g kg
-1
)
0.0
0.4
0. 8
1.2
1.6
2.0
2.4
2.8
3.2
3.6
4.0
0.0
0.4
0. 8
1.2
1.6
2.0
2.4
2.8
3.2
3.6
4.0
0
18 36 72
Dove Field
Soil N concentration (g kg
-1
)
Fig. 3. Regression relationships of Fluff application rate to soil C and N concentration
measured at 0-5 5-10, 10-20, and 20-30 cm soil depth at the Field study site in 2004.
0
18 36 72 134
Depth
0-5 5-
10 10
-
20 20
-
30
Borrow Pit
0.0
4.0
8.0
12.0
16.0
20.0
24.0
28.0
32.0
36.0
40.0
Soil C concentration (g kg
-1
)
0
18 36 72 134
Borrow Pit
0.0
0.4
0. 8
1.2
1.6
2.0
2.4
2.8
3.2
3.6
4.0
Soil N concentration (g kg
-1
)
Fluff Application (Mg ha
-1
)
0
18 36 72 134
Depth
0-5 5-
10 10
-
20 20
-
30Depth
0-5 5-
10 10
-
20 20
-
30
Borrow Pit
0.0
4.0
8.0
12.0
16.0
20.0
24.0
28.0
32.0
36.0
40.0
Soil C concentration (g kg
-1
)
0
18 36 72 134
0
18 36 72 134
Borrow Pit
0.0
0.4
0. 8
1.2
1.6
2.0
2.4
2.8
3.2
3.6
4.0
0.0
0.4
0. 8
1.2
1.6
2.0
2.4
2.8
3.2
3.6
4.0
Soil N concentration (g kg
-1
)
Fluff Application (Mg ha
-1
)
Fig. 4. Regression relationships of Fluff application rate to soil C and N concentration
measured at 0-5 5-10, 10-20, and 20-30 cm soil depth at the Borrow Pit study site in 2004.
New Municipal Solid Waste Processing Technology Reduces
Volume and Provides Beneficial Reuse Applications for Soil Improvement and Dust Control
213
lands. Because this material is derived from the organic component of household waste, a
major portion of which is cellulose, it has many peculiar properties offering potential
utilization in many different scenarios, including dust suppression.
Cellulose is the most abundant carbohydrate on Earth and one of the most intensively
studied organic compounds, due to its universal importance in fiber and polymer
production, paper products, and numerous other industrial applications. Lignosulfonate, a
paper processing byproduct, has been extensively used by Departments of Transportation in
the southwestern United States and the forestry industry in the western and southeastern
United States for dust control on unsurfaced county and logging roads (Gebhart and Hale,
1996). Because of the high lignin and cellulose content of Fluff, it shares similar dust control
properties with commercially produced lignosulfonates. Additionally, the textural
characteristics and pore space of Fluff make it an ideal candidate for use as a dust control
agent alone and in combination with other dust control compounds such as vegetable oil
and calcium chloride which have been used in this capacity for decades around the world
(Gebhart et al., 1999).
In June of 2006, a series of field tests were conducted near McMinnville, TN, to evaluate the
performance of Fluff, alone and in combination with vegetable (soybean) oil and calcium
chloride. Three unsurfaced test roads were selected and divided into three segments, each of
which randomly received one of the following treatments: Untreated control; Fluff alone at a
rate of 35.8 Mg/ha; Fluff plus vegetable oil (100 ml/kg Fluff); and Fluff plus 38% Calcium
chloride flake (10g/kg Fluff). Following treatment application, each road segment was
subjected to routine local traffic for a period of 100 days to evaluate dust control efficiency
through time.
At about 50 day intervals, each road segment was subjected to controlled traffic using a
vehicle equipped with a mobile dust plume monitor to determine an emission index for
segments of a given test road. The method chosen to determine the emission index was
mobile monitoring of the PM-10 concentration in a representative part of the dust plume
generated by a test vehicle on the unpaved road. A DustTRAK model 8520 was used for this
purpose, with one second concentration measurements. The inlet to the DustTRAK
sampling line was secured along the side of the test vehicle, thereby sampling the dust
plume from the right front tire. The inlet was placed midway between the front and rear
tires of the test vehicle, thereby avoiding potentially large fluctuations in the plume
concentration due to the wake of the vehicle.
Emissions testing began from a stationary position at the beginning of each test segment and
accelerated to 35 kph for travel and sampling through each segment. Each test provided
nine DustTRAK data runs per test road. Time markers were determined for the DustTRAK
output so that the reference points on the treated road segments could be correlated with the
DustTRAK measurement datalog.
Table 10 shows average PM-10 concentrations for each of the dust control treatments on two
dates for the three test roads. For each test road, the Fluff plus vegetable oil treatment was
found to be the most effective dust control treatment, followed by Fluff plus Calcium
Chloride, Fluff alone, and lastly, the untreated control. During the September 2006 testing,
emission rates were substantially reduced for all test roads because of recent rains and high
moisture content of the road surfaces. Nevertheless, the treated segments still showed
moderate to high levels of control efficiency when compared to untreated segments, indicating
that Fluff, whether alone or in combination with other dust control compounds, has the
potential for low-cost, long-lasting dust control on moderately traveled unpaved roads. Given
Integrated Waste Management – Volume I
214
its proven potential as a soil amendment, this additional use of Fluff demonstrates yet another
beneficial reuse of this municipal solid waste processing byproduct.
Road Sample Date PM-10 Concentration (mg/m3)
Fluff/Oil Fluff/CaCl2 Fluff Untreated
1 7/18/06 0.85 12.26 14.36 107.19
9/20/06 0.07 0.07 0.15 0.83
2 7/18/06 0.61 3.73 5.73 56.91
9/20/06 0.29 0.63 0.81 5.71
3 7/18/06 0.50 3.49 6.66 16.84
9/20/06 0.31 1.01 1.22 2.44
Table 10. Average PM-10 concentration for each dust control treatment measured on two
sampling dates for unpaved test roads near McMinnville, TN.
5. References
Barbour, M.G., J.H. Burk, W.D. Pitts, F.S. Gilliam, & M.W. Schwartz. (1999). Terrestrial Plant
Ecology. (3
rd
Edition, Addison Wesley Longman, Menlo Park, California
Barthes, B., A. Albrecht, J. Asseline, G. De Noni, & E. Roose. (1999). Relationship between
soil erodibility and topsoil aggregate stability or carbon content in a cultivated
Mediterranean highland (Aveyron, France). Communications in Soil Science and Plant
Analysis 30:1929-1938.
Bengston, G.W. & J.J. Cornette. (1973). Disposal of composted municipal waste in a
plantation of young slash pine: Effects on soil and trees. J. Environ. Quality 2:441-
444.
Bernal, M.P., M.A. Sanchez-Monedero, C. Paredes, & A. Roig. (1998). Carbon mineralization
from organic wastes at different composting stages during their incubation with
soil. Agriculture, Ecosystems, and Environment 69, 175-189.
Bonham, C.D. (1989). Measurements for Terrestrial Vegetation. John Wiley & Sons, New York,
New York
Bouldin & Lawson, Inc. (2000). Process of transforming household garbage into useful
material. United States Patent 6017475. Date issued 25 January 2000.
Brejda, J.J. (2000). Fertilization of native warm-season grasses. p. 177-200. In Native warm
season grasses: Research trends and issues. K.J. Moore & B.E. Anderson, (Eds.), CSSA
Special Publication Number 30. Crop Science Society of America and American
Society of Agronomy, Madison, Wisconsin
Bremner, J.M. (1996). Nitrogen- total. Pages 1085-1121 In: Methods of Soil Analysis. Part 3.
Chemical Methods. J.M. Bartels, (Ed.), American Society of Argonomy and Soil
Science Society of America, Madison, Wisconsin
Busby, R.R., D.L. Gebhart, H.A. Torbert, J.O. Dawson, G.A. Bollero, K.N. Potter, & D.R.
Curtin. (2010). Effects of a new waste processing byproduct on soil and vegetation
at Fort Campbell, TN. Commun. Soil Sci. Plant Anal. 41:250-266.
Busby, R.R., H.A. Torbert & D.L. Gebhart. (2007). Carbon and nitrogen mineralization of
non-composted and composted municipal solid waste in sandy soils. Soil Biology &
Biochemistry 39:1277-1283.
New Municipal Solid Waste Processing Technology Reduces
Volume and Provides Beneficial Reuse Applications for Soil Improvement and Dust Control
215
Busby, R., D.L. Gebhart, & H.A. Torbert. (2006). Effects of an uncomposted municipal waste
processing byproduct on prairie grass establishment. Agron. J. 98 :1073-1080.
Busby, R.R. (2003). Suitability of a municipal solid waste byproduct as a soil amendment for
reestablishing native grasses on disturbed Army training lands. M.S. Thesis.
University of Illinois, Urbana-Champaign, Illinois
Chanyasak, V., A. Katayama, M. Hirai, S. Mori, & H. Kubota. (1983a). Effects of compost
maturity on growth of Komatsuna (Brassica rapa, var. pervidis) in Neubauer’s pot.
I Comparison of growth in compost treatments with that in inorganic nutrient
treatments as controls. Soil Science and Plant Nutrition 29:239-250.
Chanyasak, V., A. Katayama, M. Hirai,,S. Mori, & H. Kubota. (1983b). Effects of MWC
maturity on growth of Komatsuna (Brassica rapa, var. pervidis) in Neubauer’s pot.
II Growth inhibitory factors and assessment of degree of maturity by org-C/org-N
ratio of water extract. Soil Science and Plant Nutrition 29:251-259.
Claassen, V.P., & J.L. Carey. (2004). Regeneration of nitrogen fertility in disturbed soils using
composts. Compost Science & Utilization 12:145-152.
Cooperband, L.R., A.G. Stone, M.R. Fryda, & J.L. Ravet. (2003). Relating compost measures
of stability and maturity to plant growth. Compost Science & Utilization 11,113-124.
Croxton, S.D., J.L. Sibley, W. Lu, & M. Schaefer. (2004). Evaluation of Composted Household
Garbage as a Horticultural Substrate. Pp 296-299 In: Proceedings of the Southern
Nursery Association 2004 Research, Retrieved from
Department of Defense (DoD). (2001). Base structure report: Fiscal year 2001 baseline. Office
of the Deputy Under Secretary of Defense, Installations and Environment. Washington,
D.C.
Drake, L.D. (1983). Erosion Control With Prairie Grasses in Iowa Strip-mine Reclamation. p.
189-197. In C.L. Kucera (ed.) Proceedings of the 7
th
North American prairie conference,.
Springfield, Mississippi, August 1980.
Edwards, J.H. (1997). Composition and Uses of Uncomposted Wastepaper and Other
Organics. In: Agricultural uses of byproducts and wastes Rechcigl and
MacKinnon,(Eds.)American Chemical Society. Washington, DC.
Gebhart, D.L. & T.A. Hale. (1996). Dust control material performance on unsurfaced
roadways and tank trails. Technical Report SFIM-AEC-ET-CR-96196, U.S. Army
Environmental Center, Aberdeen, Maryland
Gebhart, D.L., M.L. Denight, & R.Grau. (1999). Dust control guidance and technology
selection key. Technical Report SFIM-AEC-EQ-CR-99002, U.S. Army Environmental
Center, Aberdeen, Maryland
Gilley, J.E. & L.M. Risse. (2000). Runoff and soil loss as affected by the application of
manure. Transactions of the ASAE 431583-1588.
Glinski J. & J. Lipiec. (1990). Soil Physical Condition. CRC Press, Inc., Boca Raton, Florida.
Hudson, B.D. (1994). Soil organic matter and available water capacity. Journal of Soil and
Water Conservation 49:189-194.
Hue, N.V., & C.E. Evans. (1986). Procedures used for soil and plant analysis by the Auburn
University Soil Testing Laboratory. Auburn University, Auburn, Alabama.
Jimenez, E.I., & V.P. Garcia. (1989). Evaluation of city refuse compost maturity: A review.
Biological Wastes 27:115-142.
Integrated Waste Management – Volume I
216
Jenkinson, D.S. (1966). The priming action. In: The use of Isotopes in Soil Organic Matter
Studies. Report of the FAO/IAEA Technical Meeting. Pergamon Press, London,
England
Jung, G.A., J.A. Shaffer, & W.L. Stout. (1988). Switchgrass and big bluestem response to
amendments on strongly acid soil. Agron. J. 80:669-676.
Kabata-Pendias, A. (2001). Trace Elements in Soils and Plants (3
rd
edition) CRC Press, Boca
Raton, Florida
Karlen, D.L., J.R. Russell, & A.P. Mallarino. (1998). A System Engineering Approach for
Utilizing Animal Manure. p. 283-315. In: Animal waste utilization: Effective use of
manure as a soil resource, J.L. Hatfield and B.A. Stewart (Eds.).Ann Arbor Press,
Chelsea, Michigan
Launchbaugh, J.L. (1962). Soil fertility investigations and effects of commercial fertilizers on
reseeded vegetation in West-Central Kansas. Journal of Range Management 15:27-34.
Levy, D.B., E.F. Redente, & G.D. Uphoff. (1999). Evaluating phytotoxicity of Pb-Zn tailings
to big bluestem (Andropogon gerardii Vitman) and switchgrass (Panicum virgatum
L.). Soil Science 164:363-375.
McDowell, R.W., 7 A.N. Sharpley. (2003). The effects of soil carbon on phosphorous and
sediment loss from soil trays by overland flow. J. Environ. Qual. 32:207-214.
McLean, E.O. (1982). Soil pH and lime requirement. In: Methods of soil analysis: Part 2.
Agron. Monogr. 9. A. L. Page, (Ed.) American Society of Agronomy and Soil Science
Society of America, Madison, Wisconsin.
McLendon, T. & E.F. Redente. (1992). Effects of nitrogen limitation on species replacement
dynamics during early succession on a semiarid sagebrush site. Oecologia 91:312-
317.
Mengel, K. & E.A. Kirkby. (1982). Principles of Plant Nutrition (3
rd
ed.) International Potash
Institute, Bern, Switzerland.
Mehlich, A. (1984). Mehlich III soil test extractant: A modification of Mehlich II extractant.
Communications in Soil Science and Plant Analysis 15:1409-1416.
Morgan, J.P. (1994). Soil impoverishment: a little-known technique holds potential for
establishing prairie. Restoration & Management Notes 12:55-56.
Munshower, F.F. (1994). Practical Handbook of Disturbed Land Revegetation. Lewis Publishers,
Boca Raton, Florida
Nelson, D.W. & L.E. Sommers. (1996). Total carbon, organic carbon, and organic matter.
Pages 961-1010 In Methods of Soil Analysis. Part 3. J.M. Bartels, (Ed.), American
Society of Agronomy and Soil Science Society of America, Madison, Wisconsin.
Noyd, R.K., F.L. Pfleger, M.R. Norland, & M.J. Sadowsky. (1995). Native prairie grasses and
microbial community responses to reclamation of taconite ore tailing. Canadian
Journal of Botany 73:1645-1654.
Noyd, R.K., F.L. Pfleger, & M.R. Norland. (1996). Field responses to added organic matter,
arbuscular mycorrhizal fungi, and fertilizer in reclamation of taconite ore tailing.
Plant and Soil 179:89-97.
Paschke, M.W., T. McLendon, & E.F. Redente. (2000). Nitrogen availability and old-field
succession in a shortgrass steppe. Ecosystems 3:144-158.
Prior, S.A., G.B. Runion, H.A. Torbert, & D.C. Erbach. (2004). A hydraulic coring system for
soil-root studies. Agron. J. 96:1202-1205.
New Municipal Solid Waste Processing Technology Reduces
Volume and Provides Beneficial Reuse Applications for Soil Improvement and Dust Control
217
Potash and Phosphate Institute. (2003). Soil Fertility Manual. Potash & Phosphate Institute
and the Foundation for Agronomic Research. Norcross, Georgia
Reever Morghan, K.J. and T.R. Seastedt. (1999). Effects of soil nitrogen reduction on
nonnative plants in restored grasslands. Restoration Ecology 7:51-55.
Sharrow, S.H. & D.A. Tober. (1979). Technical note: a simple, lightweight point frame.
Journal of Range Management 32:75-76.
Skeel, V.A. and D.J. Gibson. (1996). Physiological performance of Andropogon gerardii,
Panicum virgatum, and Sorghastrum nutans on reclaimed mine spoil. Restoration
Ecology 4:355-367.
Soil Series Classification Database (2008). Soil Survey Staff, Natural Resources Conservation
Service, United States Department of Agriculture. Retrieved from:
Soil Survey of Montgomery County, Tennessee. (1975). United States Department of
Agriculture, Natural Resources Conservation Service.
Soil Survey of Muscogee County, Georgia. (1983). United States Department of Agriculture,
Natural Resources Conservation Service.
Solid Waste Annual Reporting (SWARweb) (2003). United States Department of Defense.
Retrieved from:
Soltanpour, P.N., G.W. Johnson, S.M. Workman, J.B. Jones, Jr., & R.O. Miller. (1996).
Inductively coupled plasma emission spectrometry and inductively coupled
plasma-mass spectrometry. In Methods of Soil Analysis. Part 3. Chemical Methods, J.M.
Bartels, (Ed.), American Society of Agronomy and Soil Science Society of America,
Madison, Wisconsin.
Terman, G.L., J.M. Soileau, & S.E. Allen. (1973). Municipal waste compost: Effects on crop
yields and nutrient content in greenhouse pot experiments. J. Environ. Qual. 2:84-89.
Torbert, H.A., R.R. Busby, D.L. Gebhart, K.N. Potter, & D.R. Curtin. (2007). Effects of an
uncomposted municipal waste processing byproduct on soil reclamation. J. Plant
Nutrition 30:755-772.
Torbert, H.A., S.A. Prior, H.H. Rogers, & G.B. Runion. (1998). Crop residue decomposition
as affected by growth under elevated atmospheric CO
2
. Soil Sci.163:412-419.
U.S. Government 40 C.F.R. Part 503. (1999). Standards for the use or disposal of sewage
sludge. United States Code of Federal Regulations Title 40 Part 503, 1999 edition. College
Park, Maryland
United States Environmental Protection Agency (USEPA). (1998). Test methods for evaluating
solid wastes: Physical/chemical methods, Revision 5. EPA SW-846.
USDOD. (2001). Base structure report: Fiscal year 2001 baseline. Office of the Deputy Under
Secretary of Defense, Installations and Environment.
USDOD. (2003). Solid Waste Annual Reporting (SWARweb) Retrieved from
USEPA. (2005). Municipal solid waste generation, recycling, and disposal in the United
States: Facts and figures for 2003. EPA530-F-05-003. Solid Waste and Emergency
Response, Washington, DC.
Warnes, D.D. & L.C. Newell. (1998). Establishment and yield responses of warm season
grass strains to fertilization. Journal of Range Management 22:235-240.
Waste and Recycling: Data, Maps, and Graphs, (2002). Counting waste, but what is waste?
Retrieved from
Integrated Waste Management – Volume I
218
Wedin, D. & D. Tilman. (1993). Competition among grasses along a nitrogen gradient: Initial
conditions and mechanisms of competition. Ecological Monographs 63:199-229.
Wedin, D.A. & D. Tilman. (1996). Influence of nitrogen loading and species composition on
the carbon balance of grasslands. Science 274:1720-1723.
Wong, M.H. (1985). Phytotoxicity of refuse compost during the process of maturation.
Environmental Pollution (Series A) 37:159-174.
Wienhold, B.J., S.S. Andrews, & D.L. Karlen. (2004) Soil quality: a review of the science and
experiences in the USA. Environment Geochemical Health. 26:89-95.
Wilson, S.D. & A.K. Gerry. (1995). Strategies for mixed-grass prairie restoration: herbicide,
tilling, and nitrogen manipulation. Restoration Ecology 3:290-298.
Zhang, H., K.H. Hartke, & H. Ringe. (1997). Effectiveness of organic matter incorporation in
reducing soil compactibility. Soil Sci. Soc. Am. J. 61:239-245.
Zucconi, F., M. Forte, A. Monaco, & M. de Bertoldi. (1981a). Biological evaluation of compost
maturity. BioCycle 22:27-29.
Zucconi, F., A. Pera, M. Forte, & M. de Bertoldi, (1981b). Evaluating toxicity of immature
compost. BioCycle 22:54-57.
12
Waste to Energy, Wasting Resources
and Livelihoods
Jutta Gutberlet
Department of Geography, University of Victoria
Canada
1. Introduction
Not recovering the material embedded in solid waste means wasting resources and thus
reinforcing the pressure to further extract natural resources for the manufacturing of new
products. Industrial ecology, life cycle analysis, material flow analysis, ecological footprint
and other approaches and concepts have long ago already demonstrated the necessity and
possibilities of reintegrating recyclable materials into production flows, reducing the waste
of resources and thus sparing the environment. Far too often however, business is done as
usual and the status quo of production and consumption is not altered significantly.
The prevailing perceptions of waste are still based on the understanding that waste is
something worthless, unused or has ceased to be useful for human purpose. The word
waste comes from the Latin vastus, meaning unoccupied or desolate and is akin to the Latin
vanus (empty or vain) (Lynch, 1990). Originally waste meant something useless and hostile
to humans, to be ignored and discarded. Products and packaging usually have a defined
lifespan. Sometimes the product life is shortened for the purpose of inducing larger
consumption rates. Nor producer, nor consumer are generally concerned about the final
destination of these materials. However, with reuse and recycling these materials again
become potential resources. Legislation implementing reverse logistics has the potential to
alter the established wasteful cycles. Incineration to recover the energy from waste can not
be considered a sustainable recycling practice, since it is not an energy efficient process and
once burnt the resources are gone for ever.
The statistics evidence that we live in a time of waste explosion. Never has humanity
generated so much refuse during production and garbage after consumption as in current
times. It is estimated, for example, that globally, 20–50 million tons of E-Waste, the newest
category of waste, which includes electronic and electric equipment, are discarded annually
(Ongondoa et al., 2011). The authors confirm that the penetration of electronic equipment in
a number of countries in the global South is approaching the level of industrialized
countries. In Brazil the increasing generation of E-Waste is becoming a noticeable concern.
Most of this waste comes from obsolete mobile phones, telephones, TVs, computers, radios,
washing machines, refrigerators and freezers. In 2006, the per capita E-Waste rate in Brazil
already stood at 2.6 kg, compared to the global average of 1 kg/per person/per year (Rocha,
2009).
Even remote rural towns, almost everywhere, have to deal with increasing generation of
waste and growing complexity of the waste composition. At the same time household
Integrated Waste Management – Volume I
220
garbage has become more industrialized, more toxic and less biodegradable. With the
advent of globalised mass consumption, coupled with the lack of adequate spaces to discard
these materials, particularly in city regions, Governments, producers and consumers are
under pressure to find adequate solutions to the problems created by solid waste.
In the forefront of the current waste management debate is the promotion of new
technologies for waste treatment. Less attention is given to considerations that suggest
resource economy, reuse, recycling and changes in production, consumption and lifestyles
to generate less waste at first. Recommendations that question the continuous, growth
oriented economic development and consumption patterns are less popular and usually
silenced in order to maintain the status quo. Marxist perspectives underline the fact that
capitalism requires a steady acceleration of wasting, discarding and abandonment, in order
to keep a scarcity of goods. Scarcity coupled with an artificial inflation of consumer desires,
increases the throughput of material in our system, and thus maintains the rate of profit in
the face of its progressive tendency to fall.
Solid waste incineration is propagated by business and the media as an efficient
management solution, because of the rapid handling of the discarded materials, the
diminished need for new landfills and the generation of energy as a by-product. Yet, the
environmental and social dimensions of this technological approach to waste often remain
unconsidered. Social and environmental injustice may arise from locating these technologies
and from displacing the workers who already make a living through resource recovery.
Deliberating authorities often overlook the wider implications from deviating recyclable
materials away from the recycling sector.
This chapter will analyze the recent emergence of ‘waste for energy’ (WfE) proposals in
Brazil. The discussion will consider particularly the social perspectives related to waste
management decisions, looking at existing informal and organized recycling schemes. The
government supported selective waste collection and recycling initiatives in the cities of
Diadema and Londrina will showcase viable solutions in integrated waste management.
Expensive ‘waste to energy’ schemes are considered unsustainable for generating
environmental harm and for perpetuating the waste of natural and human resources.
1.1 Trends in household waste generation
“People consume leisure, space and time as if our lives were simply an eating up and a throwing
away […] it is clear that capitalism, once it is connected to the mass market, is motivated to increase
consumption” (Lynch, 1990, p. 148).
Unsustainable lifestyles have permitted and motivated ruthless natural resource extraction
with disastrous results for the environment, and in particular for indigenous and traditional
communities. Media reports on new environmental and social impacts from mining, fishing,
forestry, cattle ranching, industrial activities, transportation, tourism, etc. reach us every day
through Internet, radio, television, theatre, art, film, music and written sources. The links
between resource over-exploitation and environmental disasters (culminating in climate
change) seem direct and clear and yet are ignored or denied. In fact, most societies consume
more resources than a sustainable living would allow. The prevailing western economic
development model has allowed for unprecedented accumulation of wealth while the
number of socially and economically excluded people continues on the rise. Naomi Klein
evidences these perverse facets of economic growth based on the exploitation of nature and
society in her book ‘The shock doctrine’ (Klein, 2008). The price we pay in terms of losses in
biodiversity and cultural diversity is high, just to maintain, further disseminate and
Waste to Energy, Wasting Resources and Livelihoods
221
accelerate the status quo of mass consumption and unsustainable lifestyles. The problems
generated by increasing waste quantities are ubiquitous.
The quantity of solid waste, in Europe and North America in particular, has increased in
close relation to economic growth, over the past decades, attested by the growing solid
waste quantities along with increases in Gross Domestic Products (GDPs). A Swedish study
from Sjöström and Östblom (2010), for example, mentions a total quantity of municipal
waste per capita increase of 29% in North America, 35% in OECD countries, and 54% in the
EU15 between 1980 and 2005.
Packaging magnifies the task of household disposal because of its bulky proportions and its
mixture with decomposable garbage. For the sake of convenience and the prevention of
spoilage and disease products are wrapped more than ever, often using materials, which do
not decompose, are toxic, or are still difficult to recycle.
Although household waste manifests only a fraction of the solid waste generated, its
reduction can be key in promoting a paradigm shift towards more sustainable production
and consumption patterns. Construction waste, industrial waste, mining waste, and
agricultural waste are also linked to consumption and lifestyles. In 2005, the UK produced
approximately 46.4 million tons of household and similar waste with 60% of this landfilled,
34% recycled and 6% incinerated. Only 11% of the estimated waste was household waste,
compared to 36% construction and demolition, 28% mining and quarrying, 10% industrial,
13% commercial waste, and less than 1% agricultural and sewage waste (Department for
Environment, Food and Rural Affairs [DEFRA], 2006).
Despite the prevailing waste of resources, there are also initiatives concerned with the
reduction and ultimately the generation of zero waste. Banning plastic bags is often one of the
first actions promoted by local governments and some business towards reducing plastic
waste and, although important, only targets the tip of the iceberg. Lifestyle changes
suggested under the voluntary simplicity initiative are perceived as another form of
individuals impacting these developments. These measures are all important, however they
need to come together with policy instruments in order to reduce waste intensities and to
alter the final destination of waste.
1.2 Trends in municipal solid waste management
Although worldwide landfilling is on average still the most widespread form of waste
disposal, more and more cities are moving away from waste deposits towards recycling and
incineration. In India almost 90% of the collected household waste is still deposited at
uncontrolled sites (Talyan et al., 2008). In Turkey too, dumping solid waste on open sites is
still the prevailing method, followed by sanitary landfills (Agdag, 2009; Turan et al., 2009).
The final destination in the United Kingdom, Canada and the United States for over 50% of
the household waste is still the controlled landfill, however here too the trend goes towards
increased recycling. Sweden is one of the few countries, which already has a reduced
percentage of waste disposed at landfills; and it is also one of the countries with the highest
waste incineration rate (Persson, 2006).
Less generation of waste, more material recovery, energy from waste and much less landfills
seems to be the guiding principles in many European countries (DEFRA, 2007). Within
recent decades, one of the major arguments for waste incineration in the global North has
been the energy generation from solid waste and the potential fossil fuel saving. The
following table summarizes some country’s waste incineration capacities (Table 1).
Integrated Waste Management – Volume I
222
Similar developments are occurring in North America. In the US for example already 12.6%
of the household waste was incinerated in 2007 (Vyhnak, 2008). Japan, South Korea, Taiwan
and Singapore are the Asian countries with the largest number of incinerators (Gohlke &
Martin, 2007; Bai & Sutanto, 2002). In Latin America the number of incinerators is still small
and addresses mainly hospital and industrial waste. In the 1970s and early 1980s municipal
governments in São Paulo and Buenos Aires had contemplated the expansion of incinerators
for household waste, however, at that time social mobilization and the high cost of this
technology prevented its establishment. Waste incineration has now re-emerged in Brazil
and in other countries in Latin America as ‘waste for energy’ plants.
Country Number of establishments Tons/year
Holland 11 488,000
UK 19 266,000
Sweden 31 136,000
France 210 132,000
Italy 32 91,000
Table 1. WfE establishments in some European countries. Source: Longden et al., 2007;
European Environmental Agency [EEA], 2009).
How do cities in Brazil cope with the rapidly mounting quantities of discarded material? In
Brazil 25.5% of the municipalities still dump their waste on uncontrolled landfills, while
another 19.6% deposits the waste on controlled landfills (Associação Brasileira de Empresas
de Limpeza Pública e Resíduos Especiais [ABRELPE], 2007). Officially the recycling rate in
Brazil is still insignificant, with approximately 2% of the waste being recovered through
government supported selective waste collection programs (Brazil, 2009). Throughout
Brazil, as well as in other Latin American and Asian countries there are numerous
experiences where organized recycling groups engage at different levels with Government
in order to perform selective waste collection in their city. In many cases the recyclers have
already established a history in the community with door-to-door collection and
partnerships with business and industry. It is important to note that the official number for
recycling does not include the effort of tens of thousands of informal recyclers working
throughout Brazil, as well as in most other countries in the global South. In Brazil, for
example, there are between 800,000 to one million informal and organized recyclers (called
catadores), according to the national recyclers movement (Movimento Nacional de Catadores
de Materiais Recicláveis [MNCR], 2010). These people make a livelihood from resource
recovery, contribute to resource savings, and diminish environmental hazards by
redirecting the materials.
Uncontrolled landfills, such as the famous Gramacho landfill in the metropolitan region of
Rio de Janeiro, recently portrayed in the award winning movie Waste land and in the
documentary ‘Beyond Gramacho’, are still a reality in some parts of Brazil. With the
implantation of the recently approved federal solid waste management law (Law
Nº12.305/2010 - Política Nacional de Resíduos Sólidos), however, the days of uncontrolled
landfills are counted until 2014, when all uncontrolled waste dumps need to be eliminated
and every city is required to have their waste management plan in place.
Waste to Energy, Wasting Resources and Livelihoods
223
Given the pressure on municipalities to finding adequate forms of waste management,
many governments perceive incineration as a quick and simple alternative. Thermal and
bio-mechanic treatment of waste is gaining momentum in many parts of Brazil, as
municipalities in Latin America and Asia are being offered expensive Waste for Energy
technology as a solution to their waste crisis.
2. Social and economic reflections on Waste for Energy (WfE)
This section introduces social, environmental, and philosophical questions related to Waste
for Energy, without detailing the technical aspects of the various technologies. As discussed
earlier there is a tendency in Europe and North America to set up waste for energy plants,
supported by specific funding programs and converging energy and waste legislation. In
England for example the Energy White Paper (Department of Trade and Industry, 2007) and
the Waste Strategy for England (DEFRA, 2007), advocate for waste being a resource to
generate biomass fuel as well as heat and power. “Energy from waste is expected to account
for 25% of municipal waste by 2020 compared to 10% today” (DEFRA, 2007, p. 7). There
have already been a number of inter related projects that have facilitated investment in
renewable energy and waste infrastructure.
To transform solid waste into energy is an attractive proposal, given the pressure put on
governments in terms of achieving greater shares of energy from renewable sources. For
example, the EU’s target to achieve alternative energy supply is at 20% by 2020. Increased
recovery of energy from waste is interpreted as a key objective to help reduce greenhouse
gas emissions by diverting greater amounts of biodegradable waste away from landfills and
by increasing the recovery of energy from waste. In the EU governments have promoted
measures to stimulate energy recovery from solid waste. Such measures include the
“banding of the Renewables Obligation (‘RO’), extending enhanced Capital Allowances
(‘ECAs’) to include Solid Recovered Fuel (‘SRF’) related equipment along with a heightened
expectation for energy generated from waste management activity to achieve the most
climate change friendly outcome through the use of ‘CHP’ [combined heat and power]”
(DEFRA et al., 2009, p. 4).
Recent technology developments see solid waste converted into recovered fuel pellets.
These would, for example, be produced locally and transported to large-scale gasification
and petrochemical facilities to be used in substitution for diesel or gasoline fuel. The
European oil and automotive industries are supportive of WfE technology as a means to
meet the current and future bio-fuel directive. Solid waste recovered fuel is “prepared from
non-hazardous waste to be utilised for energy recovery in incineration or co-incineration plants…”
(DEFRA et al., 2009, p. 9). The critique from environmentalists is usually related to climate
change impacts with carbon dioxide generation from these plants and the high costs for this
technology. These expenses could be invested in more environmentally sound and climate
friendly energy, tackling the problem at the roots.
The examples on energy policy supporting the use of solid waste as ‘alternative’ fuel in the
UK, are representative for the trend in many countries in Europe and North America. Rising
prices for fossil fuel over the past decade are often mentioned to justify WfE. Waste fuels are
eligible for revenues under the Renewables Obligation and the EU Emissions Trading Scheme.
Existing protocols and standards for the use of waste fuels are adjusted to facilitate the
options provided by WfE. Particularly climate change and renewable energies legislation
consider WfE technology a legitimate form to be funded under Carbon gaining funds.
Integrated Waste Management – Volume I
224
Industry has addressed the negative image that is attached to waste incineration by
referring to the technology primarily as energy recovery form. The following quote
highlights a dominant engineering perspective, failing to understand the larger
environmental and social picture. “Waste should be regarded as a fuel rather than
something which needs to be treated - Unfortunately, most legislation over recent years has
erroneously and dogmatically focused on WfE as waste treatment rather than as energy
production, and has attempted to deal with an WfE plant as if it were an incinerator, rather
than a power station” (Institution of Mechanical Engineers, n.d., p. 18).
Waste management decisions often favour incineration as a quick and efficient solution and
governments assist the process of obtaining local planning consent and licensing
implantation for WfE plants as power plants. In addition, there are many other drivers for
WfE, including:
Increasing costs of WfE treatment (and disposal),
rising energy demands,
potential to quickly reduce the large volume of waste generated daily,
understanding that energy can be generated from waste and converted into electricity,
erroneously promoted as “green energy”,
reduced costs with workforce,
potential to receive government revenue or to avoid costs from the use of waste fuels.
The trends observed in countries in the global North are making its way to the countries in
the global South. Here the public is usually not well informed about the risks, the costs or
alternatives. Multinational concerns and consulting firms approach governments in these
countries to showcase the technology and to promote accessible public-private funding
schemes for local governments to implement WfE technology. Most often these decision
processes happen without ample community awareness and participation.
2.1 Major concerns with Waste for Energy approaches
WfE is not a form of recycling
Solid waste incineration with energy recovery is often referred to as recycling, and is
therefore credited with the benefits and the positive image of recycling. However, the term
‘recycling’ means “recovery and reprocessing of waste materials for use in new products. The basic
phases in recycling are the collection of waste materials, their processing or manufacture into new
products, and the purchase of those products, which may then themselves be recycled” (Britannica
Online Encyclopedia, n.d.). Following this rational, solid waste is understood as renewable
resources. However, the resource solid waste is only renewable if recycled. Waste to energy
makes it a non-renewable resource.
Furthermore, with WfE the need to adopt a materials flow, a cyclical approach is not met.
This technology does not involve a cyclical course, since the material dies with
incineration. WfE is considered recycling, however, the final product of this industry is
energy, which is a final stage, whereas in material recycling any other product can be
recycled at least twice.
WfE is not a ‘green’ technology
WfE is often considered a ‘green’ technology because it reduces potential methane gas
emissions, which would be generated at the landfill. However, the incineration process itself
also generates greenhouse gas emissions, despite the claim of being a Carbon saving
mechanism.
Waste to Energy, Wasting Resources and Livelihoods
225
Depending on the material, on the process and the local circumstances, recycling also results
in a net reduction of greenhouse gas emissions, however, with the benefit of also reducing
emissions related to new resource extractions. Organic waste recycling and composting
though benefit the methane gas reduction at landfills.
WfE is not energy efficient
Despite WfE not necessarily being energy efficient, in the UK this technology is considered
under the Renewable Obligation Certificate (ROC), which is the main support scheme for
renewable electricity projects in the UK. It places an obligation on UK suppliers of electricity
to source an increasing proportion of their electricity from renewable sources. Ironically
WfE falls under this regime. In the UK, combined heat and power plants (CHP) continue to
receive 1 ROC/MWh of electricity generated and Biomass CHP plants will receive 2
ROCs/MWh (DEFRA et al., 2009).
Growth oriented WfE
WfE assumes growth in solid waste generation. For example, in the UK the expected
increase of 1.5% per year signifies an arising of 37 million tons of waste in the year 2020
(DEFRA, 2007). Again the proposal of WfE is anchored in a growth-oriented paradigm. In
order for WfE to be considered economical al and to meet the continuous increased energy
demands, there will have to be an ever-increasing amount of solid waste, which is
unsustainable.
Decisions to implement WfE are usually not participatory
The need to engage with all stakeholders is not met in the case of the recent expansion of
this technology in Brazil. Informal and organized recyclers are major stakeholders in waste
management and they are excluded from the decision making process.
2.2 Multinational funding of Waste for Energy
In the early 1990s the trend of the private sector becoming more independent of government
agencies and the public sector becoming more businesslike started to become noticeable
(Larkin, 1994). Economic globalization has allowed for the private initiative and particularly
large corporations to expand into basic infrastructure and service provision, which until
then were generally provided through the government. Municipal waste management was
one of the last public sectors to become explored by private capital. During the past few
years large-scale technologies such as incineration or automatized selective separation
plants have massively entered the waste management market, also in the global South.
Public Private Partnerships (PPP) and Private Funding Initiatives (PFI) are common in the
funding of these expensive incineration technologies. PPPs are considered an alternative to
full privatization and a solution for municipalities to tackle basic infrastructure and service
provision related to water, sewage and waste. Rapidly increasing urban population,
following consumption-oriented lifestyles, has generated serious disposal problems in most
cities in the global South.
Through PPPs “government and private companies assume co-responsibility and co-
ownership for the delivery of city services … [and] the advantages of the private sector—
dynamism, access to finance, knowledge of technologies, managerial efficiency, and
entrepreneurial spirit—are combined with the social responsibility, environmental
awareness, local knowledge and job generation concerns of the public sector” (Ahmed &
Ali, 2004, p. 471). Ideally this arrangement should improve the efficiency of the entire solid
waste management sector. This means, however, that governments can become locked into