Environmental Impact of Biofuels Part 9 pot
Bạn đang xem bản rút gọn của tài liệu. Xem và tải ngay bản đầy đủ của tài liệu tại đây (650.16 KB, 20 trang )
Environmental Impact of Biofuels
152
mandates for quantities to be produced or blended. These policies may promote
investments in environmental protection and related technology development, while they
can also distort markets and are subject to political decisions that may make them
unsustainable. At the same time, some policies strive at maximizing the economic benefit,
but will cause environment degradation. An example of this is the U.S. volumetric tax credit
for cellulosic biofuels, that does not differentiate across feedstocks and rewards
monocultures of high-yielding biofuels per unit of land and are therefore unlikely to create
incentives for maintaining biodiversity (Khanna et al., 2009).
7.1.1 Climate change mitigation vs. energy security
Biofuels are attractive to governments which can diversify energy budget and reduce their
exposure to international oil market to maintain economic sustainability. Corn-based
ethanol in the United States and sugarcane-based ethanol in the Brazil have been built
successfully with this objective in mind. While the well–to-wheel environmental benefits are
different, such as sugarcane-based ethanol and cellulosic biofuels may achieve significant
reduction of GHG, the corn-based ethanol performs poorly due to intensive fossil fuel input
(Vermeulen et al., 2008).
7.1.2 GHG vs. other environmental goods
Besides GHG emission reduction, there are many other environmental benefits associated
with a biobased economy, such as decreasing soil erosion, water eutrophication, loss of
biodiversity, that should be considered. Treating GHG emissions as the only environmental
cost, with no concern for other environment threats, can probably result in the other
environmental goods and services, such as soil, water and biodiversity, becoming the
unintended casualties. Decision makers need to include the full range of desired
environmental outcomes in the design of appropriate and robust biofuel policies.
7.2 Environment and society
Emphasis on biofuels as renewable energy sources has developed globally. The use of food
crops for biofuel production raises major nutritional and ethical concerns (Pimentel et al.,
2009). As a result some trade-offs may exist. One such trade-offs is use of agricultural
commodities for food vs. for fuel production.
The food versus fuel debate arises because increased use of land and water for bioenergy
production reduces the availability of these resources to produce food for human
consumption. The competition is direct in terms of first generation biofuel production that
uses feedstocks of cereal grains (e.g. corn, wheat, etc.), oilseeds (e.g. rapeseed, soybean,
palm oil), or other crops (e.g. sugar cane) that are conventionally used for food. However,
even if the bioenergy feedstock crop is not suitable for food directly, it uses land that could
be used for food production.
Secure and affordable food is basic to social sustainability. However, bioenergy may be at
the origin of social benefits in providing better quality of life for rural population. It also has
great potentials to mitigate environmental impacts. Therefore, if bioenergy is seen as a net
environmental benefit, then the extent to which bioenergy production threatens the supply
of secure and affordable food becomes an environment and society trade-off. However, if
bioenergy is seen as environmental benefit, then the trade-off becomes between society and
environment.
Biobased Economy – Sustainable Use of Agricultural Resources
153
7.3 Economy and society
Usually, it is hard to clearly distinguish between economic and social issues. While
economic sustainability emphasizes the economic feasibility and viability, society
sustainability focuses more on distribution, human health, human rights and equity. Some
social conflicts hide behind the economic benefit maximization. For example, the smaller
scale operations generally have higher cost. However, the social sustainability policy goals
for biofuels include promotion rural development and inclusion of small farmers. This trade
off is important as many commodity dependent developing countries are characterised by a
high proportion of small producers (Vermeulen & Vorley, 2007).
If an industrialized form of bioenergy crop cultivation is practiced, then the land required
will most probably be controlled by large land owners or national companies (WWF, 2006).
From maximization of the economic profits, crop cultivation tends to be industrialized
which in turn will affect small landowners and poor people’s right and welfare. Land
ownership should be equitable, and land-tenure conflicts should be avoided. This requires
clearly defined, documented and legally established tenure rights. To avoid leakage effects,
poor people should not be excluded from the land. Customary land-use rights and disputes
should be identified. A conflict register might be useful in this context (WWF, 2006).
7.4 SWOT analysis of biobased economy development
A Strength-Weakness-Opportunities-Threats (SWOT) analysis of the biobased economy is
developed which would help decision makers understand strengths and need for
developing appropriate policies to overcome limitations for such developments in the
future. This analysis is presented in Table 3. One can see whether taking an action or
building a project based on biobased economy depends on consideration of many positive
and negative factors.
Internal External
Positive Strengths
• Energy security
• Job creation and rural
development
• Improved trade activities
• Establishment of new industries
• Reduce GHG emissions
Opportunities
• Renewable energy requirement
• Policy encouragement and
technology development
Negative Weakness
• Food security
• Economic viability
• Environmental impact uncertainty
• Equity concerns
Threats
• Rise in fuel and food price
• Natural hazards and Crisis on
financial market
Table 3. Relevant factors identified in each SWOT category
How to get win-win outcomes from biobased economy development? A map and related
policies are urgently needed for the global biofuels industry that supports sustainability.
Preventing environmental degradation and social-economic disruption from activities
associated with bioenergy supply is seen as a basic principle of sustainability (WWF, 2006).
Vermeulen et al. (2008) mentioned that it may be better for the EU to miss its target of
Environmental Impact of Biofuels
154
reaching 10 per cent biofuel content in road fuels by 2020 than to compromise the
environment and human wellbeing. The “decision tree” outlined in Fig. 4, which is
developed by Vermeulen et al. (2008), can guide the interdependent processes of
deliberation and analysis needed for making tough choices in biofuels to balance the
tradeoffs between environment, economy and society.
Energy security? Rural development?
Export development
Climate change
mitigation?
Identify clear set of policy goals
Choosing crops for biofuels
Are biophysical conditions and technology suitable for your
chosen feedstock?
Environmental analysis
Is it possible to assure environmental protection
is part of biofuel production and use?
Look at national food availability
and assess to food for poorer
social groups
Food security analysis
Is it possible to assure food security alongside biofuel production?
Social analysis
Is it possible to assure positive social outcomes
through bioenergy production and use?
Look at issues such as land and water
use, soil and water impacts, and
greenhouse gas emissions
Economic analysis
Are biofuel the most cost-effective means of
achieving the desired policy goals?
Look at issues such as large-scale vs.
small production, land rights and labour
conditions
Proceed with
biofuels
development
Can biofuels out-compete
alternatives for local energy
supplies?
Do international
competitiveness, market
access and trade
preferences allow export?
Production for local and
remote areas
Production for
regional/international
market
Production national
market
Yes
Ye s
Yes
Yes
Yes
Not sure
Not sure
Not sure
Yes
Not sure
Look at cost
relative to, for
example, other
energy sources,
other ways of
promoting rural
development
Strategic policy
support demands
long-term
commitment and
coherence among
sectors
Fig. 4. A decision tree for sustainable strategic national choices on biofuel development
(Vermeulen et al., 2008)
8. Conclusions
There exist significant opportunities and challenges with biobased economy. If done
correctly, such developments can provide important environmental, economic, and social
benefits. The challenge is to have desired outcomes well defined and then develop
structures and policies to make those outcomes a reality.
The biobased economy is a major new opportunity for agriculture, which could enable to
take it from its recurring overproduction for limited food, feed, and fiber markets to a more
sustainable and profitable productions. But the benefits of this biobased economy will
extend beyond agriculture to society as a whole, necessitating broad-based support in terms
of public policy and investment.
Biobased economy, being located in rural areas, may provide many social benefits,
including: (i) Increased employment opportunities in rural areas, resulting in reduced out-
migration of local people; (ii) Health and sustainable rural communities; and (iii) Emergence
of new investment opportunities for local entrepreneurs (e.g. trucking). Many new
challenges would also emerge as a result. Among these are included some of the economic
Biobased Economy – Sustainable Use of Agricultural Resources
155
challenges, such as: (i) biomass crops have only one local market, making the local economy
more sensitive to its price; (ii) Cost of infrastructure improvement and maintenance; (iii)
Increased specialization; (iv) Lack of local control (since heavily capitalized portions of
business are less likely to be locally owned such as biorefineries to process corn into
ethanol); (v) GHG mitigation could cause agricultural activities to be reduced (e.g. through
decreases in livestock population which currently provide important incomes and
employment); (vi) Higher priced food (local, national, and international); (vii) seasonal
employment; (xi) Many low-skill jobs, e.g. machinery operator, truck driver, etc.; (x) Road
congestion, less safe highways due to truck traffic to transport biomass; (xi) Potential
competition for water between population and industry, affecting some social functions in
the communities; and (xii) Destruction of traditions, e.g. displacement of livestock, farmers
into forest plantation managers, pastures into biomass grass.
To develop a sustainable biobased economy, two important needs must be addressed. First,
it is essential to identify and implement mechanisms for the sustainable production of
biomass as current practice of agriculture already facing challenges related to environment
degradation and food security due to unsustainable practices. Policy incentives to adopt
sustainable agriculture methods that help maintain soil cover, increase water use efficiency
and reduce soil erosion are critical (Langeveld et al., 2010) and, research focus on ecosystem
services to provide the necessary information to make appropriate land management
decisions is also required. Second, developing technologies in order to improve the
efficiency of conversion of biomass to biofuels is essential. This not only improves the
energy yield of bio-fuels but also reduces the overall environmental and economic burden
and hopefully could provide sufficient quantities to satisfy the energy needs of the society.
Ultimately, in a short to medium term, the success of biofuels market completely dependent
on the economic factors and not ecological aspects (Festel, 2008). However, Coelho (2005)
argues that the full potential of biofuel industry is hindered currently because the fossil fuels
do not reflect their real costs and risks. The externalities associated with fossil fuels, such as
additional health and environmental costs, are not taken into consideration and the policies
of biofuels are mostly focus on side effects, such as local agricultural and food effects.
9. Acknowledgements
Authors would like to thanks Mrs. Poornima Sheelenere for assistance provided in
searching the literature and providing its critical assessment. Financial assistance provided
by Agriculture and Agri-Food Canada is gratefully acknowledged.
10. References
Adler, P.R., Del Grosso, S.J. & Parton, W.J. (2007). Life-cycle assessment of net greenhouse-
gas flux for bioenergy cropping systems. Ecological Applications, Vol.17, No.3, (April
2007), pp.675-691, ISSN 1051-0761
Albercht J.; Carrez D.; Cunningham P.; Mancia R.; Máthé L.; Raschka M. & Piotrowski S.
(2010). The Knowledge Based Bio-Economy (KBBE) in Europe: Achievements and
Challenges, available from:
Environmental Impact of Biofuels
156
Bai, Y., Luo, L. & Van Der Voet, E. (2010). Life cycle assessment of switchgrass-derived
ethanol as transport fuel. International Journal of Life Cycle Assessment, Vol.15, No.5,
(June 2010), pp.468-477, ISSN 0948-3349
Baker, A. & Zahniser, S. (2007). Ethanol Reshapes the Corn Market. AmberWaves May 2007
Special Issue.
Blanco-Canqui, H., Stephenson, R.J., Nelson, N.O. & Presley, D.R. (2009). Wheat and
sorghum residue removal for expanded uses increases sediment and nutrient loss
in runoff. Journal of Environmental Quality, Vol.38, No.6, (November 2009), pp.2365-
2372, ISSN 0047-2425
Bell, D. R., Silalertruksa, T., Gheewala, S. H. & Kamens, R. (2011). The net cost of biofuels in
Thailand-An economic analysis. Energy Policy, Vol.39, No.2, (February 2011), pp.
834-843, ISSN 0301-4215
Brandão, M., Milà i Canals, L. & Clift, R. (2010). Soil organic carbon changes in the
cultivation of energy crops: Implications for GHG balances and soil quality for use
in LCA. Biomass and Bioenergy, article in press, ISSN 0961-9534, available from:
/>1/2/26051898140dc493640a7c3fe71df0fb
Brentrup, F., Kusters, J., Lammel, J., Barraclough, P. & Kuhlmann, H. (2004). Environmental
impact assessment of agricultural production systems using the life cycle
assessment (LCA) methodology - II. The application to N fertilizer use in winter
wheat production systems. European Journal of Agronomy, Vol.20, No.3, (February
2004), pp.265-279, ISSN 1161-0301
CARC. (2003). An Assessment of the Opportunities and Challenges of a Bio-Based Economy
for Agriculture and Food Research in Canada, Canadian Agri-Food Research
Council (CARC), Ottawa
Cherubini, F. & Jungmeier, G. (2010). LCA of a biorefinery concept producing bioethanol,
bioenergy, and chemicals from switchgrass. International Journal of Life Cycle
Assessment, Vol.15, No.1, (January 2010), pp.53-66, ISSN 0948-3349
Coelho, S.T. (2005). Biofuels - Advantages and Trade Barriers, United Nations Conference on
Trade and Development
Cotula, L., Dyer, N. & Vermeulen, S. (2008) Fuelling exclusion? The biofuels boom and poor
people’s access to land, International Institute for Environment and Development,
London
Cramer, J., Hamelinck, C., Heuvel, E., Bergsma, G., Junginger, M., Smeets, E. & Faaij, A.
(2006). Criteria for sustainable biomass production, available from:
balproblems-globalsolutions-
files.org/unf_website/PDF/criteria_sustainable_biomass_prod.pdf
Crutzen, P.J., Mosier, A.R., Smith, K.A. & Winiwarter, W. (2008). N
2
O release from agro-
biofuel production negates global warming reduction by replacing fossil fuels.
Atmospheric Chemistry and Physics, Vol.8, No.2, (January 2008), pp.389-395, ISSN
1680-7316
Dale, B.E., Bals, B.D., Kim, S. & Eranki, P. (2010). Biofuels done right: Land efficient animal
feeds enable large environmental and energy benefits. Environmental Science and
Technology, Vol.44, No.22, (November 2010), pp.8385-8389, ISSN 0013-936X
Biobased Economy – Sustainable Use of Agricultural Resources
157
Dam, J. & Junginger, J. (2008). Overview of recent developments in sustainable biomass
certification. Biomass and Bioenergy, Vol.32, No.8, (August 2008), pp.749-780, ISSN
0961-9534
de Vries, S.C., van de Ven, G.W.J., van Ittersum, M.K. & Giller, K.E. (2010). Resource use
efficiency and environmental performance of nine major biofuel crops, processed
by first-generation conversion techniques. Biomass and Bioenergy, Vol.34, No.5, (May
2010), pp.588-601, ISSN 0961-9534
Domac, J., Richards, K. & Risovic S. (2005). Socio-economic drivers in implementing
bioenergy projects. Biomass and Bioenergy, Vol.28, No.2, (February 2005), pp. 97-106,
ISSN 0961-9534
Dragisic, C., Ashkenazi, E., Bede, L., Honzák, M., Killeen, T., Paglia, A., Semroc B. & Savy C.
(2010). Tools and methodologies to support more sustainable biofuel feedstock
production. Journal of Industrial Microbiology and Biotechnology, article in press, pp.1-
4, ISSN 1367-5435
Dyer, J.A. & Desjardins, R. L. (2009). A review and evaluation of fossil energy and carbon
dioxide emissions in Canadian agriculture. Journal of Sustainable Agriculture.
33(2):210-228.
Dyer, J.A., Vergé, X.P.C., Desjardins, R.L., Worth, D.E., McConkey, B.G. (2010). The impact
of increased biodiesel production on the greenhouse gas emissions from field crops
in Canada. Energy for Sustainable Development 14(2):73–82.
Dyer, J.A., Hendrickson, O.Q., Desjardins, R. L., & Andrachuk, H.L. (2011). An
Environmental Impact Assessment of Biofuel Feedstock Production on Agro-
Ecosystem Biodiversity in Canada. In: Agricultural Policies: New Developments.
Chapter 3. Editor: Laura M. Contreras, ISBN 978-1-61209-630-8. Nova Science
Publishers Inc. Hauppauge, NY 11788. 29 pp. (In press)
EAC (Environmental Audit Committee). (2008). Are Biofuels Sustainable? the House of
Commons London: The Stationery Office Limited, retrieved from:
/>files/Environment/documents/2008/01/18/EACbiofuelsreport.pdf
Engstrom, R., Wadeskog, A. & Finnveden, G. (2007). Environmental assessment of Swedish
agriculture. Ecological Economics, 60(3), ( January 2007), pp.550-563
European Environment Agency. (2008). Maximising the environmental benefits of Europe's
bioenergy potential. European Environment Agency, Copenhagen, Denmark,
retrieved from:
Fargione, J., Hill, J., Tilman, D., Polasky, S. & Hawthorne, P. (2008). Land clearing and the
biofuel carbon debt. Science, Vol.319, No.5867, (February 2008), pp.1235–1238.
Federal Ministry of Food, Agriculture and Consumer Protection. (2006). Biofuels for
Transportation: Global Potential and Implications for Sustainable Agriculture and Energy
in the 21
st
Century. Prepared by the Worldwatch Institute, Washington D.C., in
cooperation with the Agency for Technical Cooperation (GTZ) and the Agency for
Renewable Resources (FNR).
FAO (Food and Agricultural Organization). (2008). The state of food and agriculture-Biofuels:
prospects, risks and opportunities, retrieved from:
Environmental Impact of Biofuels
158
Festel, G. W. (2008). Biofuels – Economic Aspects. Chemical Engineering & Technology, Vol.31,
No.5, (May 2008), pp. 715-720, ISSN 1521-4125
Finsterbusch, K. (1980). Understanding Social Impacts: Assessing the Effects of Public Projects.
London: Sage Publications.
Gardner, B. (2003). Fuel Ethanol Subsidies and farm price support: Boon or Boondoggle? College
park, MD: University of Maryland, Department of Agricultural and Resource
Economics.
Gartrell, J. M., Krahn, H. & Trytten, T. (1984). Boom Towns: The Social Consequences of
Rapid Growth, in D. Detomasi and J. Gartrell (eds.). Resource Communities: A
Decade of Disruption. Boulder: The Westview Press.
Gomiero, T., Paoletti, M.G. & Pimentel, D. (2010). Biofuels: Efficiency, Ethics, and Limits to
Human Appropriation of Ecosystem Services. Journal of Agricultural and
Environmental Ethics, Vol.23, No.5, (2010), pp.403-434, ISSN 1187-7863
Haig, T. (2006). Ethanol and Biodiesel – Growing a New Economy. Power Point
Presentation made in Alberta Bio-energy Information Meeting. Red Deer Alberta.
Accessed on line at:
/>h_reddeer_03_oct_2006.pdf
Han, F. X., King, R. L., Lindner, J. S., Yu, T Y., Durbha, S. S., Younan, N. H., Monts, D.L., Su,
Y., Luthe, J.C. & Plodinec, M.J. (2011). Nutrient fertilizer requirements for
sustainable biomass supply to meet U.S. bioenergy goal. Biomass and Bioenergy,
Vol.35, No.1, (January 2011), pp. 253-262, ISSN 0961-9534
Hardy, R. W. F. (2002). The Bio-based Economy. In: Trends in new crops and new uses, Janick,
J. & A. Whipkey (Eds.), pp. 11–16, ASHS Press, ISBN 9-970756-5-5, Alexandria, VA.:.
Hochman, G., Sexton, SE. & Zilberman, D. (2008). The economics of biofuel policy and
biotechnology. Journal of Agricultural and Food Industrial Organization, Vol.6, No.8,
(November 2008), pp.1-34.
IEA-Bioenergy. (2009). Bioenergy – A Sustainable and Reliable Energy Source, Main Report: IEA
Bioenergy.
Khanna, M., Hochman, G., Rajagopal, D., Sexton, S. & Ziberman, D. (2009). Sustainability of
food, energy and environment with biofuels. CAB Reviews: Perspectives in
Agriculture, Veterinary Science, Nutrition and Natural Resources, Vol.4, No.028, (April
2009), pp. 1-10, ISSN 1749-8848.
Kim, S. & Dale, B.E. (2005). Life cycle assessment of various cropping systems utilized for
producing biofuels: Bioethanol and biodiesel. Biomass & Bioenergy, Vol.29, No.6,
(December 2005), pp.426-439, ISSN 0961-9534
Klein, K.K. & LeRoy, D.G. (2007). The Biofuels Frenzy: What’s in it for Canadian
Agriculture? Green Paper Prepared for the Alberta Institute of Agrologists.
Presented at the Annual Conference of Alberta Institute of Agrologists. Banff,
Alberta, March 28, 2007. Department of Economics, University of Lethbridge. 46 pp.
Kløverpris, J.H., Baltzer, K. & Nielsen, P.H. (2010). Life cycle inventory modelling of land
use induced by crop consumption: Part 2: Example of wheat consumption in Brazil,
China, Denmark and the USA. International Journal of Life Cycle Assessment, Vol.15,
No.1, (January 2010), pp.90-103, ISSN 0948-3349
Biobased Economy – Sustainable Use of Agricultural Resources
159
Langeveld, J. W. A., Dixon, J. & Jaworski, J. F. (2010). Development Perspectives of the
Biobased Economy: A Review. Crop Science, Vol. 50, No. 2, (March-April, 2010), pp.
S142-S151, ISSN 0011-183X
Mathews, J.A. & Tan, H. (2009). Biofuel and indirect land use emissions in the life cycle of
biofuels: The debate continues. Biofuels, Bioproducts and Biorefining, Vol.3, No.3,
(May/June 2009), pp.305-317
McBridge, A., Dale, V. & Baskaran, L., Downing M., Eaton L., Efroymson R., Garten Jr. L.,
Kline K., Jager H., Mulhooland P., Parish E., Schweizer P. & Storey J. (2011).
Indicators to support Environmental Sustainability of Bioenergy Systems, Jaunary
2011, available from:
OECD (Organization for Economic Cooperation and Development). (2001). The Application of
Biotechnology to Industrial Sustainability - A Primer: Paris.
Phalan, B. (2009). The social and environmental impacts of biofuels in Asia: An overview.
Applied Energy, Vol. 86(Supplement 1), (November 2009), pp. S21-S29. ISSN 0306-
2619
Pimentel, D., Marklein, A., Toth, M., Karpoff, M., Paul, G., McCormack, R., Kyriazis, J. &
Krueger, T. (2009). Food Versus Biofuels: Environmental and Economic Costs.
Human Ecology, Vol.37, No.1, (January 2009) pp.1-12, ISSN 1520-7439
Rajagopal D. & Ziberman D. (2007). Review of environmental, economic and policy aspects of
biofuels, retrieved from:
Scharlemann, J.P.W. & Laurance, W.F. (2008). Environmental science: How green are
biofuels? Science, Vol.319, No.5859, (January 2008), pp.43-44, ISSN 0036-8075
Schmidt, J.H., Christensen, P. & Christensen, T.S. (2009). Assessing the land use implications
of biodiesel use from an LCA perspective. Journal of Land Use Science, Vol.4, No.1-2,
(2009), pp.35-52, ISSN 1747-423X
Searchinger, T. & Heimlich, R. (2009). Likely impacts of biofuel expansion on midwest land
and water resources. International Journal of Biotechnology, Vol.11, No.1-2,
(September 2009), pp.127-149, ISSN 0963-6048
Searchinger, T., Heimlich, R., Houghton, R.A., Dong, F., Elobeid, A., Fabiosa, J., Tokgoz, S.,
Hayes, D. & Yu, T.H. (2008). Use of U.S. Croplands for Biofuels Increases
Greenhouse Gases Through Emissions from Land Use Change. Science, Vol.319,
No.5867, (February 2008), pp.1238-1240.
(S&T)
2
Consultants Inc. & Edna Lam Consulting. (2005). Economic, Financial, Social Analysis
and Public Policies for Biofuels. Phase 2. Prepared For Natural Resources Canada,
Ottawa.
Smeets, E. (2008). Possibilities and limitations for sustainable bioenrgy production systems.
Utrecht University, ISBN 978-90-8672-029-3.
Stoeglehner, G. & Narodoslawsky, M. (2009). How sustainable? Answers and further
questions arising from ecological footprint perspective. Bioresource Technology,
Vol.100, No.16, (August 2009), pp.3825-3830.
Timilsina, G. R., Beghin, J. C., Mensbrugghe, D. v. d., & Mevel, S. (2010). The Impacts of
Biofuel Targets on Land-Use Change and Food Supply - A Global CGE Assessment:
Environment and Energy Team The World Bank.
Environmental Impact of Biofuels
160
UNGA (United Nations General Assembly). (1987). Towards Sustainable Development,
Report of the World Commission on Environment and Development: Our Common Future,
retrieved from:
UNGA (United Nations General Assembly). (2005). 2005 World Summit Outcome, Resolution
adopted by the General Assembly, retrieved from:
_resolution_24oct2005_en.pdf.
Urbanchuk, J. M. (2006). Economic Impacts on the Farm Community of Cooperative
Ownership of Ethanol Production. LECG LLC. Accessed on line at:
Vermeulen, S. & Vorley, B. (2007). Biofuels: Strategic Choices for Commodity Development
Countries. In: Common Fund for Commodities, available from:
/>on_Biofuels.pdf
Vermeulen, S., Dufey, A. & Vorley, B. (2008). Biofuels: making tough choices. In:
International Institute for Environment and Development, 05.03.2011, available from:
Wilhelm, W.W., Hess, J.R., Karlen, D.L., Johnson, J.M.F., Muth, D.J., Baker, J.M., Gollany,
H.T., Novak, J.M., Stott, D.E. & Varvel, G.E. (2010). Balancing limiting factors and
economic drivers for sustainable Midwestern US agricultural residue feedstock
supplies. Industrial Biotechnology, Vol.6, No.5, (October 2010), pp.271-287, ISSN
1550-9087
Williams, P.R.D., Inman, D., Aden, A. & Heath, G.A. (2009). Environmental and
sustainability factors associated with next-generation biofuels in the U.S.: What do
we really know? Environmental Science and Technology, Vol.43, No.13, (July 2009),
pp.4763-4775, ISSN 0013-936X
Wood, S. M. & Layzell, D. B. (2003). A Canadian Biomass Inventory: Feedstocks for a Bio-based
Economy. Kingston: BIOCAP Canada Foundation.
WWF (World Wildlife Federation). (2006). Sustainability Standards for Bioenergy, available from:
/>wwf/pdf_neu/Sustainability_Standards_for_Bioenergy.pdf
Yang, H., Zhou, Y. & Liu, J. (2009). Land and water requirements of biofuel and implications
for food supply and the environment in China. Energy Policy, Vol.37, No.5, (May
2009), pp. 1876-1885, ISSN 0301-4215
Zahniser, S. (2010). EU Environmental Sustainability Requirements and Brazilian Biofuel
Exports. EuroChoices, Vol. 9, No.2, (August 2010), pp.28-34, ISSN 1478-0917
9
Implications of Biofuel Feedstock Crops
for the Livestock Feed Industry in Canada
J. A. Dyer
1
, X. P. C. Vergé
2
, R. L. Desjardins
3
and B. G. McConkey
4
1
Agro-environmental Consultant, Cambridge, Ontario,
2
Consultant to AAFC, Ottawa, Ontario,
3
Agriculture & Agri-Food Canada, Ottawa,
4
Agriculture & Agri-Food Canada, Swift Current
Canada
1. Introduction
The rapid growth of liquid biofuel production could eventually require three or four times
the amount of land currently used to supply the feedstock for biofuels (FAO, 2008). The 2007
US Energy Independence and Security Act set the target for 2022 for national ethanol
production at nearly four times the present production. It is predicted that this goal would
result in the largest and most rapid changes in land use in history (Sinclair and Sinclair,
2010), especially when combined with the similar changes that can be expected in Canada
(Klein and LeRoy, 2007).
In spite of the major impact on agriculture that can be expected from such change in land
use, biofuels will satisfy a relatively small share of the fuels needed for transportation (FAO,
2008; Karman et al., 2008). Consequently, small increases in the addition of ethanol to
gasoline (from 5% to 10%) have meant very large changes in crop distributions (Dufey, 2007;
Fritshe et al, 2009). The adoption of 5% biodiesel in Canada could have a similar impact on
land use (Dyer et al., 2010a). The increased demand for biofuel may, in turn, lead to higher
retail prices for meat and dairy products because of higher livestock feed costs (Zhang and
Wetzstein, 2008). Agricultural policy must take the growth of biofuels into account as part of
planning for future food security.
Since anthropogenic global warming/climate change will likely be the greatest challenge to
mankind in the 21
st
century (thanks to our addiction to oil), renewable energy supply and
Greenhouse Gas (GHG) emissions are the prime justification for biofuel production (Karman
et al., 2008). If properly developed, biofuels can potentially help to reduce fossil CO
2
emissions
from transport (IEA, 2004; Klein and LeRoy, 2007; Murphy, 2008). Because of the sensitivity of
the agricultural resource base to the expansion of biofuel feedstock production, the real
potential reduction in GHG emissions from biofuel should take into account any related
changes in land use. Such changes should include both the use of the actual land on which the
biofuel feedstock was grown and any secondary, or indirect, shifts in land use (Dyer et al.,
2011). In addition, land use effects may end up being as important in altering weather as
changes in climate patterns associated with GHG buildup (Pielke, 2005).
While it is not clear whether the impacts on food production from increased biofuel
feedstock production will always be negative, some shrinkage of resources available to
Environmental Impact of Biofuels
162
produce livestock feed is expected (Auld, 2008; Klein and LeRoy, 2007). The objective of this
chapter was to assess the impact from a shift in land use on the GHG emissions from the
Canadian livestock industries. To achieve this goal, the actual area changes will first be
identified. While the purely ecological concerns are beyond the scope of this chapter, we
recognize that the reallocation of land from livestock feed to feedstock production may re-
align several of Canada’s agro-ecosystems. The integrity of these agro-ecosystems,
particularly those that involve livestock production, will involve a range of environmental
considerations, including biodiversity, soil structure or the water cycle (Vergé et al., 2011).
2. Background
In order to decrease dependence on foreign oil in the USA, the Bush administration
introduced incentives in 2005 to stimulate the ethanol industry (Whyte, 2008). The result has
been rapid growth in the grain ethanol and biodiesel industries over the last five years in
both Canada and the USA. Historical trends prior to this period, therefore, provide the only
realistic baseline for this assessment. Although Canada does not have the same energy
security concerns as the USA, the Canadian biofuel industries are still growing (Klein et al.,
2004). The growth of the US biofuel industries, particularly grain ethanol, will have
inescapable economic consequences for Canadian livestock producers, regardless of how
these industries develop in Canada.
An important spinoff from replacing livestock feed crops with biofuel feedstock crops is the
expanded market opportunities for crop producers (IEA, 2004). Whereas most field crop
producers should gain economically from the increase in grain prices, livestock farmers are
expected to suffer from the rising costs of feed (FAO, 2008; Khanna et al., 2009). From 2006
to 2008, livestock feed prices nearly doubled, in part because of increasing use of corn for
ethanol (GAO, 2009). Almost one-third of the US corn crop in 2008 was used for ethanol
production. The amount of land available for grazing cattle has also been declining. In 2007
corn used for ethanol production in Canada increased by about 34% while corn grown for
feed increased only slightly (Sawyer, 2007).
2.1 Biofuel industry profiles
An environmental impact assessment of biofuel feedstock production on Canadian agro-
ecosystem biodiversity used case study scenarios from canola biodiesel, cellulosic ethanol,
and corn ethanol (Dyer et al., 2011). Several other possible scenarios were identified in that
assessment, including wheat-based ethanol in western Canada and soybean-based biodiesel
in eastern Canada. Dyer et al. (2011) predicted only minor impacts from the latter two
biofuel industries. Wheat used as a feedstock in western Canada is a small share of the
wheat that goes into the food market and should result in very little shrinkage in the land
available to support livestock in that region. Since this diversion to biofuel feedstock
provides a market for low quality wheat (EIC, 2010), there should be minimal
environmental impacts from the production of wheat for ethanol feedstock.
Some use of soybeans for biodiesel feedstock is already in operation in eastern Canada
(McKague, 2009). But high corn prices have still tempted many Ontario farmers to stray
from their usual corn/soybean crop rotation in order to raise more corn (Sawyer, 2007). A
stronger market for biodiesel made from soy oil would stimulate soybean production in the
corn growing regions of Canada and displace some of the expanding popularity of corn in
central Canada, and thus slow the trend towards a corn monoculture. Therefore, the net
Implications of Biofuel Feedstock Crops for the Livestock Feed Industry in Canada
163
impact from soy-biodiesel on the environment should be positive. Since soybean meal, the
biggest fraction of this crop (Halliday, 2003; Yacentiuk, 2001), is still available as feed, the
impact from soy-biodiesel on livestock feed supply would be minimal.
When cellulosic ethanol facilities become commercially viable, they could replace older
grain ethanol facilities, creating more demand for biomass (Simpson, 2009). This certainly
would be the case in the US with their national ethanol production target for 2022 of 86.4
billion liters of ethanol per year from non-grain feedstock (Sinclair and Sinclair, 2010).
However, the quantitative changes resulting from biomass feedstock for cellulosic ethanol
are highly speculative at this stage because this industry is still in its infancy. Since biomass
can be produced on almost any class of land, the only land use shift would likely involve
moving cattle from higher to lower quality grazing land (Sawyer, 2008). The changing use of
rangelands have not attracted as much interest with respect to GHG emissions as have
impacts from cattle displaced into forested areas (Baker, 2010). However, if rangeland was
used to either support biomass production or to graze too many displaced cattle,
biodiversity loss from those previously-undisturbed rangeland habitats would be a greater
concern than increased GHG emissions (Dyer et al., 2011).
2.2 Livestock GHG emissions in Canada
Agriculture and Agri-Food Canada (AAFC) researchers undertook to make an inventory of
GHG emissions from livestock farms in Canada (Dyer et al., 2010b). This inventory
procedure recognized that farm animal populations are limited by the area available to
grow the feed grains and forage they consume. Consequently, animal-based production
cannot be effectively assessed without first determining the GHG emissions from growing
those crops. The land base on which those crops are grown was defined as the Livestock
Crop Complex (LCC). The cost of feedstock crop production must include N
2
O emissions,
farm inputs and farm fossil energy use (Reijnders, 2008). Therefore, manure and enteric
methane emissions, nitrous oxide from nitrogen fertilizer and manure, and fossil carbon
dioxide emissions associated with feed grain and forage production in the LCC were part of
the AAFC methodology for the livestock GHG emissions assessment (Vergé et al., 2007).
Commodity-specific crop complexes were defined for the Canadian beef, dairy, pork and
poultry industries (Vergé et al., 2007; 2008; 2009a,b). For each livestock industry, the crop
type composition and amount of each crop in the respective diet defined the total crop area
in each respective crop complex. This methodology also exploited the differences in diet
among age-gender categories of each type of livestock (Elward et al., 2003). Historical GHG
emission trends were generated from the statistical assessments for the four livestock
industries (Dyer et al., 2008; Vergé et al., 2008; 2009a,b) over the 1981 to 2006 census years (5-
year intervals). The whole set of required computations were assembled together in one
unified spreadsheet model that can be driven by agricultural census records of livestock
populations. This unified model has been used to estimate protein-based GHG emission
intensities (Dyer et al., 2010c).
3. Methodology
Simplistic approaches are unlikely to deliver a sustainable biofuel industry or contribute to
the climate change challenge (Otto, 2009). Estimating GHG emissions from livestock
requires a detailed and deterministic set of estimates for those emissions prior to, or in the
absence of, the growth of the biofuel industries. The same methodology must be applicable
Environmental Impact of Biofuels
164
to altered livestock industries under a range of scenarios for those expected biofuel crops.
The unified spreadsheet model for livestock GHG emissions in Canada (mentioned above)
provided the GHG estimates used in this chapter. The 2001 livestock GHG emission
estimates from this model were used as the baseline GHG emissions for the pre-Bush
Administration incentives in this chapter.
The environmental impacts from livestock feed production are specific to agro-ecosystems
(Vergé et al., 2011). Therefore, the effects of expanding biofuel feedstock production into
areas that had previously been used to grow livestock feed will also vary by region. The
only areas of the two feedstock crops (corn and canola) that will be considered are those
areas that will encroach on the land dedicated to producing feed grains for livestock. Six
hypothetical scenarios involving canola biodiesel and corn ethanol used in this chapter to
demonstrate the biofuel feedstock and livestock feed interactions in Canada are summarized
in Table 1. The expected or required volumes of ethanol or biodiesel were used to estimate
the required weights of grain corn or canola to be diverted to feedstock and away from
livestock. Any corresponding shrinkage in the respective livestock GHG emissions were
then added to the fossil fuel savings from each respective biofuel type.
051015
Manitoba
Ontario
Quebec
PORK:
Manitoba
Ontario
Quebec
DAIRY:
Alberta
Saskatchewan
Manitoba
BEEF:
Total GHG emissions, Tg CO
2
e
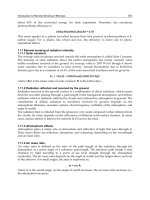
Fig. 1. Total GHG emissions from beef farms in the three Prairie Provinces and from dairy
and hog (pork) farms in the three central provinces of Canada in 2001
The 2001 GHG emissions from dairy, beef and hog farms as estimated by Vergé et al. (2007;
2008; 2009) were used as the baseline for the livestock-related GHG emissions in this
analysis. Those GHG emission calculations were re-run for this analysis with the virtual age-
gender category and total population changes required to test each of the three livestock
types. Since the goal of this chapter was to compare the total CO
2
e emissions of GHG with
Implications of Biofuel Feedstock Crops for the Livestock Feed Industry in Canada
165
the avoided fossil CO
2
from biofuels, only the total GHG emissions are shown in Figure 1,
rather than specific types of GHGs. In this application, avoided emissions refer to the net
amount of fossil fuel that would not be burned as a result of the increase in biofuel energy
assumed in this analysis.
3.1 Biofuel feedstock area and avoided fossil fuel
The starting point for the conversion of biofuel to both the feedstock area and avoided CO
2
emissions from fossil fuel was an assumed target energy quantity of 8 PJ. For equivalent
fossil CO
2
emissions, energy was converted to the equivalent volumes of diesel at 36
MJ/litre and gasoline at 32 MJ/litre (Karman et al., 2008). With CO
2
emissions per volume
of liquid fossil fuel of 2.73 and 2.36 kg/litre for diesel and gasoline, respectively (Neitzert et
al., 1999), the weights of CO
2
emissions from the initial quantities of bioenergy from these
two fuels could then be calculated.
With CO
2
emissions per unit of energy given by Jaques (1992) as 70.69 t/TJ for diesel and
67.98 t/TJ for gasoline, the weights of CO
2
from these fossil fuels could also be calculated (as
a cross-check) directly from the assumed energy. The weights of CO
2
emissions to produce
and consume a litre of fuel (Peña, 2008), expressed as an index of gasoline, provided a basis
by which to derive the net avoided fossil CO
2
as a result of using biofuels. This index gave
the fossil CO
2
emission cost of corn ethanol produced with natural gas as 68% of gasoline,
whereas biodiesel is given as 52% of gasoline and 47% of petro-diesel. Hence the
substitution value of corn ethanol for gasoline was 32% of the imbedded CO
2
emissions and
the substitution value of biodiesel for petro-diesel was 53%.
The assumed target energy quantities were converted to the equivalent volumes of canola
oil at 34 MJ/litre and ethanol at 21 MJ/litre (Karman et al., 2008). The volumetric energy of
ethanol reflects the relatively low energy content per unit volume compared to gasoline
(Karman et al., 2008). An average estimate of 377.5 litres of ethanol per t of grain corn was
derived from three literature sources (AAFC, 2009; Bonnardeaux, 2007; Hardin, 1996). The
tons of feedstock crop (F) of grain corn (gc) was computed as:
F
gc
= V
ethanol
/ 377.5 (1)
Since canola loses 39% of its weight during oil extraction (Vergé et al., 2007), and the density
for canola oil is 0.915 kg/litre (Elert, 2000), the weight in tons of feedstock crop (F) of canola
seed (cs) was computed from the volume in litres of canola oil as:
F
cs
= 0.915 × V
canola oil
/ 0.39 (2)
The two biofuel byproducts, dry distillers grain (DDG) and canola meal, were added back
into the respective livestock diets to offset some of the expected shrinkage from these LCC
area losses. Both of these byproducts were treated as high energy grain substitutes, rather
than as extra roughage for ruminants. The DDG byproduct from the ethanol processing was
31.9% of the grain corn feedstock weight (Bonnardeaux, 2007). The canola meal byproduct
from the biodiesel processing was 61% of the canola feedstock weight (Vergé et al., 2007).
While they are both high in protein (McKague, 2009; EIC, 2010), the dietary benefits of this
protein were ignored in this analysis. These feedstock weights were factored by provincial
crop yields to estimate the crop areas needed to produce these fuel volumes. The scenario
tests involved the subtraction of these estimated net feedstock crop areas from the respective
LCC areas.
Environmental Impact of Biofuels
166
3.2 Livestock scenarios for biofuel expansion
For cattle, producers may respond to less available feed grain by feeding more forage, a
system that has proven to be economically viable in some countries (Casey and Holden,
2005, 2006). This strategy was the basis of Scenarios B1 to B4 for beef (described below). In
Ontario and Quebec, however, virtually all arable land is in cultivation and so no land
would be available to expand forage production to compensate for reduced grain corn
supply (Whyte, 2008). The two Central Canada scenarios are as follows.
• Scenario D: given the lack of land for expanding forage production, no attempt was
made to redefine the balance between grain and roughages (forage) in dairy cow diets
to accommodate the changing crop distribution in the LCC. When the supply of feed
grain in the dairy cattle diet was reallocated to feedstock, reduction of the entire
population was assumed, rather than adjusting the herd for possible increased
roughage consumption.
• Scenario P: no forage crops are involved in the non-ruminant hog diet. The Canadian
hog population includes either breeding stock or animals destined for slaughter, with
almost no differences in diet between the two categories. Therefore, reductions in the
total populations were assumed for the pork industry, in response to reallocation of
land in annual crops to feedstock production.
Required action Animal type Feedstock Biofuel Region
B Beef Canola Biodiesel
Prairie Provinces
1
B1
B2
B3
B4
D Dairy Grain corn Ethanol
Central Canada
2
PPorkGrain cornEthanol
Central Canada
2
Reduce the whole dairy population across all age-gender categories.
Reduce the whole hog population across all age-gender categories.
Scenario
Transfer calves and yearling slaughter animals in feedlots from a grain diet to the
predominantly forage-based diet of replacement heifers.
Feed all slaughter and replacement animals the same forage-based diet as the grazing,
breeding cattle.
Send the calves and yearling slaughter animals in feedlots for slaughter.
Reduce the whole beef population across all age-gender categories.
1
Manitoba, Saskatchewan and Alberta
2
Quebec, Ontario and Manitoba
Table 1. Scenarios used to test the effect of reallocating farmland from feed grains used in
the Canadian livestock industry to feedstock crop production for biofuel
3.3 Scenarios for western Canadian beef
Because the Canadian beef industry is a mix of grain-based and grazing-based production
systems, several farm level responses are possible from the expansion of canola feedstock
areas into the beef crop complex (BCC). The Canadian beef industry is also unique in that
these different production systems are typically managed independently (ranches and
feedlots under different ownership), with different decision processes (Vergé et al., 2008).
The four possible scenarios specific to beef (B) production (Table 1) were ranked in order of
Implications of Biofuel Feedstock Crops for the Livestock Feed Industry in Canada
167
the number of beef animal categories they affected. Because of the complexity of the western
Canadian beef industry, the age-gender category populations (as defined by Vergé et al.
(2008)) and the mean live weights are summarized in Table 2. The grain-based differences in
diet among the age-gender beef categories are illustrated in Figure 2.
0
5
10
15
20
25
30
35
40
45
50
Cows R-heifers
<1 year
R-heifers
>1 year
Bull
calves
Steers S-heifers
Grain area as % of BCC
Note: R-heifers = replacement heifers; S-heifers = slaughter heifers
Manitoba
Saskatchewan
Alberta
Fig. 2. The areas in feed grains as % of the Beef Crop Complex (BCC) for six age-gender
categories in each prairie province of Canada in 2001
Two beef scenarios are similar to the dairy (D) and pork (P) scenarios. In scenarios B1 and
B4 changes were limited to the outright removal of animals from the system, rather than
reallocation of animals from one livestock category to another within the same industry. The
other two scenarios (B2 and B3) were based on shifting the diet of one or more age-gender
livestock categories to the diet of other categories that consume less grain. From a feed
supply perspective, a number of yearling steers would be re-designated as range-fed
breeding cows, for example, taking into account the difference in their respective live
weights. These two scenarios required more grain area to be reallocated than the area
needed to produce the desired biodiesel energy. This was because some additional area of
grain is needed to meet the grain dietary components of the expanded population of the
new category.
• Scenario B1: the impact would be limited to the reduction of the slaughter cattle
(slaughter calves, steers and non-replacement heifers), mostly in feedlots. The
assumption behind this scenario was that, with less grain or high energy feed, there
would be no value in keeping these animals alive during the period they would
normally be in the feedlot. Hence, they were slaughtered straight away and thus
eliminated from the industry (and its carbon footprint).
• Scenario B2: instead of immediate slaughter of these animals (from Scenario 1), they
would be kept on a diet equivalent to that of the replacement heifers, which is based on
more forage and less grain than that of slaughter animals. Hence the impact would be
broadened to include the population expansion of the replacement category by the
slaughter animals. In this assumption, these animals become mainly grass-fed, rather
than mainly grain-fed, beef. With respect to diet-based GHG emission calculations
Environmental Impact of Biofuels
168
(Vergé et al., 2008) they became virtual replacement heifers, with allowance for the live
weight differences (Table 2).
• Scenario B3: both slaughter and replacement beef cattle are transferred to a
predominantly forage-based diet. The components of this grazing-based diet would be
defined by the prairie beef ranch where the breeding cows are maintained. Hence the
cattle being transferred (slaughter calves, steers, replacement and non-replacement
heifers, and bull calves) are treated as virtual grazing, breeding beef cows, with
corrections for live weight differences (Table 2).
• Scenario B4: the impact of less high energy feed being available to the feedlot industry
would be felt throughout the whole beef production system. The assumption behind
this scenario was that beef producers have become sufficiently dependent on marketing
their product through a high feed energy finishing process (the feedlot) that, without
sufficient feedlot capacity, the unfinished beef would not be economically viable, and so
the impact would be felt throughout the entire industry.
Bull Calves
Bulls Cows > 1 year < 1 year calves Steers Heifers < 3 months
Provinces
Manitoba 25 545 114 132 85 120 89 116
Saskatchewan 60 1,200 254 284 174 216 68 234
Alberta 104 2,028 1,083 621 372 438 760 497
Manitoba 765 671 490 319 319 356 451 153
Saskatchewan 712 601 467 317 317 371 443 150
Alberta 666 609 539 315 315 386 505 142
Breeding stock Replacemant heifers For slaughter
Head of beef cattle x 10
3
Live weight, kg/head
Table 2. Populations and live weights of beef cattle by age-gender categories in the three
Prarie provinces of Canada in 2001
In Scenarios B2 and B3 it was assumed that the expansion of the grass-fed slaughter animals
would be based on land capable of growing perennial forage but not annual grains or
oilseeds. While this is typically marginal land, it is not necessarily publically-owned
rangeland. In Canada, the only significant quantities of such land would be in the western
provinces. This assumption brings new land into production (albeit under permanent cover)
and potentially raises the net GHG emissions from beef production. It also raises the
possibility of non-GHG related impacts on the land being brought into production (IRGC,
2008; Vergé et al., 2011). Because this land would probably be managed as improved pasture
or hay, the chemical inputs and introduced forage crops could threaten biodiversity (Dyer et
al., 2011).
3.4 Area reallocation calculations
Adjustment of the category populations called for in the respective scenarios was achieved
through the ratio of the net feedstock area (A
nc
) to the baseline areas of annual crops. The net
converted (nc) area for feedstock (fs) was adjusted for the land freed from feed production
by the biofuel byproduct (bf) (IEA, 2004) as follows:
Implications of Biofuel Feedstock Crops for the Livestock Feed Industry in Canada
169
A
nc
= A
fs
- A
bf
(3)
where
A
fs
= area to grow the biofuel feedstock crop
A
bf
= area required to grow the feed equivalent to the weight of feed byproduct
The ratio of the net converted feedstock area to the BCC feed grain areas (AR) of the beef
categories being displaced was calculated as a fraction of the BCC:
AR = A
nc
/ ∑
c
A
beef,c
(4)
Thus the reduced (r) beef population (P
r,c
) for each age-gender category (c) was computed as:
P
r,c
= P
bl,c
× AR (5)
where
P
bl,c
= the baseline (bl) population (P) in each beef animal category (c).
Based on the changed beef populations, the areas in forage (mainly perennial grass, alfalfa
and hay) were recalculated by re-running the unified livestock GHG emissions model with
these re-aligned beef cattle populations.
4. Results and discussion
4.1 Overview of Canadian agricultural land use
Table 3 shows three levels of area data on an east-west basis. The crop areas needed to feed
Canadian livestock (beef and dairy cattle, swine and poultry) are shown as the first level in
Table 3. To put these LCC areas into context, they are compared to the national crop areas as
reported in the 2001 agricultural census. Any areas in each crop type that do not supply
livestock feed were excluded from the LCC (Dyer et al., 2010b). In the second level, only the
types of crops used in animal diets (as identified in the LCC) are included, but the entire
areas planted for those crops in Canada are given, regardless of whether they are used to
feed livestock. In the third level, all types of field crops were taken into account, and the
entire area planted to each of those crops is included. The crop types were grouped as either
grains (including oilseeds) or forages.
On a national basis, forages represented more than 60% of the LCC. The largest portion of
the LCC was in the western provinces (70% of the total). In eastern Canada, areas were
evenly distributed between grains and forages. This was very different in the west, where
the area for forages (9.3 Mha) was twice as high as the area for grain (4.4 Mha). Table 3
illustrated that most of the cultivated crop types correspond to those used for animal feed.
The difference between Level 2 and Level 3 was only 3.25 Mha. Since forages were grown
exclusively for animal feed, all of this difference was accounted for by the grain crops. In the
west, grains and oilseeds represented about 70% of all crop lands, whereas there was almost
no difference between grains and forages in the east.
Table 3 also illustrates that the LCC represented almost half the total Canadian crop land.
The grain portion of the LCC represented about one fourth of the total grain and oilseed
areas. The small difference in forage areas between Levels 2 and 3 was due to sheep and
horses not being included in the LCC (Dyer et al., 2010b). About 80% of grain areas in the
east were used for animal feed (2.84 Mha compared to 3.53 Mha). In the west, feed grains
only accounted for 17% (4.38 Mha compared to 25.04 Mha) of the western grain areas.
Environmental Impact of Biofuels
170
Forages Total
Regions
East
2
2.8 2.6 5.5
West
3
4.4 9.3 13.7
Canada 7.2 11.9 19.2
East 3.3 2.8 6.0
West 22.0 9.6 31.6
Canada 25.3 12.4 37.7
East 3.5 2.8 6.3
West 25.0 9.6 34.6
Canada 28.6 12.4 40.9
1
Mha
All areas for all Canadian crops
Grains & oilseed s
All areas for only those crop s in the LC C
Crop areas included in the LCC
1
1
Livestoc Crop Complex for beef, dairy, hogs and poultry
2
Atlantic Provinces, Quebec and Ontario
3
Manitoba, Saskatchewan, Alberta and British Columbia
Table 3. Overview of the use of arable land in Canada, as recorded in the 2001 agricultural
census in relation livestock
4.2 Reallocations of livestock areas to biofuel feedstock
Table 2 shows the complexity of the Canadian beef industry, particularly when the
differences in the way replacement stock and animals destined for slaughter are taken into
account. This complexity was a critical factor in the response by beef farmers to changes in
feed grain areas and the need for four test scenarios for this industry. The largest share of
the provincial beef populations was in the breeding categories (replacement heifers and
cows). These animals were also the heaviest. The Alberta beef cattle population is almost
twice as high as the Saskatchewan population which is more than twice as high as the
Manitoba population. There were appreciable differences among the age-gender categories
with respect to both population and live weights.
Only the six categories that were involved in the four beef cattle scenarios are shown in
Figure 2. All grains, pulses and oilseeds in the beef diet were grouped together as feed
grains. The dependence on grain consumption shown in Figure 2 varies noticeably among
the age-gender categories. The percent of the total area supporting the cattle (the BCC) on
which feed grain was grown in 2001 demonstrates that, among the cows and replacement
heifers, only a small share of their diet was in grains. In comparison, the diet for the cattle
destined for slaughter required that almost half of the areas that feed slaughter animals be in
grain production. Grain consumption by the breeding cows was much less than by the
replacement stock. The differences in diet among the age-gender categories were quite
consistent across the three provinces.
Table 4 shows that the baseline area (in the LCC prior to any area reallocation for ethanol
feedstock) for hog and dairy farms was much higher than the areas being reallocated to corn
ethanol feedstock production. The small area for corn for feedstock use in Manitoba reflects
the relatively low acreages of this crop in Manitoba in 2001. The changes in area shown for
forage are due to a reduction in areas of forage required for dairy cattle as a result of