Biomass and Remote Sensing of Biomass Part 14 potx
Bạn đang xem bản rút gọn của tài liệu. Xem và tải ngay bản đầy đủ của tài liệu tại đây (3.24 MB, 12 trang )
In Situ Primary Production Measurements as an Analytical Support
to Remote Sensing - An Experimental Approach to Standardize the
14
C Incorporation Technique
251
sample volumes also the final acid concentrations were very diverse among the studies.
Although the
14
C technique has now been used in more than 35 000 oceanographic
experiments (del Giorgio & Williams, 2005), from the review of the earlier and recent
literature, we evidenced that different methods are still used to stop the photosynthetic
activity, and that highly variable concentrations of HCl are added to remove the excess
labelled bicarbonate which was not assimilated by the microalgae. In order to standardize
this step of the
14
C method, we designed a series of experiments, using both water samples
and a mix culture of microalgal taxa which represent a coastal phytoplankton community.
The first aim of our study was to define which HCl concentration, with an equal volume,
among 0.1N, 0.2N, 0.5N, 1N, 2N and 5N was sufficient both to remove the excess labelled
bicarbonate and to kill the cells but without damaging their structures with a consequent
loss of assimilated
14
C. Secondly, using both chlorophyll a red autofluorescence and motility
of flagellates and diatoms as proxies of microalgal viability, we tested if different acid
concentrations were sufficient to stop the microalgal photosynthetic activity.
2. Materials and methods
2.1 Water sampling
On 18
th
October 2006, 29
th
January 2007 and 4
th
September 2008 five litres of seawater was
collected at 5 m depth by a Niskin bottle about 10 km far from the coast in the Gulf of Trieste
(northern Adriatic Sea, Italy). In each cruise seawater temperature and chlorophyll a (chl a)
were recorded by a Multiparameter Probe Ocean Seven 316 Idronaut. In laboratory the
sampled water was immediately transferred to translucent polycarbonate carboy (Nalgene)
and kept at in situ temperature (20°C in October, 10°C in January, 20°C in September) and
light conditions ranging from 100 to 200 µmol photons s
-1
m
-2
, according to the sampling
day. Flushing by an air pump kept the water at oxygen saturation. Water was exposed to a
14:10 h light:dark cycle.
2.2 Experimental design
The next morning (10.00-11.00 a.m.) 1.320 l of sampled seawater was transferred to an
Erlenmeyer flask and kept in the darkness for 30 minutes to reduce the photosynthetic
activity. Subsequently, 99 µCi (3.66 MBq) of NaH
14
CO
3
(DHI, Denmark) was added into the
flask. The sample was gently stirred and then 6 subsamples of 220 ml were transferred to six
Erlenmeyer flasks. Three of these were incubated at in situ conditions, while the other three
were wrapped up in aluminium foils to maintain them in darkness and incubated together
with the light ones at in situ temperature for 2 hours. Inoculum and subsampling were
performed at very low light to avoid the beginning of the photosynthetic activity before
incubation. After incubation each 220 ml replicate was stored in dark and cold conditions
(ice was used to keep temperature close to 0°C) until filtration. From each of 220 ml
replicates, 6 aliquots of 25 ml were filtered using a Millipore vacuum filtration manifold
(with 12 wells) through polycarbonate 0.2 µm filters applying a low vacuum pressure in
order to avoid cell damage. The 6 filters were put into 6 ml plastic scintillation vials (Perkin
Elmer); 5 ml of the 6 filtrated samples was collected and put into 20 ml glass scintillation
vials (Perkin Elmer) to assess the rate of phytoplankton exudate release. Finally, six 5 ml
aliquots of the total sample, drawn from the 220 ml replicate, were directly put into 20 ml
glass scintillation vials. To each final sample series (6 filters + 6 filtrated samples + 6 total
samples) obtained from the 220 ml replicate, 200 µl of HCl at progressively higher
Biomass and Remote Sensing of Biomass
252
concentrations (0.1N-0.2N-0.5N-1N-2N-5N which correspond to final HCl concentrations of
0.004N-0.008N-0.02N-0.04N-0.08N-0.2N, respectively, for filtrated and total samples) was
added and left under hood overnight to remove the labelled bicarbonate which was not
assimilated by the microalgae. 5 ml of Filter Count scintillation cocktail (Perkin Elmer) was
added to filters, while 10 ml of Ultima Gold XR (Perkin Elmer) was added both to filtrated
and not filtrated samples. Disintegrations per minute (DPM) were measured twice by a
QuantaSmart TRI-CARB 2900 TR Liquid Scintillation Analyzer (Packard BioScience, USA)
including quenching correction, obtained using internal standards.
2.3 Statistical analysis
Student's t-test was applied to test for significant differences between pairs of experiments
considering different acid normalities for filters, filtrated and total samples. Only data
obtained from the first reading was used for the t-test.
2.4 Effects of HCl on the planktonic microalgal community
In order to test if the added acid concentrations were sufficient to stop the microalgal
photosynthetic activity, another experiment was carried out. A mix of six microalgae,
representing the local phytoplankton community, was prepared, simulating the proportion
among the groups which is characteristic of a resuspended coastal water mass. We chose:
Chaetoceros socialis as a typical planktonic diatom, Cylindrotheca fusiformis as a tychopelagic
diatom, Paralia sulcata as a common benthic diatom, Gymnodinium sp. representing naked
dinoflagellates, Lingulodinium polyedrum representing thecate dinoflagellates and an
undetermined Cryptophycea as a typical small phytoflagellate (Table 2). We stored the mix
culture for 24 h at 15°C and 12:12 light:dark photoperiod (50 µmol photons s
-1
m
-2
). The next
day 7 aliquots of 5 ml were transferred into 20 ml scintillation glass vials. The following
protocol was performed: one replicate was used as a control, while to the other six 200 µl of
HCl at increasing concentrations (the same of the previous experiments) was added. Then, we
performed a litmus test (Merck), estimating the pH in each sample. We left the samples under
hood overnight to simulate the primary production protocol as described above. The next day
a few drops of each sample were observed under an inverted microscope (Leica DMI 3000B)
using both phase contrast and epifluorescence, under a blue filter set (BP450-490 nm) at
different magnifications (from 200 to 400X). As proxies of viability we considered both
chlorophyll a red autofluorescence and motility of flagellates and of the tychopelagic diatom.
The motility of planktonic (Chaetoceros socialis) and benthic (Paralia sulcata) diatoms was not
taken into account because these two taxa do not have specific structures allowing movement.
Taxon Representing group Presence
Chaetoceros socialis
Planktonic diatom abundant
Cylindrotheca fusiformis
Tychopelagic diatom abundant
Paralia sulcata
Benthic diatom rare
G
y
mnodinium
sp.
Naked dinoflagellate rare
Lingoludinium polyedrum
Thecate dinoflagellate rare
undet. Cryptophycea Small phytoflagellate the most abundant
Table 2. Composition of the mix culture artificially created in the laboratory to simulate a
natural phytoplankton community of coastal waters.
In Situ Primary Production Measurements as an Analytical Support
to Remote Sensing - An Experimental Approach to Standardize the
14
C Incorporation Technique
253
2.5 Recovery experiment
During microscopic observations we observed several shades of red autofluorescence. Since
we could not be sure that a pale orange colour was a sign of a not viable cell, we carried out
another test. We believed that some cells could be still viable after a mild acid treatment and
thus able to photosynthesize, especially during the period elapsing between the addition of
the acid and the addition of the scintillation liquid. We tried to demonstrate that after a mild
acid treatment some microalgae were still photosynthetically active. Consequently, we
restored their maintenance conditions looking at the microalgal growth after two weeks.
Therefore, the residual aliquots (>4 ml) of a few selected treatments (without acid, 0.1N,
0.2N and 5N) from the first experiment (mix culture) were transferred into 100 ml
Erlenmeyer flasks which were filled with F/2 medium to a final volume of 50 ml. The four
flasks were kept at 15°C and 12:12 light:dark photoperiod until microscopic observations.
3. Results and discussion
3.1 In situ primary production as an analytical support to remote sensing
Frequently the problem with the model efficiency is data limited by the amount of
representative in situ measurements. As more in situ data become available they can be
exploited within most of the existing complex formulations. When asked what is needed to
improve model performance, all model developers coincide in requesting more data (Carr et
al., 2006). When comparing primary production measurements with those from different
studies, it is difficult to decipher whether differences are due to inter-annual changes, the
spatial location of the stations sampled in each region, the frequency over which the
measurements were taken or the measurement protocol used (Tilstone et al., 2009). Often in
situ primary production data are associated with a level of uncertainty and need to be
regarded as ranges rather than as exact values (Friedrichs et al., 2009). Another problem
with in situ measurements is that ship resources cannot solve low-frequency spatial and
temporal variability, much less make direct observations of mesoscale variability beyond
isolated snapshots. The chronic undersampling of ship-based estimates of global primary
production requires significant extrapolations, making it essentially impossible to quantify
basin-scale variability from in situ measurements (Carr et al., 2006). Fortunately, satellite
provide a solution. Sensors that measure ocean colour are presently used to estimate
chlorophyll concentration in the upper ocean (Carr et al., 2006). The simplest models
estimate time and depth-integrated production as a function of surface chlorophyll.
However, surface chlorophyll explains only 30-40% of the variance in primary production at
the scale of a single station (Hyde et al., 2008). To go from biomass, a pool, to
photosynthesis, a rate, a time dependent variable is needed (Carr et al., 2006). Recently, a
series of round-robin experiments were carried out to evaluate and compare models which
estimate primary productivity from ocean colour (Campbell et al., 2002, as cited in Tilstone
et al., 2009). In these experiments, in situ measurements of carbon uptake were used to
predict depth-integrated primary production based on information accessible via remote
sensing. According to the authors, there is no way to quantify model performance without
comparing the output to in situ data (Carr et al., 2006). For any model, a vital element of
model skill is the ability to reproduce in situ observations; in the case of primary production
models, measurements of primary production. If observations are representative and the
data have undergone careful quality control, firm conclusions can be reached regarding the
environmental conditions that challenge model skill. These challenging conditions, in turn,
Biomass and Remote Sensing of Biomass
254
can be taken into account by model developers and end-users to improve model
formulation and/or application. As a consequence, improving primary production
estimates will increase the skill of global models (Friedrichs et al., 2009).
3.2 Different fixatives and HCl concentrations in phytoplankton primary production
Results of the phytoplankton primary production experiments are presented in separate
figures as filter, filtrated and total fractions. In the graphs each bar represents one biological
replicate, while standard deviations result from 2 scintillation counts (from the Quanta-
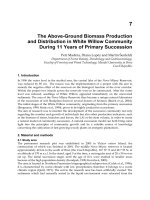
Smart scintillation analyzer). In Figure 1 are shown filter DPM values of the three
experiments. In the second experiment some problems took place during filtration, i.e. the
process occurred too quickly probably due to not proper positioning of the following filters:
1L0.1N, 2L0.1N, 2L0.5N, 1L1N, 2L1N, 1L5N and 2L5N, therefore leading to an
underestimate of DPM values.
Fig. 1. Filter DPM values of light and dark replicates resulted from the three experiments.
Each bar represents the mean of 2 scintillation counts for each biological replicate. For each
experiment a different y-axis scale was applied to better highlight the difference between
acid treatments.
In the same experiment we observed that DPM values of the first dark replicate were higher
than those of the second dark replicate, which were in turn higher than the third one (except
for the 5N treatment). Not considering the above mentioned replicates, we noted that both
light and dark DPM values of the second experiment were higher than those of the first and
third ones. Higher values were probably due to a higher chl a content (2.62 µg l
-1
) measured
at 5 m depth on 30
th
January 2007 if compared to the chl a content estimated on the other
two sampling dates (0.88 and 0.52 µg l
-1
in 2006 and 2008, respectively). Focusing only on the
first and last experiments, we observed a decrease in DPM values going from 0.1N to 5N
treatment, both in dark, but especially in light replicates. Considering the average of the
three light biological replicates, there was a consistent reduction in DPM values in
correspondence with progressively stronger acid treatments. In detail, the DPM decrease
between 0.1N and 0.2N treatments, expressed as percentage, was very similar: 5.99% and
5.33% in the first and last experiment, respectively. This percentage of difference was higher
comparing the 0.1N acid treatment to the 2N one: 19.18% and 20.02% in the first and last
experiment, respectively. Finally, the percentage decrease between 0.1N and 5N treatments
reached 31.17% in the third experiment.
In Situ Primary Production Measurements as an Analytical Support
to Remote Sensing - An Experimental Approach to Standardize the
14
C Incorporation Technique
255
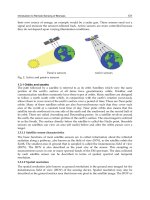
In Figure 2a-f are shown DPM values of filtrated samples of the three experiments. In the
second experiment higher DPM values were registered due to the previously reported
filtration issue. We infer that some of the labelled phytoplankton ended up in the vial placed
underneath the corresponding filter without being retained by the filter. In fact there is a
relationship between high DPM values of the filtrated samples and low DPM values of the
corresponding filters (1L0.1N, 2L0.1N, 2L0.5N, 1L1N, 2L1N, 1L5N and 2L5N). Unlike the
filters, where light values were 1 or 2 orders of magnitude higher than dark values, in the
filtrated samples their difference was markedly lower. Since the volume of the filtrated
sample was 5 times lower than that of the filter sample, DPM values obtained from the
filtrated samples were generally 1 or 2 orders of magnitude lower than those obtained from
the filters. When DPM values are very low, the biological variability among replicates is
amplified. This variability was noted particularly in light and dark samples of the first
experiment.
Fig. 2. DPM of light and dark filtrated fractions resulted from the three experiments. Each
bar represents the mean of 2 scintillation counts for each biological replicate. For each
experiment a different y-axis scale was applied to better highlight the difference between
acid treatments.
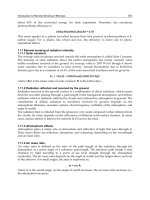
Fig. 3. DPM of light and dark total samples resulted from the three experiments. Each bar
represents the mean of 2 scintillation counts for each biological replicate. For each
experiment a different y-axis scale was applied to better highlight the difference between
acid treatments.
Biomass and Remote Sensing of Biomass
256
In Figure 3a-f are shown DPM values from total samples of the three experiments. Due to
higher chl a content DPM light values from the second experiment were twice as high
than those obtained in the other two experiments. On the contrary, DPM dark values,
which were always lower than the corresponding DPM light values, were progressively
higher from the first to the last experiment. However, the decrease in DPM values, going
from 0.1N to 5N treatment, was mostly evident in the third experiment, both for light and
dark replicates.
While the average reduction of light DPM values between the 0.1N and 0.2N treatments was
identical in the second and third experiments (6.62% and 6.61%, respectively), the
percentage decrease in other pairs of treatments (0.1N vs 0.5N; 0.1N vs 1N; 0.1N vs 2N; 0.1N
vs 5N) was much higher in the last experiment, reaching even 56.4% when the 0.1N and 5N
treatments were compared.
3.3 Statistical analysis
The t-test applied to dark samples of the three experiments highlighted only a few
statistically significant differences between pairs of the tested acid normalities, e. g. for
filters in the first experiment and the filtrated fraction in the last one, probably because DPM
values were comparable to the background noise of the instrument. Except for the last
experiment, performed in September 2008, the t-test did not show any differences between
pairs of the tested acid normalities when performed on filtrated fractions, either (Table 3). In
detail, in the first light-experiment the 2N acid treatment on filters was significantly
different from the 0.1N, 0.2N and 0.5N ones, while the 5N treatment of the total light
fraction was significantly diverse from almost all the other treatments. Similarly, in the same
dark-experiments only the 5N acid treatment performed on filters was significantly different
from the 0.1N, 0.2N and 0.5N ones. The most significant differences between pairs of acid
treatments were obtained in the last experiment for the total light fraction.
filters filtrated total filters filtrated total filters filtrated total filters filtrated total filters filtrated total filters filtrated total
0.1N
vs
0.2N
n.s. n.s. n.s. n.s. n.s. n.s. n.s. n.s. n.s. n.s. n.s. n.s. n.s. n.s. n.s. n.s. n.s. n.s.
0.1N
vs
0.5N
n.s. n.s. n.s. n.s. n.s. n.s. n.s. n.s. n.s. n.s. n.s. n.s. 4.49* n.s. n.s. n.s. n.s. n.s.
0.1N
vs
1N
n.s. n.s. n.s. n.s. n.s. n.s. n.s. n.s. n.s. n.s. n.s. n.s. n.s. n.s. n.s. n.s. n.s. n.s.
0.1N
vs
2N
7.90** n.s. n.s. n.s. n.s. n.s. n.s. n.s. n.s. n.s. n.s. n.s. n.s. n.s. 5.36** n.s. 5.09* n.s.
0.1N
vs
5N
n.s. n.s. 5.50* 4.14* n.s. n.s. n.s. n.s. n.s. n.s. n.s. n.s. 4.19* 4.51* 7.27** n.s. n.s. n.s.
0.2N
vs
0.5N
n.s. n.s. n.s. n.s. n.s. n.s. n.s. n.s. n.s. n.s. n.s. n.s. n.s. n.s. n.s. n.s. n.s. n.s.
0.2N
vs
1N
n.s. n.s. n.s. n.s. n.s. n.s. 5.03** n.s. n.s. n.s. n.s. n.s. n.s. n.s. n.s. n.s. n.s. n.s.
0.2N
vs
2N
3.13* n.s. n.s. n.s. n.s. n.s. 3.79* n.s. n.s. n.s. n.s. n.s. n.s. n.s. 4.72* n.s. 4.75* n.s.
0.2N
vs
5N
n.s. n.s. 11.87*** 4.61* n.s. n.s. 3.44* n.s. n.s. n.s. n.s. n.s. n.s. 3.17* 6.63* n.s. n.s. n.s.
0.5N
vs
1N
n.s. n.s. n.s. n.s. n.s. n.s. n.s. n.s. n.s. n.s. n.s. n.s. n.s. n.s. n.s. n.s. n.s. n.s.
0.5N
vs
2N
3.04* n.s. n.s. n.s. n.s. n.s. n.s. n.s. n.s. n.s. n.s. n.s. n.s. n.s. 4.77* n.s. n.s. n.s.
0.5N
vs
5N
n.s. n.s. 6.48** 3.26* n.s. n.s. n.s. n.s. n.s. n.s. n.s. n.s. n.s. 4.68* 8.98*** n.s. n.s. 2.90*
1N
vs
2N
n.s. n.s. n.s. n.s. n.s. n.s. n.s. n.s. n.s. n.s. n.s. n.s. n.s. n.s. 3.61* n.s. 4.85* n.s.
1N
vs
5N
n.s. n.s. n.s. n.s. n.s. n.s. n.s. n.s. n.s. n.s. n.s. n.s. n.s. n.s. 6.03** n.s. n.s. n.s.
2
N
vs
5N
n.s. n.s. 10.65*** n.s. n.s. n.s. n.s. n.s. n.s. n.s. n.s. n.s. n.s. n.s. n.s. n.s. - 3.12* n.s.
3
rd
experiment (light) 3
rd
experiment (dark)1
st
experiment (light) 1
st
experiment (dark) 2
nd
experiment (light) 2
nd
experiment (dark)
Table 3. Student's t-test applied to pairs of treatments (acid normalities); n.s. = not
significant; *** p 0.001; ** p0.01; * p0.05
3.4 Effects of HCl on the planktonic microalgal community
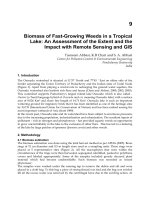
The litmus test performed on the planktonic community revealed that the addition of 200 µl
of HCl 0.1N was sufficient to decrease the pH value from 8 to 4 (Table 4, Fig. 4).
In Situ Primary Production Measurements as an Analytical Support
to Remote Sensing - An Experimental Approach to Standardize the
14
C Incorporation Technique
257
Without acid 0.1N 0.2N 0.5N 1N 2N 5N
8 4 2 - 3 2 1 - 2 1 0 - 1
pH value
Table 4. Litmus test performed on the mix culture (5 ml) in order to test the pH value at
increasing acid normalities.
The further increase of HCl normality gradually lowered the pH value down to zero. Since
HCl is added to remove the excess labelled C, it is important to know the pH of the acidified
sample. In fact, if HCl is not sufficiently concentrated, pH will not reach the value which is
necessary to shift the equilibrium towards the CO
2
fraction and consequently the removal of
the labelled bicarbonate from the system. Only a pH < 5 ensures a complete shift towards
the CO
2
fraction (Libes, 1992). In water samples the 0.1N HCl treatment was enough to
lower pH below this value. On the other hand, if the acid is too aggressive it can damage the
cell membrane, causing the loss of an undetermined quantity of assimilated
14
C and
therefore leading to an underestimate of DPM values.
Fig. 4. Litmus test performed on the mix culture (5 ml) in order to test the pH value at
increasing acid normalities.
The macroscopic observation of the acidified mix culture samples revealed that while the
control was brownish red coloured (mostly due to diatom pigments), 0.1N, 0.2N and 0.5N
treatments were greenish. We hypothesize that in the first three mild treatments HCl
degraded the accessory pigments, i.e. fucoxanthin, typical of diatoms and responsible for the
brownish red colouring, but not chlorophyll a. Samples treated with an acid concentration
from 1N up to 5N lost their colouring.
Another experiment on the planktonic community was performed where both motility of
flagellates and of the tychopelagic diatom and chlorophyll a fluorescence were used as
proxies of cell viability. Motility was observed only in the control, since from the 0.1N
treatment onward all cells were motionless (Table 5). From the microscopic observations in
contrast phase we noticed that from the 0.1N treatment onward some frustules of
Cylindrotheca fusiformis appeared deformed and thinner than in the control (Fig. 5). In the
same samples, all Gymnodinium sp. cells showed detachment of their thecal membranes.
Biomass and Remote Sensing of Biomass
258
not acidified 0.1N 0.2N 0.5N 1N 2N 5N not acidified 0.1N 0.2N 0.5N 1N 2N 5N
Planktonic diatoms +++ + 0 0 0 0 0
Benthic (centric) diatoms +++ +++ +++/++ ++ ++ ++ ++/+
Tychopelagic diatoms +++ +++/+ (*) + + +/0 0 0 ++ 0 0 0 0 0 0
Naked dinoflagellates +++ + + 0 0 0 0 + 0 0 0 0 0 0
Thecate dinoflagellates +++ +++ +++ +++ +++ ++/+ + + 0 0 0 0 0 0
Phytoflagellates +++ + 0 0 0 0 0 ++ 0 0 0 0 0 0
Chlorophyll a status
Motility
Table 5. Viability test on the mix culture at increasing acid normalities using both cell
motility and chl a fluorescence as proxies. Chl a status: +++, intense red; ++, orange; + pink;
0, not fluorescent. Motility: ++, good motility; +, reduced motility; , naturally not motile;
0, induced non-motility by the acid. (*) half of the cells with viable chl a, the other half with
degraded chl a.
Fig. 5. Micrograph of the mix culture treated with 0.1N HCl observed under an inverted
microscope at 200X magnification using phase contrast.
Analysing samples in epifluorescence, we noticed that in the control all cells appeared red
coloured. In the 0.1N treatment a different response was observed according to the taxon:
the planktonic diatom, the naked dinoflagellate and the small phytoflagellate showed a less
intense pigmentation (with respect to the control); half of the observed tychopelagic diatom
cells was still red coloured, while the other half became faded. Only the benthic diatom and
the thecate dinoflagellate were still bright red (Fig. 6).
In the 0.2N treatment the planktonic diatom and the small phytoflagellate did not show
fluorescence any more, whereas the tychopelagic diatom and the naked dinoflagellate
emitted a faint fluorescence.
In Situ Primary Production Measurements as an Analytical Support
to Remote Sensing - An Experimental Approach to Standardize the
14
C Incorporation Technique
259
Fig. 6. Micrograph of the mix culture treated with 0.1N HCl observed under an inverted
microscope at 200X magnification using epifluorescence.
Most of benthic diatom cells turned from red to orange, while only thecate dinoflagellate
cells kept a bright red colour. Unlike the 0.2N treatment, the 0.5N sample presented naked
dinoflagellate cells which lost their fluorescence and benthic diatom cells which were
definitively orange. The only alteration in the next treatment (1N) was represented by
tychopelagic diatoms which became pale. In the 2N treatment tychopelagic diatoms were
not fluorescent any more, while thecate dinoflagellate cells turned their fluorescence from
intense red to faded orange. In the last treatment (5N) benthic diatoms turned to faded
orange, whereas thecate dinoflagellates emitted a faint fluorescence.
The microscopic observation of the recovered mix culture of the not acidified treatment
revealed that some taxa were still alive and motile. The undetermined Cryptophycea was
very active and abundant. Cylindrotheca fusiformis completely colonized the bottom of the
flask, whereas Lingulodinium polyedrum was still motile but not abundant. We believe that
both Gymnodinium sp. and Chaetoceros sp. did not grow due to interspecific competition,
while Paralia sulcata was probably inhibited by the high temperature and irradiance since
this species prefers low temperature and dim light (McQuoid & Nordberg, 2003). The
recovered culture of the 0.1N treatment showed a similar scenario with the exception of the
undetermined Cryptophycea which disappeared from the flask, confirming its immediate
reaction to acid addition. In the recovered culture of the 0.2N treatment we observed the
empty frustules of Cylindrotheca fusiformis as well as completely pale and not motile
Lingulodinium cells. In this treatment a Paralia sulcata colony (15 cells ca.) was encountered;
most of the cells were still pigmented. In the recovered culture of the 5N treatment none of
the microalgae was observed.
Considering the results of the litmus test and the microalgal viability test together, some
considerations can be made. If the pH value is not sufficiently low, the inorganic
14
C cannot
Biomass and Remote Sensing of Biomass
260
be completely removed from the system and the cells remain still metabolically active.
Consequently, the microalgae are able to continue both to uptake inorganic carbon and to
consume the assimilated
14
C during the period elapsing between the addition of the acid
and the addition of the scintillation liquid. Moreover, if the pH value is sufficiently low to
completely remove the inorganic
14
C, but not to kill all the cells, primary production could
be underestimated. In fact, with a complete depletion of inorganic carbon (pH <5), the cells
cannot uptake it any more, but they could continue to consume the already assimilated
14
C.
This could occur treating the not filtered water samples with a mild acid.
Therefore we reckon that the acid concentration is crucial: only a sufficiently strong acid
allows the complete removal of the inorganic carbon and at the same time the killing of all
microalgal cells. In fact, when mild acid treatments were used, some taxa seemed to be not
affected by the acid, as demonstrated by both our viability test and our recovery experiment.
For example, the benthic diatom Paralia sulcata maintained a bright autofluorescence at
lower pH values than other taxa. Benthic microalgae have a thicker and more silicified
frustule compared to planktonic forms, which probably prevents the acid from penetrating
into the cell. This can be of particular interest when the phytoplankton community is
characterized by the presence of benthic diatoms; those communities are typical of shallow
coastal water masses rather than deeper waters.
4. Conclusion
The aim of this study was to define which HCl concentration, with an equal volume, among
0.1N, 0.2N, 0.5N, 1N, 2N and 5N (which correspond to final HCl concentrations of 0.004N-
0.008N-0.02N-0.04N-0.08N-0.2N, respectively, for 5 ml filtrated and total samples) was
sufficient both to remove the excess labelled bicarbonate and to kill the cells but without
damaging their structures and therefore leading to loss of assimilated
14
C. The litmus test
demonstrated that the use of a mild acid (0.1N) does decrease the pH from 8 to 4. However,
the results obtained from our viability test and recovery experiment suggest that some
microalgal taxa in the not filtrated samples could remain still photosynthetically active after
a too mild acid treatment. Therefore, the use of a slightly more concentrated acid (0.2N) is
recommended. In our experiments this acid concentration led to on average 6% lower DPM
values if compared to the 0.1N treatment, both for filters and total samples. Nevertheless,
we believe that this small loss is acceptable in exchange for greater sureness of having killed
the majority of the microalgal cells. In contrast, it is very likely that the 5N treatment
damages the cell membrane with the consequent loss of assimilated
14
C, leading to an
underestimate of DPM values up to 31% for filters and 56% for total samples if compared to
the mildest acid treatment. Our experiments were carried out using oligotrophic water
(Fonda Umani et al., 2004) from the Gulf of Trieste. In the next future we are going to carry
out another set of experiments on mesotrophic and eutrophic waters, applying the same
chloridric acid concentrations, to test if similar results are achieved.
5. Acknowledgment
We thank Daniela Fornasaro and Benedetta Guardiani for helping us during the
experiments. We are also grateful to Oriana Blasutto for water sampling and Massimo Celio
for multiparameter probe data. Additional thanks go to Marina Cabrini and Paola Del
Negro for the help they have provided in relation to this work. Finally, we thank Alfred
Beran for providing us with microalgal cultures.
In Situ Primary Production Measurements as an Analytical Support
to Remote Sensing - An Experimental Approach to Standardize the
14
C Incorporation Technique
261
6. References
Babin, M.; Morel, A. & Gagnon, R. (1994). An incubator designed for extensive and sensitive
measurements of phytoplankton photosynthetic parameters. Limnology and
Oceanography, Vol.39, No.3, pp. 694-702
Barber, R.T. & Hilting, A.K. (2002). Carbon Assimilation in Marine and Freshwater
Ecosystems, In: Phytoplankton Productivity, P.J. le B. Williams; D.N. Thomas & C.S.
Reynolds, (Eds.), 16-43, Blackwell Science, ISBN0-632-05711-4, Oxford, UK
Behrenfeld, M.J. & Falkowski, P.G. (1997). Photosynthetic rates derived from satellite-based
chlorophyll concentration. Limnology and Oceanography, Vol.42, No.1, pp. 1-20
Carr, M,E.; Friedrichs, M.A.M.; Schmeltz, M.; Aita, M.N.; Antoine, D.; Arrigo, K.R.;
Asanuma, I.; Aumont, O.; Barber, R.; Behrenfeld, M. et al. (2006). A comparison of
global estimates of marine primary production from ocean color. Deep-Sea Research
II, Vol.53, pp. 741-770
Cermeño, P.; Marañón, E.; Pérez, V.; Serret, P.; Fernández, E. & Castro, C.G. (2006).
Phytoplankton size structure and primary production in a highly dynamic coastal
ecosystem (Ría de Vigo, NW-Spain): Seasonal and short-time scale variability.
Estuarine Coastal and Shelf Science, Vol.67, pp. 251-266
Fonda Umani, S.; Beran, A.; Parlato, S.; Virgilio, D.; Zollet, T.; De Olazabal, A.; Lazzarini, B.
& Cabrini, M. (2004). Noctiluca scintillans MACARTNEY in the Northern Adriatic
Sea: long-term dynamics, relationships with temperature and eutrophication, and
role in the food web. Journal of Plankton Research, Vol.26, pp. 545-561
Friedrichs, M.A.M.; Carr, M.E.; Barber, R.T.; Scardi, M.; Antoine, D.; Armstrong, R.A.;
Asanuma, I.; Behrenfeld, M.J.; Buitenhuis, E.T.; Chai, F. et al. (2009). Assessing the
uncertainties of model estimates of primary productivity in the tropical Pacific
Ocean. Journal of Marine Systems, Vol.76, pp. 113-133
del Giorgio, P.A. & Williams, P.J. le B. (2005). Respiration in Aquatic Ecosystems, Oxford
University Press, ISBN 0-19-852709-8, Oxford, UK
Hewson, I.; O’Neil, J.M.; Heil, C.A.; Bratbak, G. & Dennison, W. C. (2001) Effects of
concentrated viral communities on photosynthesis and community composition of
co-occurring benthic microalgae and phytoplankton. Aquatic Microbial Ecology,
Vol.25, pp. 1-10
Hyde, K.J.W.; O’Reilly, J.E. & Oviatt, C.A. (2008). Evaluation and application of satellite
primary production models in Massachusetts Bay. Continental Shelf Research, Vol.28,
pp. 1340-1351
Karl, D.M.; Hebel, D.V. & Björkman, K. (1998). The role of dissolved organic matter release
in the productivity of the oligotrophic North Pacific Ocean. Limnology and
Oceanography, Vol.43, pp. 1270-1286
Lewis, M.R. & Smith, J.C. (1983). A small volume, short-incubation-time method for
measurement of photosynthesis as a function of incident irradiance. Marine Ecology
Progress Series, Vol.13, pp. 99-102
Libes, S. M. (1992). An Introduction to Marine Biogeochemistry. Wiley & Sons, Inc. ISBN 978-0-
12-088530-5, New York, U.S.A.
Mangoni, O.; Modigh, M.; Mozetič, P.; Bergamasco, A.; Rivaro, P. & Saggiomo, V. (2008).
Structure and photosynthetic properties of phytoplankton assemblages in a highly
dynamic system, the Northern Adriatic Sea. Estuarine Coastal and Shelf Science,
Vol.77, No.4, pp. 633-644
Biomass and Remote Sensing of Biomass
262
Marañón, E.; Cermeño, P.; Fernández, E.; Rodríguez, J. & Zabala, L. (2004). Significance and
mechanisms of photosynthetic production of dissolved organic carbon in a coastal
eutrophic system. Limnology and Oceanography, Vol.49, pp. 1652-1666
Marra, J. (2002). Approaches to the Measurement of Plankton Production, In: Phytoplankton
Productivity, P.J. le B. Williams; D.N. Thomas & C.S. Reynolds, (Eds.), 78-108,
Blackwell Science, ISBN0-632-05711-4, Oxford, UK
McQuoid, M.R. & Nordberg, K. (2003). The diatom Paralia sulcata as an environmental
indicator species in coastal sediments. Estuarine Coastal and Shelf Science, Vol.56, pp.
339-354
Moutin, T. & Raimbault, P. (2002). Primary production, carbon export and nutrients
availability in western and eastern Mediterranean Sea in early summer 1996
(MINOS cruise). Journal of Marine Systems, Vol. 33-34, pp. 273-288
O’Donohue, M.J.H. & Dennison, W.C. (1997). Phytoplankton productivity response to
nutrient concentrations, light availability and temperature along an Australian
estuarine gradient. Estuaries, Vol.20, No.3, pp. 521-533
Peterson, B.J. (1980). Aquatic primary productivity and the
14
C-CO
2
method: A history of the
productivity problem. Annual Review of Ecology and Systematics, Vol.11, pp. 359-385
Pugnetti, A.; Armeni, M.; Camatti, E.; Crevatin, E.; Dell’Anno, A.; Del Negro, P.; Milandri,
A.; Socal, G.; Fonda Umani, S. & Danovaro, R. (2005). Imbalance between
phytoplankton production and bacterial carbon demand in relation to mucilage
formation in the Northern Adriatic Sea. Science of the Total Environment, Vol.353, pp.
162-177
Steemann-Nielsen, E. (1952). The use of radioactive carbon (14C) for measuring organic
production in the sea. Journal du Conseil Permanent International pour l’Exploration de
la Mer., Vol.16, pp. 117-140
Teira, E.; Mouriño, B.; Marañón, E.; Pérez, V.; Pazó, M. J.; Serret, P.; de Armas, D.; Escánez,
J.; Woodwaard, E.M.S. & Fernández, E. (2005). Variability of chlorophyll and
primary production in the Eastern North Atlantic Subtropical Gyre: potential
factors affecting phytoplankton activity. Deep-Sea Research Part I, Vol.52, pp. 569-588
Theodórsson, P. & Bjarnason, J.O. (1975). The acid-bubbling method for primary
productivity measurements modified and tested. Limnology and Oceanography,
Vol.20, pp. 1018-1019
Tilstone, G.; Smyth, T.; Poulton, A. & Huston, R. (2009). Measured and remotely sensed
estimates of primary production in the Atlantic Ocean from 1998 to 2005. Deep-Sea
Research II, Vol.56, pp. 918-930
Williams, P.J. le B.; Thomas, D.N. & Reynolds, C.S. (2002). Phytoplankton Productivity,
Blackwell Science, ISBN0-632-05711-4, Oxford, UK