Aeronautics and Astronautics Part 13 doc
Bạn đang xem bản rút gọn của tài liệu. Xem và tải ngay bản đầy đủ của tài liệu tại đây (2.21 MB, 40 trang )
An Agile Cost Estimating
Methodology for Aerospace Procurement Operations: Genetic Causal Cost CENTRE-ing
469
of fuzzy set theory is the inherent capability of representing vague knowledge. Roy (2003)
however states that fuzzy logic applications within the field of cost estimating have not
been well established, well researched or published. The impact of uncertainty and
sensitivity within cost modelling has been also well researched within aerospace to show
that Monte Carlo techniques can be employed to increase the robustness of the analysis
(Curran et al, 2009).
It should be noted that each of the estimating methods to varying degrees can be employed
in either a ‘top-down’ or ‘bottom-up’ fashion. ‘Top-down’ involves the formulation of an
overall estimate to represent the completed project which may then be broken down into
subcomponents of cost as required. In contrast, ‘bottom-up’ estimating [Ting, (1999)]
generates sublevel and component costs first which may then be aggregated in order to
produce an overall estimate. Elements of each of these methods are more or less applicable
at various stages of the product life cycle. Further reviews of these methods are provided by
Curran (2004), Roy (2003) and Stewart (1995).
4. Methodology: Cost CENTRE-ing
The purpose of incorporating improved estimating methodologies within Procurement is
essentially to provide additional information against which sourcing issues may be more
readily considered. The research method presented in this Section gives attention to
identifying opportunities for cost reduction from currently outsourced parts based upon
unjustifiable cost or price variances amongst similar parts. Control follows estimate
generation and usually involves the comparison with actual and other estimates for the
purpose of identifying such variances and then attempting to understand their causes with
the view to bringing cost to a desired baseline. Three types of cost variance are of interest
when comparing cost information of similar items including: 1) comparison of actual cost to
actual cost, or indeed lower level actual cost components, 2) comparison of actual costs to
cost estimates, at any level of aggregation, and 3) comparison of an estimate to another
estimate developed from a different approach.
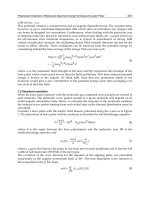
Figure 6 presents a synthesis of procurement best-practice in unit cost/price analysis, with
reference to the authors experience and the literature review in Section 3. It is reflective of
the latest cost management research in the area (Pugh et al, 2010a; Pugh et al, 2010b) and
involves tailoring cost analysis to given types of purchase situation.
It can be seen that the key elements identified are the roles of Classification, Data mining,
Cost/Price Analysis, Supplier Selection and Cost Control. Consequently, the presented
work was therefore directed towards the development of a modelling methodology and
process that would support the Cost/Price Analysis stage in particular. The resulting
methodology was termed (Genetic Causal) Cost CENTRE-ing, as the word ‘CENTRE’ is an
anagram of the 6 key process steps to followed in implementing the methodology. The
Genetic Causal basis (Curran et al, 2004) of the methodology refers the decomposition of
procurement items into ‘genetic’ families of similar parts based either on part material, form,
function or manufacturing process, so that then, historical costing data can be used to
develop ‘causal’ relations to estimate the part-cost of any instance of an item from that
genetic family.
The causality of the costing algorithms is a very significant issue so that the equations are
robust and dependable, with the dependant variable as cost being a function of
independent variables relating to the part definition, such as part, process or function
Aeronautics and Astronautics
470
information, rather than purely statistical in nature; as we find often in traditional
parametric costing (see Curran et al, 2004). In addition, another requirement was that the
Cost CENTRE-ing process could provide an agile method for up-to-date analysis,
estimation, control and reduction of procurement costs and so it was decided at the outset
that it should be able to easily incorporate new cost data and part information in order to
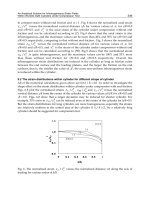
upgrade the costing algorithms in an automated manner. As illustrated in Figure 7, the
method is broken down into six key steps: (1) Classification, (2) Encircling, (3)
Normalization, (4) Trending, (5) Cost Reduction Identification and (6) Enforcement. Steps
1 to 4 involve knowledge discovery incorporating data mining, statistical study (e.g. for
variable selection, significance and hypothesis testing, trending and optimization) with
scope for sensitivity and likelihood testing, which brings in concepts central to
probability.
Fig. 6. Procurement best practice in unit cost or price analysis
An Agile Cost Estimating
Methodology for Aerospace Procurement Operations: Genetic Causal Cost CENTRE-ing
471
Fig. 7. The Cost CENTRE-ing methodology
Aeronautics and Astronautics
472
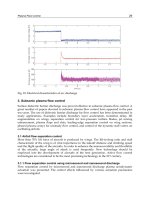
Fig. 8. A hybrid approach to data mining
The steps associated with Cost CENTRE-ing are further expanded below and map equally
well to the requirements presented through Figure 6, starting with Classification and
finishing with the application to Cost Control:
(1) Classification: as a key aspect of the methodology and was implemented to define families
of parts. There is an obvious trade-off in terms of increasing the complexity through the
number of Cost Estimating Relationships (CERs) embodied in the eventual methodology.
Classification was developed according to the following descriptors as taken from a part’s
Bill of Material: Procurement Part Type, Aircraft Type, Sub-Level Contract, Process, Material
Form and Material.
(2) Encircling: involves analysis of a data set’s principal components and allows clusters to
be identified in order to improve grouping refinement and proceeds as follows: Machine
Type, Part Size and Batch Size. Figure 8 highlights a hybrid data mining approach involving
data exploration, standardization, and visualization, reduction with subset generation as
well as statistical testing and iterative evaluation (Weiss 1988, Fayyad 2002). Considering
this, the process of pattern matching that is being used in the presented approach to data
grouping is analogous to having degrees of freedom in a formal statistical test.
(3) Normalization: After surveying the more advanced methods being developed, such as
Neural Networks and fuzzy logic etc, it was decided that Multiple Linear Regression would
be used to model the link between part attributes, as independent variables, and unit cost, as
the dependant variable (Watson et al, 2006). This requires that the data be normalized in
order to distil out the key cost drivers to be used in the formulation of parametric relations.
There is a trade-off here in terms of the number of drivers, which may be used to optimize a
given result and the corresponding actual improvement considering the additional
processing time required to generate the result.
An Agile Cost Estimating
Methodology for Aerospace Procurement Operations: Genetic Causal Cost CENTRE-ing
473
(4) Trending: also considering knowledge capture and formalization, this step allows the
appropriate trend which describes the mapping relationship of cost to the independent
variables to be selected. The most appropriate trend to use may change from case to case
although what is common is the means by which the goodness of fit of a relationship may be
measured (through the R
2
value that describes the degree of statistical fitting), with the
trend that best minimizes random variance or error being selected in each case.
(5) Reduction and (6) Enforcement: these steps are linked to Procurement’s use of the
relationships and trends developed at this point in the process. ‘Reduction’ entails
application and comparison of prediction trends to current ‘actuals’ or to results developed
by other estimating techniques for the purpose of identifying Opportunities for Cost
Reduction either by direct total cost comparison at part level or sub-cost components (e.g.
Make, Material, Treatments, etc.). Once identified, the Procurement function must then
decide upon the appropriate course of action to be taken in order to attain reductions
through ‘Enforcement’.
5. Results and validation
The effectiveness of the Cost CENTRE-ing methodology and process was validated on three
separate studies (including four specific cases in total) in collaboration with the procurement
function at Bombardier Aerospace Belfast. Three studies of a different nature were chosen to
represent the range of parts procured within aerospace. This included: 1) a machined parts
example with a data set of 850 ‘Outside Production’ aircraft items on one contract and
another data set of 117 parts from a different aircraft contract, 2) a vendor-specialized
‘systems’ part in the form of Thermal Anti-Icing Valves of which there was a typically small
data set of 6, and 3) a more common fastening part in the form of a spigot for which there
was a data set of 201. The results from these validation studies are presented in the
following Sections 5.1 through 5.3, where the methodology is presented according to the six
key steps of: (1) Classification, (2) Encircling, (3) Normalization, (4) Trending, (5) Cost
Reduction Identification and (6) Enforcement. The machining case study was just one of
many carried out on the whole part base of some 7,000 machined parts at Bombardier
(Watson et al, 2006).
9%
7%
5%
44%
9%
11%
2%
13%
Systems Hardware
Fastener Hardware
Electrical Hardware
Outside Production
Raw Material 2
Raw Material
Bought Out
(blank)
Fig. 9. An example of the procurement spend breakdown for Bombardier Aerospace Belfast
Aeronautics and Astronautics
474
5.1 Validation study 1: Outside-production machined aerospace parts
(1) Classification: Figure 9 presents the general breakdown of procurement spend at
Bombardier Aerospace Belfast while Figure 10 further disaggregates the spend on ‘Outside
Production’ parts. Consequently, one can see the opportunity to define and develop families
of parts of a similar in nature.
55%
10%
2%
23%
10%
Machined Part
Major Assembly
Metal Bond Part
Sheet Metal Part
Systems Part
Fig. 10. The breakdown of outside product parts for Bombardier Aerospace Belfast
(2) Encircling: In Figures 9 and 10, it can be seen that the parts have been categorized in
order to group parts with a increased degree of commonality. Primarily, at this level of
distinction it is paramount to choose associated part attributes that have been identified as
driving manufacturing cost, thereby following the principle of causality. For example,
weight might be used well as an independent variable for material cost but is less relevant
to unit cost (when in aerospace it typically costs money to take weight out of a structure)
while other independent variable may be less obvious but still of a causal nature such as
using direct as part count as an assembly cost driver. It is also important to choose
attributes that are already defined at whatever stage of the product life that the model is
to be utilized, and of course that these are also readily available. If the Cost CENTRE-ing
implementation is fully coupled to design platforms (Curran et al, 2001; Curran et al,
2007a; Curran, 2010) it is then possible to impose a much greater level of definition,
through actual part volume etc, which would increase the accuracy but also the
operational complexity of the Model. However, this is more relevant to validation,
improvements in the costing algorithms and cost reduction exercises while as
procurement costing at the conceptual design phase does not have the design definition
one would want for very accurate causal modelling of costs.
(3) Normalization: A simple initial causal parametric relation was generated from the
data for machined parts using the Multiple Linear Regression facility within the MS Excel
Data Analysis module. The detailed manual cost estimates of the machining times for 850
parts were used as the dependant variables while the readily available independent
variables were all based on size attributes (thickness, length and breadth). In terms of
driving the parametric relation, the size envelope is primarily linked to the material
removal although the relation would be much improved with more detailed attribute
data. Work is progressing in also linking part complexity, as driven by key design
attributes of the part.
An Agile Cost Estimating
Methodology for Aerospace Procurement Operations: Genetic Causal Cost CENTRE-ing
475
(4) Trending: Trending was carried out using Multiple Linear Regression, where
machining time was the estimated time for a given component made from a billet of
thickness T, length L and width W; according to three regression coefficients and a
constant. It is interesting to also note that the regression in question had a ‘Multiple R’
value of 0.71, which can be interpreted as the mathematical formulation account for
approximately 70% of the variation in the historical data. A Multiple R value of 0.8 would
be preferable and could be feasible by improving the range of independent variables used
to characterize the parts, e.g. through the additional normalization according to part size
and design/machining complexity, as available. However, this machining case study was
one of many carried out on the whole part base of some 30,000 parts at Bombardier
(Watson et al, 2006).
0
2
4
6
8
10
12
14
1
33
65
97
129
161
193
225
257
289
321
353
385
417
449
481
513
545
577
609
641
673
705
737
769
801
833
Parts listed according to ascending cumulative Estmate time
Machining time (hrs)
QUB Actual
Fig. 11. Cost comparisons of 850 parts using ‘actuals’ (with more deviation) and the
model
The resulting estimates for the 850 parts are presented in Figure 11 where the Cost
CENTRE-ing ‘QUB’ estimate is compared against the actual times. However, the ‘Actuals’
were not directly available from the suppliers due to the sensitivity of the information and
had to be derived from a detailed estimate of the parts using the actual supply price and an
averaged machining rate. Anywhere on Figure 11 that there is significant disparity between
the two characteristics highlights those parts that require further investigation for potential
cost reduction, as presented in the following Section.
Aeronautics and Astronautics
476
0
50
100
150
200
250
300
350
1
6
11
16
21
26
31
36
41
46
51
56
61
66
71
76
81
86
91
96
101
106
111
116
Parts listed according to ascending cumulative Estmate time
Cumulative machining time (hrs)
Estimate ROM QUB Actual
Fig. 12. A detailed comparison for part costs with ‘Actuals’, the manual ROM and the ‘QUB’
model values and the current detailed manual estimates (the solid line)
48
54
104
117
93
98
112
0
2
4
6
8
10
12
14
1 112131415161718191101111
Parts list according to ascending Estimate time
Machining time per part (hrs)
Estimate ROM QUB Actual
Fig. 13. A comparison of the cumulative cycle times of the parts detailed in Figure 12
(5-6) Reduction/Enforcement: The Cost CENTRE-ing model developed for machined parts was
then applied to older 2
nd
contract where it was believed there might be greater opportunity
for cost reduction. Figure 12 presents a direct comparison between all cycle time values for
the 117 listed parts associated with the aircraft contract. Four types of estimated values are
presented, including: the detailed manual estimate, the Rough Order of Magnitude (ROM)
An Agile Cost Estimating
Methodology for Aerospace Procurement Operations: Genetic Causal Cost CENTRE-ing
477
estimate from an in-house parametric model, the Cost CENTRE-ing ‘QUB’ estimate and the
derived ‘Actuals’ estimate. It can be seen that a significant number of ‘Actuals’ are extremely
different. Figure 13 provides a cumulative comparison for each of the estimate types in
which the cumulative differentials again imply that the ‘Actuals’ are too high.
Consequently, a number of these parts were identified and the differentials calculated to
estimate the potential savings if the current suppliers were to reduce their price to the
appropriate should cost or else via supplier sourcing. For this case, potential savings of
£100,000 were generated through (6) Enforcement.
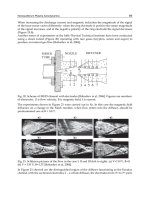
Fig. 14. An example of a typical Off-The-Shelf item used as a case study: an anti-icing valve
5.2 Validation study 2: Off-the-shelf systems items – Aircraft engine anti-icing valves
(1-2) Classification/Encircling: This study considers the procurement of Thermal Anti Icing
(TAI) valves as a general off-the-shelf item, relating to the system hardware category in
Figure 9 and shown in Figure 14. Ice protection relates to the prevention and removal of ice
accumulation (anti-icing and de-icing respectively) on either a wing leading edge or more
typically on the Nacelle inlet to an aircraft engine. However, there are a range of pneumatic
and electrical systems that supply the required heat from the engine bleed hot air for: wing
anti-icing; engine nose cowls and inlets and centre engine inlet duct; the upper VHF
antenna; fuel filter de-icing (more under power plant). The case study was undertaken with
a view towards determining why there is a cost variation between those TIA valves
currently being sourced so that this improved understanding would lead to a better ‘Should
Cost’ estimate; a term commonly used for a target cost or price. As such, the valve was
classified within the vendor item group with the valves identified as an encircled grouping
of parts with an obvious commonality.
(3) Normalization: The normalization procedure was implemented as set out previously in
order to deter-mine the cost drivers that differentiate the cost of one instance of the encircled
group from another. It was found that the cost of a valve is dependent for example upon;
casing and seal materials, performance specifications, testing and scale of production or
order quantities. The valves being examined were particularly challenging as they are
vendor-supplied items with little information available over that of the original operational
specifications and the actual buying price. Naturally, the implication is that one is dealing
Aeronautics and Astronautics
478
with price as the dependant variable rather than cost, which means that it is less feasible to
look for a causal linkage between price and item parameters. Notwithstanding, the more
fairly an item is priced the more likely it is that a trend can be established with statistical
significance. The initial process followed was that of extracting from the source documents
all operational specifications and requirements with a view towards removing any common
characteristics and then analyzing the remaining variables, to ascertain their influence on
the unit price. It was recognized that there are many attributes that contribute towards any
item’s overall cost, as well as other environmental factors that affect the part’s price, but in
such a case with very little or no knowledge of the cost breakdown, basic relationships for
those variables considered to be the major performance/functionality cost drivers can be
used.
(4) Trending: As previously, the trending relied on Multiple Linear Regression as the means
of relating the available cost drivers to the measure of cost, or more accurately price in this
case. Figure 15 plots some of the regression findings that were carried out to investigate the
relations between performance drivers and the Purchase Order value per part. Some of
these initial relations are of use in terms of a Rough Order Magnitude (ROM) estimate and
also provide the rationale and negotiating leverage for cost reduction dealt with in the next
Section. It should be noted that there is often interaction between such performance
parameters so that it is important to use more than one independent variable in calculating a
robust estimate.
y = 151.6x + 991.14
y = 87.543x + 1059.3
y = -578.16x + 1740.6
0
200
400
600
800
1000
1200
1400
00.511.52
PO Value ($/part)
Max Int Leakage (lbs/min) Max Ext Leakage (lbs/min)
Press Drop Through Valve Linear (Max Int Leakage (lbs/min))
Linear (Max Ext Leakage (lbs/min)) Linear (Press Drop Through Valve)
Fig. 15. Indicative cost benefit modeling with regards to performance specification
(5-6) Reduction/Enforcement: It was found from the studies that there was a deviation of
almost 50% in the cost of the procurement of these various valves but very little
discernable difference in the performance specifications. A more influential parameter
An Agile Cost Estimating
Methodology for Aerospace Procurement Operations: Genetic Causal Cost CENTRE-ing
479
was the order quantity although again there were anomalies in the trending. Ultimately,
however, these anomalies were then exploited as the negotiating rationale for cost
reduction as part of the Enforcement step. Consequently, for these procured parts that are
very difficult to cost the Cost CENTRE-ing approach as been used to identify the more
likely opportunities for cost reduction due to disparity in the estimates, rather than trying
to accurately cost a quite bespoke off-the-self system item, of which there are many on an
aircraft.
5.3 Validation study 3: General aerospace supply items - Spigots
(1) Classification: In total Bombardier Aerospace Shorts Methods Procurement currently
outsource in region of 34,000 parts across 618 suppliers for use within aircraft sub-assembly
build contracts. Of those parts, the overall part list was first classified according to
commodity code, for example, ‘Machinings’ accounting for some 7000 parts. This study
focused on what is termed ‘General Supply’ items, or more minor parts that are used in very
large quantities and are directly used typically in fastening and assembly.
(2) Encircling: In encircling a particular cluster of General Supply items for analysis those
parts used in engine Nacelle manufacture were considered, reducing the part count down to
840. Of these 840, a further filtering step was carried out to generate a list of those items,
which are considered to be similar in nature to a number of other parts within the grouping.
This included the main characteristics of a part being present in each item contained within
the ‘Similar to’ part set. The parts list of 840 parts was condensed to a list of ‘Similar-to’ part
sets which contained in total a shortlist of 201 parts. In this instance the encircling was
driven more by product orientation and function-role approach, rather than primarily for
part family, such as for valves; fuselage panels, Nosecowls etc. One such ‘Similar-to’ part set
related to a particular style of Spigot, which is a member of the ‘Round Bar & Tube’ part
family, as shown in Figure 16.
(3) Normalisation: The individual General Supply items/parts are normalized according to
make-cost, material cost and treatments. According to the ‘Should Cost’ Approach, parts
with similar attributes in terms of material, geometry, manufacturing and treatments
requirements should approximately have close make, material & treatment costs.
Fig. 16. A example of a General Supply item: a spigot
Aeronautics and Astronautics
480
(4) Trending: Again the procurement information is more price oriented and therefore rather
than direct modeling, the lowest component cost for each within the part set is then
considered to be an initial baseline value to which the others should be brought in line with,
remembering again that the Should Cost target is an estimate of a unit price that accurately
reflects reasonably achievable contractor economy and efficiency.
(5) Reduction: For each part set, the opportunities for cost reduction are identified by
calculating the differential between each parts’ current Make Cost, Treatments Cost &
Materials Cost for each of these parts. However, in addition the Should Costs for these
Costing components (within each part set) needs to also factor in the quantity of parts per
delivery batch, the rate of usage per year and the expected duration of build contracts to
which the parts are being used [Marquez and Blanchar, (2004)]. This gives the overall
potential for savings for each ‘Similar to’ Part set.
(6) Enforcement: The projected potential savings across six contracts currently in
development with Bombardier Aerospace Belfast are shown below in Figure 17 for the
spigots. It is interesting to note that there is a greater potential for savings in three particular
projects. This can be accounted for by the fact that Contracts D, E & F had been focused on
for some time with the application of the Should Cost philosophy, hence less opportunity
for cost reduction. If the other parts in the set have been sourced via the one supplier then
procurement contacts the supplier to discuss the cost drivers for the set of parts to establish
why each are not currently being supplied at Should Cost and ultimately look to renegotiate
the part costs. If sourced via a few different suppliers then this process is more complicated
but in essence the same as the cost drivers will indicate the true unit cost for an item so that
through mutually beneficial discussion (supply and demand) it should be possible to bring
the items to an agreed Should Cost. It should be noted that an activity that requires and
develops increased understanding of the cost drivers is beneficial for both the supplier and
customer and Enforcement is not carried out in order ‘to eat unfairly into supplier profit
margins’ but to establish a profitable and sustainable relationship between the two based
upon enhanced efficiency and best practice driven initiatives.
£0.00
£50,000.00
£100,000.00
£150,000.00
£200,000.00
£250,000.00
£300,000.00
£350,000.00
£400,000.00
£450,000.00
ABC DEF
CONTRACT
Savings (£/Year)
Fig. 17. Enforced savings for the spigot General Supply case study across a number of
contracts
An Agile Cost Estimating
Methodology for Aerospace Procurement Operations: Genetic Causal Cost CENTRE-ing
481
6. Discussion
In terms of key insights and contribution, Genetic Causal Cost CENTRE-ing utilizes part or
product attribute information to build families of causal cost estimating relations that are
based on rationale, rather than simply using market forces in procurement cost control and
the traditional practice of buyer-purchasing based on part numbers without any insight into
what is being purchased. Furthermore, the methodology has been applied to categorize very
large quantities of parts in order to provide an agile and responsive tool for supply chain
cost management. This provides the buyer with a stronger rationale in negotiating price
reductions, ideally to be used in conjunction with some gaming theory for example and the
more traditional assessment of market forces.
The application and relevance to real-world industrial situations has been validated in
collaboration with Bombardier Aerospace Belfast and is synthesized into the model
presented in Figure 7, the application of which was described in detail in Section 5.
Essentially, this is encapsulated in the six procedural steps of: item Classification; data
Encircling; cost driver Normalization; parameter Trending; cost Reduction identification;
negotiated Enforcement; termed Cost CENTRE-ing. Following the Genetic Causal approach,
this entails the categorization of part and product families stored in large data banks of cost
information, the generation of associated causal ‘Should Cost’ estimation algorithms, and
the application to current procurement operations through price negotiation. A tool was
developed and is being used by Bombardier Aerospace Belfast which has automated the
rapid formulation of the cost estimating functions, based on the most up to date data
available, so that the buyer can select the generic type of part to be procured and then
generate a ‘Should Cost’ range with associated limits of confidence relative to an ideal cost
estimate.
It is envisaged that practitioners will extend the work to improve the gathering of more
extensive data, including quantitative and qualitative knowledge capture, and that this
would entail more effective integration within the companies’ Design and Manufacturing
functions; in collecting and utilizing key part and product information. Ultimately, the
modeling capability could also explicitly facilitate the Design to Cost procedure to help
drive the design process towards more effective design solutions that exploit key supply
chain and procurement knowledge. However, in terms of a pure procurement tool, it is
envisaged that the application can be developed and exploited more fully as a web-based
technology that is more responsive in the identification and control of Lean suppliers who
operate within an optimal cost basis.
7. Conclusion
This Chapter presents an agile cost estimating methodology to be deployed in a
procurement operations tool for enabling more cost effective procurement control and cost
reduction. The method is agile in being able to easily include the latest market data to
generate its own costing algorithms that are established using the Genetic Casual Cost
CENTRE-ing approach: item Classification; data Encircling; cost driver Normalization;
parameter Trending; cost Reduction identification; negotiated Enforcement. It is shown that
the Cost CENTRE-ing method provides an agile method for responsive cost analysis,
estimation, control and reduction of procured aerospace parts. The methodology is based on
the structuring of parts into product families and utilized both manufacturing and
performance cost drivers to establish causal cost estimating relationships, according to the
Aeronautics and Astronautics
482
Genetic Causal approach. Case studies have been presented to test the generic relevance and
validity of the method. A ‘machined part’ example representing out-side production used
both specific design and cost data while a General Supply spigot example used analogy
applied to comparison of sub-cost components. An off-the-shelf Thermal Anti-Icing valve
study relied exclusively on broad contract based information (not specific to the part) with
purchase order value as the dependent variable and performance specifications as the
independent variable. IN particular the latter was shown to be inherently difficult due to
differing suppliers using alternative cost stack up and allocation policies, as well as profit
margins, which makes it difficult to identify causal drivers that affect the cost differentials.
However, once again the Genetic Causal method forces the use of causal cost drivers
(performance related in the latter study) that can be clustered according to the cost family
under consideration, while being facilitated by the Cost CENTRE-ing process. The Cost
CENTRE-ing method uses ‘comparison’ in early data grouping and refinement but is also
the basis of normalization and trend selection. It does this by selecting those drivers with the
smallest measure of random error and which can be linked causally to cost.
The proposed methodology was applied to the three validation studies to show that it is
effective in a wide range of applications (generic), has been used to significantly reduce the
cost of supplied items (accurate), and is being adopted by a leading aerospace manufacturer
(relevant). It is concluded that the proposed Genetic Causal Cost CENTRE-ing methodology
exhibits all the above because it is based on an improved understanding of procurement
operations and supply chain costing; thereby contributing to the body of knowledge in
terms of process understanding; the importance of a causal relations in estimating; and
identifying inheritance and family commonality in groups of products. It is envisaged that
the application can be further developed into a web-based technology that is more
responsive in the identification and control of Lean suppliers who operate within an optimal
cost basis
8. Acknowledgements
The presented work was carried out in collaboration between Queens University Belfast and
Bombardier Aerospace Belfast. The authors were involved in a range of cost modeling
research projects within the Design, Manufacturing and Procurement domains, but the
presented work was carried out as part of a Bombardier/DEL funded ‘Cast Award’ that
resulted in the successful PhD work of Dr. Paul Watson, in association with that Department
of Education and Learning (DEL), NI initiative. Within Bombardier Aerospace Belfast,
acknowledgment and thanks must also be noted for the expert contributions of Mr. Neil
Watson and Mr. Paddy Hawthorne, under the strategic direction of the Director of
Procurement, Mr. Steven Cowan.
9. References
AT Kearney Report, (2004), “Creating value through strategic supply management – 2004
Assessment of Excellence in Procurement”.
Ben-Arieh, D., (2000), “Cost estimation system for machined parts”, International Journal of
Production Research, Vol. 38, No. 17, pp. 4481 – 4494.
An Agile Cost Estimating
Methodology for Aerospace Procurement Operations: Genetic Causal Cost CENTRE-ing
483
Brinke, E.T., (2002), “Costing Support and Cost Control in Manufacturing: A Cost
Estimation Tool applied in the sheet metal domain”, PhD Thesis, Printed by
PrintPartners Ipskamp, Enschede, The Netherlands, ISBN 90-365-1726-5.
Cavalieri, S., Maccarrone, P. and Pinto, R., (2004), “Parametric vs. neural network models for
the estimation of production costs: A case study in the automotive industry”,
International Journal of Production Economics 91, pp. 165 – 177.
Collopy, P.D., (2001), “Aerospace Manufacturing Cost Prediction from a Measure of Part
Definition Information”, Copyright © 2001 Society of Automotive Engineers, InC.
Chen, I.J., and Paulraj, A., (2004), “Understanding supply chain management: critical
research and a theoretical framework”, International Journal of Production
Research, Vol. 42, No. 1, pp. 131 – 163.
Curran, R, Kundu, A., Raghunathan, & Eakin D (2001), “Costing Tools for Decision Making
within Integrated Aerospace Design”, Journal of Concurrent Engineering Research,
9(4), 327-338.
Curran, R, Kundu, AK, Raghunathan, S and R McFadden (2003). “Influence of
Manufacturing Tolerance on Aircraft Direct Operating Cost (DOC)”, Journal of
Materials Processing Technology, Elsevier Science BV, ISSN; 0924-0136, 239-247.
Curran, R., Raghunathan, S. and Price, M., (2004), “Review of aerospace engineering cost
modeling: The genetic causal approach”, Progress in Aerospace Sciences 40, pp. 487
– 534.
Curran, R., and Watson, P., Cowan, S., Hawthorne, P., Watson, N., “Cost CENTRE-ing: A
Procurement Methodology for Cost Reduction within Aerospace”, Proceedings of
Concurrent Engineering Conference, CE2004, Beijing, China, 2004.
Curran, R., Rothwell, A., and Castagne, S., “A Numerical Method for Cost-Weight
Optimization of Stringer-Skin Panels”, Journal of Aircraft, Vol. 43, No. 1, 2006, pp.
264-274.
Curran, R, Gomis, G, Castagne, S, Butterfield, J, Edgar, T, Higgins, C and C McKeever
(2007a), “Integrated Digital Design for Manufacture for Reduced Life Cycle Cost”,
International Journal of Production Economics (IJPE), 27-40.
Curran, R, Castagne, S, Early, J, Price, M, Raghunathan, S, Butterfield J & A. Gibson (2007b)
“Aircraft Cost Modelling using the Genetic Causal Technique within a Systems
Engineering Approach”, The Aeronautical Journal, Royal Aeronautical Society,
409-420.
Curran, R, Castagne, S, Rothwell, A, Price, M, Murphy, A. & Raghunathan, s. (2009).
Uncertainty and sensitivity analysis in aircraft operating costs in structural design
optimization. Journal of aircraft, 46(6), 2145-2155.
Curran, R. (2010), Value Driven Design: Value Integration, Encyclopedia of Aerospace
Engineering, ISBN: 978-0-470-75440-5, Volume 6, Part 31, Chapter 322.
Curran, R, T. Abu-Kias , M.J.F Repco, Y.L.J. Sprengers, P.N.C.S van der Zwet and W.
Beelearts, A (2010a), Value Operations Methodology for Value Driven Design:
Medium Range Passenger Airliner Validation, Proceedings of AIAA General
Meeting, Orlando.
Curran, R., Verhagen, W.J.C., Van Tooren, M.J.L. & Van der Laan, A. (2010b). A
multidisciplinary implementation methodology for knowledge based engineering:
KNOMAD. Expert Systems with Applications, Volume 37, Issue 11, November
2010, Pages 7336-7350
Aeronautics and Astronautics
484
Curran, R., Butterfield, J., Jin, Y., & Burke, R., Collins, R. (2010c), Value Driven Manufacture:
Digital Lean Manufacture, Encyclopedia of Aerospace Engineering, ISBN: 978-0-
470-75440-5, Volume 6, Part 31, Chapter 313.
Dubois, A., (2003), “Strategic cost management across boundaries of firms”, Journal of
Industrial Marketing Management, 32, pp. 365 – 374.
Dulmin, R., and Mininno, V., (2003), “Supplier selection using a multi-criteria decision aid
method”, Journal of Purchasing and Supply Management 9, pp. 177 – 187.
Ellram, L.M., (1996), “A structured method for applying purchasing cost management
tools”, The Journal of Supply Chain Management – A Global Review of Purchasing
and Supply, Volume 32, No.1, pp. 11 – 19.
Ellram, L.M., (2002), “Strategic Cost Management in the Supply Chain: A purchasing and
Supply Management Perspective”, Copyright © 2002 by CAPS Research.
Esawi, A.M.K., and Ashby, M.F.*, “Cost Estimates to Guide Pre-selection of Processes”,
Mechanical Engineering Department, The American University in Cairo,
*Engineering Design Centre, Cambridge University Engineering Department,
January 2003.
Fitzgerald, K.R., (2002), “Best Practices in Procurement”, Ascet Volume 4, Ascet – Achieving
Supply Chain Excellence Through Technology.
Fleming, Q., (2003), “Project procurement management: contracting, subcontracting,
teaming”, Fmc Publisher, ISBN: 0974391204.
Funahashi, K., (1989), “On the approximate realisation of continuous mappings by neural
networks”, Neural Networks, Vol. 2, pp. 183 – 192.
Gerla, G., “Fuzzy Logic, Mathematical Tools for Approximate Reasoning”, Kluwer
Academic Publishers, ISBN 0-7923-6941-6, 2001.
Handfield, R.B., Krause, D.R., Scannell, T.V., and Monczka, R.M., (2002), “Avoid the pitfalls
in Supplier Management”, Sloan Management Review, January 2000.
Hicks, C., McGovern, T., and Earl, C.F., (2000), “Supply chain management: A strategic issue
in engineer to order manufacturing”, International Journal of Production
Economics, Volume 65, Issue 2, 20 April 2000, pp. 179-190.
Hornik, K., Stinchcombe, M., and White, H., (1989), “Multilayer feedforward networks are
universal approximators”, Neural Netwroks, Vol. 2, pp. 359 – 366.
Humphreys, K.K., (1991), “Jelen’s Cost and Optimisation Engineering”, Third Edition,
McGraw Hill Publishers, ISBN 0-07-053646-5, pp. 538.
Idri, A., Khoshgoftaar, T.M. and Abran, A., (2002), “Can neural nets be easily interpreted in
software cost estimation?”, 2002 World Congress on Computational Intelligence,
Honolulu, Hawaii, May 12 – 17.
Kishk, M., and Al-Hajj, A., “An integrated framework for life cycle costings in buildings”,
RICS Research Foundation , ISBN 0-85406-968-2, 1999.
Klir, G.J., and Ruan, D.A., “Fuzzy logic foundations and industrial applications”, Kluwer
Academic Publishers, International Series in Intelligent Technologies, 1996.
Kulmala, H.I., (2004), “Developing cost management in customer-supplier relationships:
three case studies”, Journal of Purchasing and Supply Management 10, pp. 65 – 77.
La Londe, B.J., and Ginter, J.L. (1999), “A Summary of Activity-Based Costing Best Practices,
The Ohio State University’s Supply Chain Management Research Group”, Ohio
State Publications.
An Agile Cost Estimating
Methodology for Aerospace Procurement Operations: Genetic Causal Cost CENTRE-ing
485
Mamdani, E.H., and Gaines, B.R., “Fuzzy reasoning and its applications”, Academic Press,
1981.
Marquez, A. and Blanchar, C., (2004), “The procurement of strategic parts. Analysis of a
portfolio of contracts with suppliers using a system dynamics simulation model”,
International Journal of Production Economics 88, pp. 29 – 49.
Markowitz, H., (1952), “Portfolio Selection”, Journal of Finance 7 (1), pp. 77 – 91.
Momme, J., (2002), “Framework for outsourcing manufacturing: strategic and operational
implications”, Computers in Industry”, Vol. 49, pp. 59 – 75.
Mileham, A.R., (1993), “A Parametric approach to Cost Estimating at the Conceptual Stage
of Design”, Journal of Engineering Design, Volume 4, Part 2, pp. 117 – 125.
Monczka, R. and Morgan, J., (2000), “Competitive supply strategies for the 21st century”
Purchasing, January 13. pp. 48-59.
Olsen, R.F., Ellram, L.M., (1997), “A portfolio approach to supplier relationships”, Industrial
Marketing Management 26, (2), pp. 101 – 113.
ISPE Parametric Estimating Handbook, (1999), “Appendix A – Definitions of Estimating
Terminology”, 2nEdition, International Society of Parametric Analysis.
Probert, D. (1996), “The practical development of a make or buy strategy: The issue of
process positioning”, Integrated Manufacturing Systems, 7 (2), pp. 44-51.
Pugh, P., Faddy, D., & Curran, R. (2010a), Project Management: Cost Analysis, Encyclopedia
of Aerospace Engineering, ISBN: 978-0-470-68665-2, Volume 8, Part 37, Chapter 386.
Pugh, P., Faddy, D., & Curran R. (2010b), Project Management: Cost Forecasting,
Encyclopedia of Aerospace Engineering, ISBN: 978-0-470-68665-2, Volume 8, Part
37, Chapter 387.
Roy, R., (2003), “Cost Engineering: Why, What and How?”, Decision Engineering Report
Series, Cranfield University, ISBN 1-861940-96-3.
Rush, C. and Roy, R., (2000), “Analysis of Cost Estimating Processes used within a
Concurrent Engineering Environment throughout a Product Life Cycle”,
Proceedings of CE2000, Lyon, France, July 17 – 21, pp. 58 – 67.
Scanlan, J.P., (2004), “DATUM (Design Analysis Tool for Unit Cost Modeling): a tool for unit
cost estimation of gas turbine design within Rolls-Royce”, The Cost Engineer, No.
4, November 2004, pp. 8 – 10.
Smith, A.E. and Mason, A.K., (1997), “Cost Estimation Predictive Modelling: Regression
versus Neural Network”, The Engineering Economist, Volume 42, Winter, No. 2,
pp. 137 – 138.
Stewart, R., Wyskidsa, R., Johannes, J., (1995), “Cost Estimator’s Reference Manual”, 2nd
Edition, Wiley Interscience.
Ting, P.,-K., Zhang, C., Wang, B., and Deshmukh, A., “Product and process cost estimation
with fuzzy multi-attribute utility theory”, The Engineering Economist, Volume 44,
Number 4, 1999.
Verhagen, W.J.C., Bermell Garcia, P., Mariot, P., Cotton, J.P., Ruiz, D., Redon, R., Curran, R.,
(2011), "Knowledge-Based Cost Modelling of Composite Wing Structures",
International Journal of Computer Integrated Manufacturing [in press].
Villarreal, J.A.; Lea, R.N. & Savely, R.T., (1992), “Fuzzy logic and neural network
technologies”, 30th Aerospace Sciences Meeting and Exhibit, Houston, Texas,
January 6-9.
Aeronautics and Astronautics
486
Yoon, K., and Naadimuthu, G., (1994), “A make-or-buy decision analysis involving
imprecise data”, International Journal of Operations and Production Management,
14 (2), pp. 62 – 69.
Wang, Q. and Maropoulos, P. G., (2005), “Artificial neural networks as a cost engineering
method in a collaborative manufacturing environment”, Next Generation
Concurrent Engineering © 2005 ISPE Inc., ISBN 0-9768246-0-4, pp. 605 – 610.
Watson, P, Curran, R, Murphy, A and S Cowan, (2006). “Cost Estimation of Machined Parts
within an Aerospace Supply Chain”, Journal Concurrent Engineering, Vol. 14, No.
1, 17-26.
Weustink, I.F., Ten Brinke, E., Streppel, A.H., and Kals, H.J.J., (2000), “A Generic Framework
for Cost Estimation and Cost Control in Product Design”, Laboratory of Production
and Design Engineering, University of Twente, The Netherlands.
17
Developing Risk Models for
Aviation Inspection and Maintenance Tasks
Lee T. Ostrom and Cheryl A. Wilhelmsen
University of Idaho
USA
1. Introduction
Risk assessment has been used to analyze a wide range of industries to determine
vulnerabilities with the ultimate purpose of eliminating the sources of risk or reducing
them to a reasonable level. The purpose of this chapter is to show how risk assessment
tools can be used to develop risk models of aviation maintenance tasks. Two tools will be
discussed in this chapter, though many other methods exist. The tools discussed in this
chapter are:
Failure Mode and Effect Analysis (FMEA)
Event and Fault Tree Analysis
Ostrom and Wilhelmsen (2011) discuss a wide range of risk assessment tools and this book
provides many examples of how these tools are used to analyze various industries.
2. Failure mode and effect analysis
An FMEA is a detailed document that identifies ways in which a process or product can fail
to meet critical requirements. It is a living document that lists all the possible causes of
failure from which a list of items can be generated to determine types of controls or where
changes in the procedures should be made to reduce or mitigate risk. The FMEA also
allows procedure developers to prioritize and track procedure changes (Mil Std 882B, C,
1984 and 1993). The process is effective because it provides a very systematic process for
evaluating a system or a procedure, in this instance. It provides a means for identifying and
documenting:
1. Potential areas of failure in process, system, component, or procedure.
2. Potential effects of the process, system, component, or procedure failing.
3. Potential failure causes.
4. Methods of reducing the probability of failure.
5. Methods of improving the means of detecting the causes of failure.
6. Risk ranking of failures, allowing risk informed decisions by those responsible.
7. A starting point from which the control plan can be created.
FMEA can be used to analyze:
1. Process: Documents and addresses failure modes associated with the manufacturing
and assembly process.
2. Procedure: Documents and addresses failure points and modes in procedures.
Aeronautics and Astronautics
488
3. Software: Documents and addresses failure modes associated with software functions.
4. Design: Documents and addresses failure modes of products and components long
before they are manufactured and should always be completed well in advance of
prototype build.
5. System: Documents and addresses failure modes for system and subsystem level
functions early in the product concept stage.
6. Project: Documents and addresses failures that could happen during a major program.
A procedure analysis will be used to demonstrate how an FMEA can be conducted. An
FMEA is conducted on a step-by-step basis. Table 1 shows an example of an FMEA table.
The following constitutes the steps of an FMEA. These steps will be illustrated by use of an
example.
Item
Potential
Failure
Mode
Cause of
Failure
Possible
Effects
Probability
Criticality
(Optional)
Prevention
Step in
procedure,
part, or
component
How it can
fail:
–pump not
working
–stuck valve
–no money
in a checkin
g
account
–broken wire
–software
error
–system
down
–reactor
melting
down
What
caused the
failure:
Broken part
Electrical
failure
Human
error
Explosion
Bug in
software
Outcome of
the failures:
Nothing
System crash
Explosion
Fire
Accident
Environmental
release
How
possible
is it:
Can use
numeric
values:
0.1, 0.01, or
1E-5
Can use a
qualitative
measure:
Negligible,
low
probability,
high
probability.
How bad are
the results:
Can use
dollar value:
$10., $1,000.,
or $1,000,000
Can use a
qualitative
measure:
Nil, Minimal
problems,
major
problems.
What can
be done to
prevent
either
failures or
results of
the
failures?
Table 1. Example FMEA Table
Developing Risk Model for Aviation Inspection and Maintenance Tasks
489
The first step is to create a flow diagram of the procedure. This is a relatively simple process
in which a table or block diagram is constructed that shows the steps in the procedure.
Table 2 shows the simple steps checking an engine chip detector. Note that this is a simple
example and not an exhaustive analysis. Table 3 lists the major, credible failures associated
with each step in the process. Table 4 shows the effect of the potential failures. Table 5
shows the complete FMEA for the task.
Table 2. Process Steps for checking a chip detector
FMEA is a relatively simple, but powerful tool and has a wide range of applicability for
analyzing aircraft maintenance tasks.
3. Event tree and fault tree analysis
An event tree is a graphical representation of a series of possible events in an accident
sequence (Vesely, William; et. al., 2002). Using this approach assumes that as each event
occurs there are only two outcomes, failure or success. A success ends the accident sequence
and the postulated outcome is either that the accident sequence terminated successfully or
was mitigated successfully. For instance, a fire starts in an engine. This is the initiating
event. Then the automated system closes fuel feed. If the lack of fuel does not extinguish the
fire, the next step is that that the fire suppression system is challenged. If the system
actuates the fire suppression system the fire is suppressed and the event sequence ends. If
the fire suppression system fails the fire is not suppressed then the accident sequence
progresses. Table 6 shows this postulated accident sequence. Figure 1 shows this accident
sequence in an event tree.
Aeronautics and Astronautics
490
As in most of the risk assessment techniques, probabilities can be assigned to the events and
combined using the appropriate Boolean Logic to develop an overall probability for the
various paths in the event. Using our example from above, we will now add probabilities to
the events and show how the probabilities combine for each path. Figure 2 shows the
addition of path probability to the event tree.
Inspecting Chip Detector
Process Steps Major Failures
Cut and Remove Lock Wire from Oil Drain
Plug
No major failures that affect process outcome
Remove Oil Drain Plug No major failures that affect process outcome
Drain Oil No major failures that affect process outcome
Cut and Remove Lock Wire from Chip
Detector
No major failures that affect process outcome
Remove Chip Detector
Improper removal can remove debris from chip
detector and cause false readin
g
. Chip detector
can be damaged if improperly removed.
Examine Chip Detector
Aircraft Maintenance Technician (AMT) fails to
notice debris on chip detector.
Clean Chip Detector AMT fails to properly clean chip detector
Replace Chip Detector AMT fails to properly install chip detector
Lock Wire Chip Detector AMT fails to properly lock wire chip detector
Replace Oil Drain Plug AMT fails to properly install oil drain plug
Lock Wire Oil Drain Plug AMT fails to properly lock oil drain plug
Replace Oil AMT fails to properly replace oil
Table 3. Failures Associated with Each Step
Developing Risk Model for Aviation Inspection and Maintenance Tasks
491
Inspecting Chip Detector
Process Steps Potential Failure Modes Potential Failure Effects
Remove Chip Detector
Improper removal can remove
debris from chip detector and
cause false reading. Chip
detector can be damaged if
improperly removed.
Engine could fail if chips are
not properly detected.
Added cost to replace
damaged chip detector.
Examine Chip Detector
Aircraft Maintenance
Technician (AMT) fails to
notice debris on chip detector.
Engine could fail if chips are
not properly detected.
Clean Chip Detector
AMT fails to properly clean
chip detector
Debris could be placed back
into engine.
Replace Chip Detector
AMT fails to properly install
chip detector
Oil could leak past chip
detector.
Threads of chip detector
could be damaged.
Lock Wire Chip Detector
AMT fails to properly lock
wire chip detector
Chip detector could become
lose and fall out, leading to
loss of engine oil.
Replace Oil Drain Plug
AMT fails to properly install
oil drain plug
Engine oil could leak out.
Oil drain plug could become
damaged.
Lock Wire Oil Drain Plug
AMT fails to properly lock oil
drain plug
Oil drain plug could become
loose and fall out.
Oil drain plug could become
damaged.
Replace Oil
AMT fails to properly replace
oil
Engine could fail.
Table 4. Effect of Potential Failures
Aeronautics and Astronautics
492
Procedure Step
Potential Failure
Mode
Cause of
Failure
Possible Effects Probability Criticality Prevention
Cut and
Remove Lock
Wire from Oil
Drain Plu
g
No ma
j
or
failures that
affect process
outcome
AMT Fails to
Perform Task
Delay in
performing task.
Very Low Not Critical
Ensure AMTs
follow work
schedule
Remove Oil
Drain Plug
No ma
j
or
failures that
affect process
outcome
AMT Fails to
Perform Task
Delay in
performing task.
Very Low Not Critical
Ensure AMTs
follow work
schedule
Drain Oil
No ma
j
or
failures that
affect process
outcome
AMT Fails to
Perform Task
Delay in
performing task.
Very Low Not Critical
Ensure AMTs
follow work
schedule
Cut and
Remove Lock
Wire from Chip
Detector
No ma
j
or
failures that
affect process
outcome
AMT Fails to
Perform Task
Delay in
performing task.
Very Low Not Critical
Ensure AMTs
follow work
schedule
Examine Chip
Detector
AMT fails to
notice debris on
chip detector.
AMT Fails to
Properly
Perform Task
En
g
ine could fail
if chips are not
properly
detected.
Added cost to
replace
damaged chip
detector.
Moderate Critical
Training,
procedures, and
inspection
oversight
Clean Chip
Detector
AMT fails to
properly clean
chip detector
AMT Fails to
Properly
Perform Task
En
g
ine could fail
if chips are not
properly
detected.
Moderate Critical
Trainin
g
,
procedures, and
inspection
oversi
g
ht
Replace Chip
Detector
AMT fails to
properly install
chip detector
AMT Fails to
Properly
Perform Task
Debris could be
placed back into
engine.
Moderate Critical
Trainin
g
,
procedures, and
inspection
oversi
g
ht
Lock Wire Chip
Detector
AMT fails to
properly lock
wire chip
detector
AMT Fails to
Properly
Perform Task
Oil could leak
past chip
detector.
Threads of chip
detector could
be damaged.
Moderate Critical
Training,
procedures, and
inspection
oversight
Replace Oil
Drain Plug
AMT fails to
properly install
oil drain plug
AMT Fails to
Properly
Perform Task
Chip detector
could become
lose and fall out,
leadin
g
to loss of
engine oil.
Moderate Critical
Training,
procedures, and
inspection
oversight
Lock Wire Oil
Drain Plug
AMT fails to
properl
y
lock oil
drain plug
AMT Fails to
Properly
Perform Task
En
g
ine oil could
leak out.
Oil drain plug
could become
damaged.
Moderate Critical
Training,
procedures, and
inspection
oversight
Replace Oil
AMT fails to
properl
y
replace
oil
AMT Fails to
Properly
Perform Task
Oil drain plu
g
could become
loose and fall
out.
Oil drain plug
could become
damaged.
Low Critical
Training,
procedures, and
inspection
oversight
En
g
ine could
fail.
Table 5. Complete FMEA for Chip Detector Task
Developing Risk Model for Aviation Inspection and Maintenance Tasks
493
Fig. 1. Event Tree
Table 6. Accident Sequence
Table 7. Event Sequence with Probabilities