Solar Cells Silicon Wafer Based Technologies Part 6 pot
Bạn đang xem bản rút gọn của tài liệu. Xem và tải ngay bản đầy đủ của tài liệu tại đây (3.2 MB, 25 trang )
Solar Cells – Silicon Wafer-Based Technologies
116
As mentioned above all samples contain a swirl defect. If you look at the pictures produced
by red LED (wavelength 650 nm, figs 6 and 7) this defect is clearly visible.
Fig. 8. Analyses of output local current of the sample no. 1 by usage of focused LED diode
with middle wavelength 560 nm (green LED, T=297 K)
Fig. 9. Analyses of output local current of the sample no. 1 by usage of focused LED diode
with middle wavelength 560 nm (green LED, T=297 K)
Possibilities of Usage LBIC Method for Characterisation of Solar Cells
117
For the green LED diode (middle wavelength 560 nm, figures 8 and 9) the defect is still well
visible, but not as well-marked as for the red colour (middle wavelength 650 nm).
From the principle of photovoltaic effect it is clear that the light with sufficiently long
wavelength passes through the solar cell without generation of photocurrent. With a shorter
wavelength the light is absorbed faster from impact light to solar cell and that is why the
penetration depth is shorter.
The wavelength of red light is the longest for the used light sources; therefore the
penetration depth is the longest. This is proven by well-market visibility of swirl defect
which is the defect made in bulk of material.
Along the way the wavelength of blue light is the shortest and it causes the full loss of
visibility of this defect. This is caused by the absorption of the light near the solar cell
surface where the swirl defect is not taking effect yet.
The wavelength of green color light is between the wavelengths of red and blue color light.
Therefore the green color light penetrates to a deeper depth than the blue color light but not
so deep as the red color light.
The swirl defect for the blue color (wavelength 430 nm, figures. 10 and 11) is almost
invisible.
We may think that the blue color light is not important for LBIC diagnostic because it does
not allow the bulk defect detection. If you look at the figure closely, you can observe a
decreased affectivity of solar cell in the top right-hand corner of solar cell no 3. (the area of
dark gray). These inhomogeneities are due to irregular diffusion during solar cell
manufacturing. By the usage of light of red color spectrum this defect is not possible to
detect. These defects are surface defects. Even the green colour light can make these
inhomogeneities visible, but they can be easily overlooked.
Fig. 10. Analyses of output local current of the sample no. 1 by usage of focused LED diode
with middle wavelength 430 nm (blue LED, T=297 K)
Solar Cells – Silicon Wafer-Based Technologies
118
Fig. 11. Analyses of output local current of the sample no. 3 by usage of focused LED diode
with middle wavelength 430 nm (blue LED, T=297 K)
Fig. 12. Analyses of output local current of the sample no. 3 by usage of focused infrared
laser (830nm, T=297K)
Possibilities of Usage LBIC Method for Characterisation of Solar Cells
119
Among other defects we count scratches and scrapes which are well-marked by all colors
even if they are surface defects. This is due to the damage of solar cell structure by higher
recombination or higher reflection of damaged surface.
We can compare results for sample no. 3 with the figure produced by the infrared laser
M4LA5-30-830 (wavelength 830nm, Fig. 12.). This is the longest wavelength and the
penetration depth is the deepest.
The swirl defect displayed by the infrared laser is the most intensive which is the proof of
the deepest penetration depth. The obtained picture is slightly defocused in comparison
with previous pictures. This is due complicated focusing system of impacting beam because
IR light is not visible. The focusing is performed by a special specimen used for focusing the
IR laser. The big intensity of defect and a little defocused picture produce a partial loss of
information about the surface defect.
2.1 Graphic analyses of LBIC data
The result of solar cell scanning is array of values corresponding to local current response to
impacting light beam. This array of value is depending on AD convertor but mostly the
result is the 12-bit value matrix which is converted to 8 bit (grey tone picture) graphic
output. A value 0 corresponds to the darkest black and value 255 corresponds to the lightest
white. By the changing of the corresponding colour interval we can visualize the defects
which are hidden for graphic analyse and improve the output picture.
Fig. 13. Front and back side of tested monocrystaline silicon solar cell 710B1.
Solar Cells – Silicon Wafer-Based Technologies
120
Fig. 14. Output LBIC scan of sample 710B1 in maximal converted interval measured values
to grey tone colour (T = 298 K, λ
S
= 650 nm)
Fig. 15. Output LBIC scan of sample 710B1 in linear selected interval measured values of
3.71 to 3.91 grey tone colour (T = 298 K,
S
= 650 nm)
Possibilities of Usage LBIC Method for Characterisation of Solar Cells
121
Fig. 16. Output LBIC scan of sample 710B1 in coloured nonlinear selected interval measured
values of 0 to 3.95 grey tone colour (T = 298 K,
S
= 650 nm)
3. Projection of solar cell back side contact to the LBIC image
Thanks to different wavelength of used light illumination we can detect different defect and
structures depending on penetration depth of light photon. However, the experiments have
showed that we can detect structures behind of expected depth like contact bar on the back
side of solar cells. This contact we did not detect using long wavelength (IR-980 nm or red-
630 nm LED) but they were clearly visible using short wave length (green-525 nm, blue-
430 nm or UV-400 nm LED). Nevertheless using long wavelength enable to clearly detect
deep material defects like swirl which are not clearly detectable by UV or blue wavelength
but this wavelength enables to detect surface defect.
Projection of back side contact bar to short wavelength LBIC picture can be explain by
theory of secondary emission of long wavelength light (~1100 nm) which has penetration
depth (~2800m) much more higher then solar cells depth. Incident high energy light is
absorbed in front surface of solar cell and generates electron-hole pair. Part of this carrier
charges are separated and generated photocurrent. Because of small penetration depth of
impacting photon, most of carrier charges generate near surface area. Thank to high
recombination rate on surface a big amount of this carrier charges recombine and emit IR
light. The spectral efficiency of impacting photon wavelength is low so the output primary
photocurrent is low, too, and do not cover the current induced by secondary emitted
photons with energy near silicon band gap and with high spectral efficiency. IR light
incidents on back metal contact are absorbed without generation electron-hole pair. Light
incident to back surface without metallic contact is reflected back and is absorbed inside
substrate volume. This theory was verify by scanning of solar cell illuminated by UV light
(Fig. 18) in IR region (Fig. 19).
Solar Cells – Silicon Wafer-Based Technologies
122
Fig. 17. Projection of back contact bar in LBIC of the sample 57A3 by usage of focused LED
diode with middle wavelength 430 nm (blue LED, T=297 K)
Fig. 18. Theory of projection back side contact during secondary emission of long
wavelength light.
a) front side surface, b) back side surface, c) metallic contact on back side, d) short
wavelength light e) emitted long wavelength light.
Possibilities of Usage LBIC Method for Characterisation of Solar Cells
123
Fig. 19. Photoluminescence of solar cell 24B3 illuminated by UV-400 nm light, scan through
blue filter (380- 460nm) – no strong luminescence.
Fig. 20. Photoluminescence of solar cell 24B3 illuminated by UV-400 nm light, scanned
through IR filter (742 nm and more) - measurable luminescence.
4. Conclusion
The measurement of solar cells using the LBIC method makes possible to most type of
defect detection. Various wavelengths of light were used to spot different defects at different
depths under the surface of silicon solar cells. This chapter presents the LBIC analysis of set
silicon solar cells prepared up-to-date technique. The measurements have demonstrated a
strong dependence of LBIC characteristics on the used light source wavelength.
Solar Cells – Silicon Wafer-Based Technologies
124
Even better results could be achieved by using LASERs instead of focused LED diodes. The
problem of using LED diodes is the weak intensity of light beam connected with low
photocurrent and superposition with surrounding noise.
5. Acknowledgement
This research and work has been supported by the project of CZ.1.05/2.1.00/01.0014 and by
the project FEKT-S-11-7.
6. References
Vasicek, T. Diploma theses, 2004, Brno University of Technology, Brno
Pek, I. Diploma theses , 2005, Brno University of Technology, Brno
Intel, Photodetectors, On-line :
volume08issue02/ art06_siliconphoto/p05_photodetectors.htm, Citeted 2004
Vanek, J., Brzokoupil, V., Vasicek, T., Kazelle, J., Chobola, Z., Barinka, R. The Comparison
between Noise Spectroscopy and LBIC In The 11th Electronic Devices and Systems
Conference. The 11th Electronic Devices and Systems Conference. Brno: MSD, 2004, s.
454 - 457, ISBN 80-214-2701-9
Vaněk, J., Kazelle, J., Brzokoupil, V., Vašíček, T., Chobola, Z., Bařinka, R. The Comparison of
LBIC Method with Noise Spectroscopy. Photovoltaic Devices. Kranjska Gora,
Slovenia, PV-NET. 2004. p. 60 - 60.
Vaněk, J.; Chobola, Z.; Vašíček, T.; Kazelle, J. The LBIC method appended to noise
spectroscopy II. In Twentieth Eur. Photovoltaic SolarEnergy Conf. Barcelona, Spain,
WIP-Renewable Energies. 2005. p. 1287 - 1290. ISBN 3-936338-19-1.
Vaněk, J., Kazelle, J., Bařinka, R. Lbic method with different wavelength of light source. In
IMAPS CS International Conference 2005. Brno, MSD s.r.o. 2005. p. 232 - 236. ISBN 80-
214-2990-9.
Vaněk, J., Kubíčková, K., Bařinka, R. Properties of solar cells by low an very low
illumanation intensity. In IMAPS CS International Conference 2005. Brno, MSD s.r.o.
2005. p. 237 - 241. ISBN 80-214-2990-9.
Vaněk, J., Boušek, J., Kazelle, J., Bařinka, R. Different Wavelenghts of light source used in
LBIC. In 21st European Photovoltaic Solar Energy Conference. Dresden, Germeny, WIP-
Renewable Energies. 2006. p. 324 - 327. ISBN 3-936338-20-5.
Vaněk, J.; Fořt, T.; Jandová, K. Solar cell back side contact projection to the front side lbic
image. In 8th ABA Advanced Batteries and Accumulators. Brno, TIMEART agency.
2007. p. 253 - 255. ISBN 978-80-214-3424-0.
Vaněk, J.; Fořt, T.; Jandová, K.; Bařinka, R. Projection fo solar cell back side contact to the
LBIC image. In EDS'07. Brno, TIMEART agency. 2007. p. 253 - 255. ISBN 978-80-
214-3470-7.
Vaněk, J.; Dolenský, J.; Jandová, K.; Kazelle, J. Dynamic light beam induced voltage testing
method of solar cell. In EDS ´08 IMAPS Cs International Conference Proceedings. Brno,
Vysoké učení technické v Brně. 2008. p. 153 - 156. ISBN 978-80-214-3717-3.
Vaněk, J.; Jandová, K.; Kazelle, J.; Bařinka, R.; Poruba, A. Secondary photocurrent, current
generated from secondary emitted photons. In 23rd European Photovoltaic Solar
Energy Conference, 1-5 September 2008, Valencia, Spain. 2008. p. 323 - 325. ISBN 3-
936338-24-8.
B. Erik Ydstie and Juan Du
Carnegie Mellon University
USA
1. Introduction
The accumulated world solar cell capacity was 2.54 GW in 2006, 89.9% based on mono- or
multi-crystalline silicon wafer technology, 7.4% thin film silicon, and 2.6% direct wafering
(Neuhaus & Münzer, 2007). The rapidly expanding market and high cost of silicon
led to the development of thin-film technologies such as the Cadmium Telluride (CdTe),
Copper-Indium-Gallium Selenide (CIGS), Dye Sensitized Solar Cells, amorphous Si on steel
and many other. The market share for thin-film technology jumped to nearly 20% of the total
7.7 GW of solar cells production in 2009 (Cavallaro, 2010).
There are more than 25 types of solar cells and modules in current use (Green & Emery,
1993). Technology based on mono-crystalline and multi-crystalline silicon wafers presently
dominate and will probably continue to dominate since raw material availability is not a
problem given that silicon is abundant and cheap. Solar cells based on rare-earth metals pose
a challenge since the cost of the raw materials tend to fluctuate and availability is limited.
However the cost of silicon solar cells and the raw material, solar grade poly-silicon is too
high and this technology will be displaced unless cost effective alternatives are found to make
silicon solar cells.
Figure 1 shows the approximate distributions for the different costs in producing a silicon
based solar module (Muller et al., 2006). The figure shows where there is significant incentive
to reduce costs. The areas of solar grade silicon (SOG) production and wafer manufacture
stand out. These processes are presently not well optimized and many opportunities exist
to improve the manufacturing technology through process innovation, retro-fit, optimization
and process control.
Poly-silicon, the feedstock for the semiconductor and photovoltaic industries, was in short
supply during the beginning of the last decade due to the expansion of the photovoltaic
(PV) industry and limited recovery of reject silicon from the semiconductor industry. The
relative market share of silicon for the electronic and solar industries is depicted in Figure 2.
This figure shows the growing importance of the the solar cell industry in the poly-silicon
market. Take last year as an example, a total amount of 170,000 metric tons of poly-silicon
was produced and 85% was consumed by solar industry while only 15% was consumed by
the semiconductor industry. This represents a complete reversal of the situation less than two
decades ago. During the last decade, the total PV industry demand for feedstock grew by
more than 20% annually. The forecasted growth rate for the next decade is a conservative 15%
per year. The available silicon capacities for both semiconductor and PV industry are limited
to 220,000 metric tons for the time being.
Producing Poly-Silicon from Silane
in a Fluidized Bed Reactor
7
2 Will-be-set-by-IN-TECH
Fig. 1. The cost distribution of a silicon solar module.
Fig. 2. Poly-Silicon Production and consumption for Electronic and PV Industries (Fishman,
2008).
Fig. 3. The supply chain for solar cell modules.
Six companies supplied most of the poly-silicon consumed worldwide in the year of 2000,
namely, REC Silicon, Hemlock Semi-Conductor, Wacker, MEMC, Tokuyama and Mitsubishi
(Goetzberger et al., 2002). Those companies still cover most of the world wide production
capacity and produced over 75% of the poly-silicon in 2010.
2. Solar grade poly-silicon production
Figure 3 illustrates the typical silicon solar cell production. The supply chain starts with the
carbothermic reduction of silicates in an electric arc furnace. In this process large amounts
of electrical energy breaks the silicon-oxygen bond in the SiO
2
via the endothermic reaction
with carbon. Molten Si-metal with entrained impurities is withdrawn from the bottom of the
furnace while CO
2
and fine SiO
2
particles escape with the flu-gas (Muller et al., 2006).
126
Solar Cells – Silicon Wafer-Based Technologies
Producing Poly-Silicon From Silane
in a Fluidized Bed Reactor 3
Fig. 4. Silicon based Solar Cell Production Process.
Fig. 5. The production of highly pure TCS from MG-Si.
Metallurgical grade silicon (MG-Si) at about 98.5-99.5% purity is sold to many different
markets. The majority of MG-Si is used for silicones and aluminum alloys (Surek,
2005). A much smaller portion is for fumed silica, medical and cosmetic products and
micro-electronics. A small but rapidly growing proportion is used for solar applications.
Metallurgical silicon is converted to high-purity poly-silicon through two distinct routes. In
the metallurgical route the silicon is purified through a combination of steps targeted at
different impurities (Muller et al., 2010). Leaching with calcium based slags may remove
some impurities whereas directional solidification takes advantage of the high liquid-solid
segregation coefficient of metallic impurities and leaching eliminates metallic silicides in the
grain boundaries. One bottleneck of this process is low purity and yield relative to the
chemical route. Only a small percentage of the current market is based on this approach
(Fishman, 2008).
High purity poly-silicon suitable for solar cells and micro-electronics can also be produced by
a chemical route which typically proceeds in two steps. In the first step MG-Si reacts with HCl
to form a range of chlorosilanes, including tri-chlorosilane (TCS). TCS has a normal boiling
point of 31.8
o
C so that it can be purified by distillation. One process alternative for producing
TCS is shown in Figure 5. Poly-silicon is then produced in the same manufacturing facility
by pyrolysis of TCS in reactors that are commonly referred to as Bell or Siemens reactors (del
Coso et al., 2007). In the Bell reactor TCS passes over high purity silicon starter rods which are
127
Producing Poly-Silicon from Silane in a Fluidized Bed Reactor
4 Will-be-set-by-IN-TECH
heated to about 1150
o
C by electrical resistance heating. The gas decomposes as
2HSiCl
3
→ Si + 2HCl + SiCl
4
Silicon deposits on the silicon rods as in a chemical vapor deposition process.
9N(99.999999999%) silicon is used for micro-electronics applications. Silicon which is 6N or
better is called solar grade silicon (SOG-Si) and it can be used to produce high quality solar
cells (Talalaev, 2009).
The free space reactor provides an alternative to the Siemens reactor. It has lower capital and
operating cost. However, its disadvantage is that it is difficult to regulate the melting process
to generate ingots and wafers. This process has not been used industrially on a large scale yet
(Fishman, 2008).
The annual price for solar grade silicon went through a very sharp maximum in 2008 due
to high demand and limited poly-silicon production capacity. The increase in price was
expected (Woditsch & Koch, 2002) and led to a similar increase in the cost of wafers. The
price of solar grade silicon is expected to stabilize in the coming decade as new technologies
are introduced and capacity is added to the supply chain: The classical TCS process was
designed for micro-electronics manufacture where silicon cost is not as critical as in the solar
cell industry. Some companies have retro-fitted their processes to produce solar rather than
micro-electronics grade silicon. The pyrolysis process has been made suitable for high volume
production of poly-silicon; reactive separation and complex instead of simple distillation has
been proposed to reduce energy requirements; and fluid bed reactor technology is set to
replace the Bell reactors during the next decade. Finally, progress has been made in making
solar grade silicon directly using metallurgical routes. All attempts have not been as successful
as was hoped for yet. Nevertheless, it is very likely that solar grade silicon prices can be
reduced to $25-30 per kg in the next decade if the tempo of industry expansion is maintained
(Neuhaus & Münzer, 2007).
3. Fluidized bed reactor
Fluidized bed reactors have excellent heat and mass transfer characteristics and can be utilized
for Silane decomposition to overcome the energy waste problem in Siemens process. The
energy consumption is reduced because the decomposition operates at a lower temperature
and cooling devices are not required. In addition fluidized beds have high throughput rate
and operate continuously reducing further capital and operating costs. The final product
consist of small granules of high purity silicon that are easy to handle compared to powder
produced by free space reactor (Odden et al., 2005).
In the fluidized bed reactor (Kunii & Levenspiel, 1991), the reactive gas is introduced into
the reactor together with preheated fluidizing gases, such as hydrogen or helium. Heat for
the thermal decomposition is supplied by external heating equipment. Pyrolysis of silicon
containing gas produces silicon deposition on seed particles, the subsequent particle growth
is due to heterogeneous chemical vapor deposition as well as scavenging of homogeneous
silicon nuclei. This results in a high deposition rate by a combination of heterogeneous and
homogeneous decomposition reactions. As the silicon seed particles grow, the larger particles
move to the lower part of the bed and are removed as a final product. The continuous removal
of silicon seed particles after they have grown to the desired size leads to depletion of particles
and it is necessary to introduce additional silicon seed particles into the fluidized bed to
replace those removed final product (Würfel, 2005).
Two techniques are used to provide a continuous supply of pure silicon seed particles to
the fluidized bed reactor. One technique uses a hammer mill or roller crushers to reduce
128
Solar Cells – Silicon Wafer-Based Technologies
Producing Poly-Silicon From Silane
in a Fluidized Bed Reactor 5
Fig. 6. Fluidized bed reactor with seed generator.
the bulk silicon to a specific particle size distribution suitable for use as seed particles.
However, this technique is expensive and causes severe contamination problems. Moreover,
the crushing results in a non-spherical seed particle which presents an undesired surface
for silicon deposition. The other technique for producing silicon seed particles involves the
recycling small particles generated in and removed from the fluidized bed (Odden et al., 2005).
In the fluidized bed, the majority of silicon produced during thermal decomposition
undergoes heterogeneous deposition on the surface of the seed while a certain amount of
silicon is formed homogeneously as gas dust recycled back into the reactor as seed particles
(Caussat et al., 1995a). However, those amount of silicon is not sufficient to meet the entire
demand for new seed particles. The combination of the recycled homogeneous particles and
seed particles produced by crushing (Kojima & Morisawa, 1991) can provide an effective
means of re seeding. More importantly, these homogeneously formed particles are amorphous
such that they do not provide desirable surface for deposition neither.
A novel seed generator for continuously supplying silicon seed particles solves the above
problems (Hsu et al., 1982). This seed generator produces precursor silicon seed via thermal
decomposition of silicon containing gas. This device generates uniformly shaped seed
particles with desirable fluidization characteristics and silicon deposition. The scheme of
silicon production process is illustrated in Figure 6. It comprises a primary fluidized bed
reactor and a silicon seed generator. The seed particles are introduced into the primary
fluidized bed reactor through seed particle inlet (Steinbach et al., 2002).
4. Silane pyrolysis in fluidized beds
Hogness et al. (Hogness et al., 1936) was one of the earliest to undertake a series of
experiments to study the thermal decomposition of silane. They concluded that the
reaction was homogeneous and first order. The hydrogen acted as an inhibitor for the
decomposition and no reactions between hydrogen and silicon to form silane was observed.
Zambov (Zambov, 1992) investigated the kinetics of homogeneous decomposition of silane
and their experimental results showed that homogeneous and heterogeneous pyrolysis
coexisted. Furthermore they developed a mathematical model to demonstrate that the ratio of
129
Producing Poly-Silicon from Silane in a Fluidized Bed Reactor
6 Will-be-set-by-IN-TECH
homogeneous decomposition to heterogeneous deposition grew with increasing temperature
and pressure and thus resulted in a substantial degradation of the layer thickness uniformity.
A suitable model for silane pyrolysis was developed by Lai et al. (Lai et al., 1986) to
describe different reaction mechanisms in fluidized bed reactors. They assumed that silane
decomposed by heterogeneous and homogeneous decomposition, and occurred via seven
pathways as following:
1. Chemical vapor deposition on silicon particles (heterogeneous deposition);
2. Chemical vapor deposition on fines (heterogeneous deposition);
3. Homogeneous decomposition to form Silicon vapor;
4. Coalescence of formation of fines;
5. Diffusion-aided growth of fines;
6. Growth of fines by coagulation;
7. Scavenging of fines by particles;
Heterogeneous decomposition of silane on the existing silicon seed particles (pathway 1) or
on the formed nuclei (pathway 2) lead to a chemical vapor deposition of silicon. The reaction
rate was described by first order form published by Iya et al. (Iya et al., 1982).
Homogeneous decomposition forms a gaseous precursor (pathway 3) that nucleate a new
solid phase of silicon, which is called silicon vapor. The concentration of vapor given by
Hogness (Hogness et al., 1936) and Caussat (Caussat et al., 1995b) was always negligible as
they can be suppressed by diffusion aided growth and coalescence of fines.
By pathway 4 nucleation of critical size nuclei, occurs whenever supersaturation is exceeded.
The concentration of silicon vapor can be suppressed by diffusion and condensation on large
particles (pathway 5). We assume here that nucleation occurs by the homogeneous nucleation
theory. The molecular bombardment rate of small particles (pathway 4) is calculated by the
classical expression of kinetic theory while the diffusion rate to large particles (pathway 6)
is readily obtained from film theory of mass transfer. The coagulation rate of the fines in
pathway 6 was determined by the coagulation coefficient which only depend on the average
size of the fines. Scavenging rate was also proportional to a scavenging coefficient depending
on the size of particles. Those seven pathways are widely used in practice to describe the
reaction mechanism to produce silicon from silane.
Two significant problems exist for industrial practice: fines formation and particle
agglomeration (Cadoret et al., 2007). For the problem of fines formation, their experimental
study showed that for the inlet concentration of the reactive gas less than 20%, silane
conversion was quite complete and fines formation limited. The fines ratio never exceeded
3% regardless of inlet concentration of silane. This encouraging result demonstrated that
silicon chemical vapor deposition on powders in a fluidized bed was possible and efficient.
The other new observation that chemical reactions of gaseous species on cold surfaces was
the cause of fines formation was in complete contradiction with previous works (Hsu et al.,
1982) (Lai et al., 1986), for which fines were formed homogeneously in fluidized bed. As to
the problem of particle agglomeration, they observed that the presence of silane in the reactor
could modify particle cohesiveness. The more plausible explanation for this modification was
the reactive species adsorbed on particle surfaces could act as a glue for solids (Caussat et al.,
1995a).
130
Solar Cells – Silicon Wafer-Based Technologies
Producing Poly-Silicon From Silane
in a Fluidized Bed Reactor 7
Fig. 7. Reaction pathways for conversion of silane to silicon. (Lai et al., 1986)
5. Computational fluid dynamics modeling
Computational fluid dynamics offers a powerful approach to understanding the complex
phenomena that occur between the gas phase and the particles in the fluidized bed. The
Lagrangian and Eulerian models have been developed to describe the hydrodynamics of
gas solid flows for the multiphase systems (Piña et al., 2006). The Lagrangian model solves
the Newtonian equations of motion for each individual particle in the gas solid system.
However the large number of equations cause computational difficulties to simulate industrial
fluidize beds reactors. The Eulerian model treats all different phases as continuous and
fully interpenetrating. Generalized Navier-Stokes equations are employed for the interacting
phases.
Constitutive equations are necessary to close the governing relations and describe the
dynamics of the solid phase. To model solid particles as a separated phase, granular theory
is employed to determine its physical parameters. The highly reduced number of equations
in the Eulerian model needs much less effort to solve in comparison to the Lagrangian model.
Modeling the hydrodynamics of gas-solid multiphase systems with Eulerian models has
shown a promising approach for fluidized bed reactors.
Commercial software has been used to solve the models mentioned above. FEMLAB solves
the partial differential equations by simulating fluidized bed reactors (Balaji et al., 2010). The
simulations account for dynamic transport and hydrodynamic phenomena. Mahecha-Botero
et al. (Mahecha-Botero et al., 2005) presented a generalized dynamic model to simulate
complex fluidized bed catalytic systems. The model describes a broad range of multi-phase
catalytic systems subject to mass and energy transfer among different phases, changes in
the molar/volumetric flow due to the reactions and different hydrodynamic flow regimes.
The generalized model (Mahecha-Botero et al., 2006) dealt with anisotropic mass diffusion
and heat conduction and was used for different flow regimes which included bubble phase,
emulsion phase and freeboard. The model was applied to simulate an oxychlorination
fluidized bed reactor for the production of ethylene dichloride from ethylene. An exchange
term was introduced to simulate the fluidized bed reactor as interpenetrating continua,
composed of two interacting phases. The numerical results were very similar to those of Abba
et al. (Abba et al., 2002) and gave good agreement with industrial reactor measured results.
131
Producing Poly-Silicon from Silane in a Fluidized Bed Reactor
8 Will-be-set-by-IN-TECH
Guenther et al. (Guenther et al., 2001) presented an althernative method for simulating
fluidized bed reactors using the computational codes MFIX (Multiphase Flow with Interphase
eXchanges) developed at the US Department of Energy National Energy Technology
Laboratory. Three-dimensional simulations of silane pyrolysis were carried out by using
MFIX. The reaction chemistry was described by the homogeneous and heterogeneous
reactions described above. The results showed excellent agreement with experimental
measurements and demonstrated that these methods can predict qualitatively the dynamical
behavior of fluidized bed reactors for silane pyrolysis. Caussat et al. (Cadoret et al., 2007)
used MFIX for transient simulations for silicon fluidized bed chemical vapor deposition from
silane on coarse powders. The three-dimensional simulations provided better results than
two-dimension simulations. The model predicts the temporal and spatial evolutions of local
void fractions, gas and particle velocities and silicon deposition rate.
White et al. (White, 2007) used FLUENT to capture the dynamics of gas flow through a bed
of particles with one constant average size. The inputs to FLUENT were reactor geometry,
gas flow rates and temperature, heater duty, particle hold-up and average size. The CFD
calculations predicted the bed properties such as the overall bed density and the temperature
as functions of height. This study formed the basis for a multi-scale model for silane pyrolysis
in FBR (Du et al., 2009)
6. The dynamics of particulate phase
Fluidized bed reactor dynamics are characterized by the production, growth and decay of
particles contained in a continuous phase. Such dynamics can be found everywhere in
the chemical engineering field, such as crystallization, granulation and fluidized bed vapor
decomposition. Particularly for the solar grade silicon production process in a fluidized
bed, the particles grow with heterogeneous chemical vapor deposition and homogeneous
decomposition. White et al. (White et al., 2006) developed a dynamical model to represent the
size distribution for silicon particles growth. The idea for the model development is based on
classical population balance proposed by Hulburt and Katz (Hulburt & Katz, 1964). Hulburt
et al. used the theory of statistical mechanics to develop an infinite dimensional phase space
description of the particle behavior. The resulting balance equations express the conservation
of probability in the phase space. A set of integro-partial differential equations are generated if
the population balance is incorporated with mass balance for the continuous phase. However
it requires significant computational efforts to solve those equations. Moment transformation
and discretization are two commonly used methods to solve those equations. Randolph
and Larson (Randolph & Larson, 1971) proposed the use of moment transformation while
Clough (Cooper & Clough, 1985) used orthogonal collocation. Hounslow (Hounslow, 1990)
and Henson et al. (Henson, 2003) employed various discretization techniques to solve them.
Du et al. (Du et al., 2009) reduced the continuous population balance to finite dimensional
space by discretizing the size of particles into a finite number of size intervals. In each size
interval, both mass balance and number balance are established and the discrete population
balance is obtained by comparing those two balance equations. This approach ensures
that conservation laws are maintained at all discretization levels and facilitates computation
without additional discretization.
Figure 8 illustrates the modeling approach developed by White et al. and how it describes
how particles change as a function of time. In this method particles are distributed among N
discrete size intervals, characterized by an average mass m
i
for i = 1, , N. The relationship
between the total mass of particles (M
i
) in an interval and the number of particles in each
132
Solar Cells – Silicon Wafer-Based Technologies
Producing Poly-Silicon From Silane
in a Fluidized Bed Reactor 9
Fig. 8. The network representation of population balance
interval (n
i
) is thereby given by the expression
M
i
= m
i
n
i
. (1)
The mass balance for size interval i is written
dM
i
dt
= q
i
+ r
i
+ f
i−1
− f
i
+ f
a
i
(2)
The rate of addition of particles to interval i from the environment is q
in
i
while particle
withdrawal is q
out
i
, so the total external flow of particles is represented by
q
i
= q
in
i
− q
out
i
.
The rate of material transfer from the fluid phase to the particle is represented by r
i
. The term,
f
a
i
represents the rate of change due to agglomeration, breakage or nucleation. The value can
be expressed so that
f
a
i
= f
a,in
i
− f
a,out
i
,
where f
a,in
i
represents particle transition to interval i due to agglomeration or nucleation, and
f
a,out
i
represents particle transition out of an interval due to breakage or agglomeration. These
terms are often referred to as birth and death in the population balance literature. Finally, the
rate of transition of particles from one size interval to the next, caused by particle growth, is
represented by f
i−1
for flow into interval i and f
i
for flow out of interval i. By connecting
several of these balances together we get the network description of the particulate system
illustrated in Figure 8. The model was validated by experimental data from pilot plant tests (?)
and it was used for pilot plant design and scale-up. It also was used for further development
of control strategies and study of dynamical stability of particles’ behavior in fluidization
processes.
133
Producing Poly-Silicon from Silane in a Fluidized Bed Reactor
10 Will-be-set-by-IN-TECH
7. Multi-scale modeling
Du et al. (Du et al., 2009) proposed a multi-scale approach for accurate modeling of the
entire process. The hydrodynamics were modeled using CFD, which provides a basis
for a simplified reactor flow model. The kinetic terms and the reactor temperature and
concentrations are expressed as functions of reactor dimensions, void volume and time in
the CFD module. Reactor temperature and concentration from the CFD module provides
inputs to the CVD module. The CVD module calculates the overall process yield which
provided an input to the population balance module. The average particle diameter is then
calculated by population balance module and imported into the CFD module to complete
model integration. In continuation of the above mentioned works by White et al. (White
et al., 2007), Balaji et al. (Balaji et al., 2010) presented the complete multi-scale modeling
approach including the effect of computational fluid dynamics along with population balance
and chemical vapor deposition models. For the first time in the field of silicon production
using fluidized beds, they coupled all the effects pertaining to the system (using partial
differential equations (CFD), ordinary differential equations (PBM) and algebraic equations
(CVD)) and they solved the resulting nonlinear partial differential algebraic equations with a
computationally efficient and inexpensive solution methodology.
In order to verify the multi-scale model, we compare the numerical results with experimental
data. The relationship between particle flow rates and average particle size at steady state is
derived as (White, 2007),
1
+
P
S
=
n
p
n
s
(
D
ap
D
as
)
3
(3)
where P is the product withdraw flow rate and S is the seed addition rate. D
ap
is the average
particle diameter of product and D
as
is the average particle diameter of seed. n
p
is the number
of particles being removed and n
s
is the number of particles being added.
If ln
(
1 + P/S
)
=
ln
n
p
/n
s
+ 3ln
D
ap
/D
as
holds true, then it implies that n
p
/n
s
= 1,
which means no nucleation, agglomeration, or breakage is present. On the other hand
n
p
/n
s
< 1 indicates that particle agglomeration takes place in the reactor and n
p
/n
s
> 1
means that particle breakage occurs in the pilot plant. The dashed lines in Figure 9 represent
the analytical expression. The numerical results in Figure 9 agree with both analytical solution
and experimental results which supports that the multi-scale model can be used for further
control studies.
8. Operation and control
Bed temperature is one key factor for the deposition rate and the quality of the deposition.
Inlet silane concentration also affect the deposition rate as well as fines formation and
agglomeration. The fluidization mode is determined by a gas velocity ratio between
superficial gas velocity u and minimum fluidization velocity u
mf
. All these variables must
be coordinated in a multi-variables process control strategy.
A careful selection of the fluidization velocity and silane concentration in the feed limit fines
formation and agglomeration. In order to avoid slugging and poor gas-solid contact we adjust
fluidization velocity or the ratio bed height to bed diameter during reactor design. Usually
hydrogen is used as fluidization gas as it is able to decrease the formation of fines compared
to other inert gas such as nitrogen.
Hsu et al. (Hsu et al., 1987) proposed that the optimal bed temperature for fluidized bed
reactor is 600
− 700
o
C and gas velocity ratio is between 3 and 5. Within this range, fines
elutriation percentage is generally under 10% of the mass of Si in the silane feed. The
maximum fine formation is 9.5% at the inlet silane concentration of 57%, no excessive fines
134
Solar Cells – Silicon Wafer-Based Technologies
Producing Poly-Silicon From Silane
in a Fluidized Bed Reactor 11
Fig. 9. Model Validation.
are generated with increasing silane concentration from 57% to 100%. Kojima et al. (Kojima &
Morisawa, 1991) recommended the following operating conditions: bed temperature is 600
o
C,
gas velocity ratio is 4 and inlet silane concentration is 43%. For both groups, the recommended
seed particle size is between 0.15 and 0.3 mel imeter.
While considerable research effort has been devoted to understanding of the reaction
mechanisms and model development for fluidized bed reactors, not much attention has been
paid to the study of control technology for the silicon production process. Since this system
is complex and typically have limited availability of measurements, complicated control
strategies are not suitable to be implemented in the practice. Inventory control (Farschman
et al., 1998) is a simple method for control of complex systems and thus has potential for
industrial application. It distinguishes itself from other control methods in that it addresses
the question of measurement and manipulated variables’ selections. We apply inventory
control strategy to control particle size distribution by manipulating the total mass of the
particles.
The objective of our inventory control system is to control the average particle size in the
fluidized bed reactor. We manipulate the seed and product flow rates to achieve the control
objective. An inventory control strategy for the total mass hold-up of particles is written as:
dM
dt
= −K(M − M
∗
) (4)
where K is the proportional control gain. M is the total mass hold up and M
∗
is the desired
hold up. The mass balance of the solid phase is expressed as:
dM
dt
= S + Y − P (5)
where S is the seed addition flow rate, Y is the silicon production rate and P is the product
removal rate. The product flow rate can be manipulated to keep the total mass hold-up to a
desired value M
∗
by using the following control action:
P
= S + Y + K(M − M
∗
) (6)
135
Producing Poly-Silicon from Silane in a Fluidized Bed Reactor
12 Will-be-set-by-IN-TECH
(a) Control total and seed hold up in FBR (b) Particle size using inventory control
Furthermore we apply inventory control to maintain the seed hold up to a desired value and
the control action is in the form of
S = −
N
s
∑
i=1
Y
i
− K
s
N
s
∑
i=1
M
i
− M
∗
seed
(7)
where N
s
is the total number of size intervals for the particle seeds and Y
i
is the silicon
production rate in the seed size intervals, K
s
is the proportional gain.
Simulation of controlling the total and seed particle hold-up is shown in Figures 10(a) and
10(b). The hold-up of particles in the system is shown in Figure 10(a). The product and seed
flow rates required to achieve the control are also shown. The first steady state (SS1) represents
operation when M
∗
total
= 75 and M
∗
seed
= 15. The subsequent steady states are achieved
when M
∗
seed
is increased to 20 and 25. The average particle size and size distribution achieved
during each steady state are shown in Figure 10(b). This simulation shows we can control
the average product size as well as the product distribution. As the hold up of seed particles
increases relative to the total hold up, the average size decreases. The interval representation
of the size distribution supports this result. In this simulation, we assumed that the largest
seed size interval, N
s
, was interval 10 out of 20 and that the distribution of seed particles
flowing into the system was constant.
9. Conclusions
This chapter reviewed the past and current work for modeling and operation of fluidized
bed reactor processes for producing solar grade poly-silicon. Currently the shortage of
low-cost solar grade silicon is one major factor preventing environmentally friendly solar
energy from becoming important in the energy market. Energy consumption is the main
cost driver for poly-silicon production process which is highly energy intensive. Fluidized
bed reactors serve as an alternative to the Siemens process which dominates the solar grade
silicon market. Several companies have attempted to commercialize the fluidized bed reactor
process and the process has been scaled up to commercial scale. It has been shown that
FBR technology produces poly-silicon at acceptable purity levels and an acceptable price.
Extensive research has been carried out to study the chemical kinetics of silane pyrolysis and
to model the fluid dynamics in the fluidized beds. The particle growth process due to silicon
deposition is captured by discretized population balances which uses ordinary differential
and algebraic equations to simulate the distribution function for the particles change as a
function of time and operating conditions. A multi-scale modeling approach was applied to
couple the population balance with computational fluid dynamics model and reaction model
to represented the whole process. The model has been validated with experimental data from
136
Solar Cells – Silicon Wafer-Based Technologies
Producing Poly-Silicon From Silane
in a Fluidized Bed Reactor 13
pilot plant tests. An inventory based control is applied to control the total mass hold up of the
solid phase and the simulation results demonstrate that such simple control strategy can be
used to control the average particle size.
10. References
Abba, A., I., R. Grace, J. & T. Bi, H. (2002). Variable-gas-density fluidized bed reactor model
for catalytic processes, Chemical engineering science 57(22-23): 4797–4807.
Balaji, S., Du, J., White, C. & Ydstie, B. (2010). Multi-scale modeling and control of fluidized
beds for the production of solar grade silicon, Powder Technology 199(1): 23–31.
Cadoret, L., Reuge, N., Pannala, S., Syamlal, M., Coufort, C. & Caussat, B. (2007). Silicon cvd
on powders in fluidized bed: Experimental and multifluid eulerian modelling study,
Surface and Coatings Technology 201(22-23): 8919–8923.
Caussat, B., Hemati, M. & Couderc, J. (1995a). Silicon deposition from silane or disilane in a
fluidized bed–part ii: Theoretical analysis and modeling, Chemical engineering science
50(22): 3625–3635.
Caussat, B., Hemati, M. & Couderc, J. (1995b). Silicon deposition from silane or disilane in a
fluidized bed–part ii: Theoretical analysis and modeling, Chemical engineering science
50(22): 3625–3635.
Cavallaro, F. (2010). A comparative assessment of thin-film photovoltaic production processes
using the electre iii method, Energy Policy 38(1): 463–474.
Cooper, D. & Clough, D. (1985). Experimental tracking of particle-size distribution in a
fluidized bed, Powder technology 44(2): 169–177.
del Coso, G., del Canizo, C., Tobias, I. & Luque, A. (2007). Increase on siemens reactor
throughput by tailoring temperature profile of polysilicon rods, Electron Devices, 2007
Spanish Conference on, IEEE, pp. 25–28.
Du, J., Balaji, S. & Ydstie, B. E. (2009). Multi-scale modeling and inventory control of particle
growth processes, 9th International Symposium on Dynamics and Control of Process
Systems.
Farschman, C., Viswanath, K. & Erik Ydstie, B. (1998). Process systems and inventory control,
AIChE Journal 44(8): 1841–1857.
Fishman, O. (2008). Solar silicon, Advanced materials & processes p. 33.
Goetzberger, A., Luther, J. & Willeke, G. (2002). Solar cells: past, present, future, Solar energy
materials and solar cells 74(1-4): 1–11.
Green, M. & Emery, K. (1993). Solar cell efficiency tables, Progress in Photovoltaics: Research and
Applications 1(1): 25–29.
Guenther, C., OŠBrien, T. & Syamlal, M. (2001). A numerical model of silane pyrolysis in a
gas-solids fluidized bed, Proceedings of the International Conference on Multiphase Flow.
Henson, M. (2003). Dynamic modeling of microbial cell populations, Current opinion in
biotechnology 14(5): 460–467.
Hogness, T., Wilson, T. & Johnson, W. (1936). The thermal decomposition of silane, Journal of
the American Chemical Society 58(1): 108–112.
Hounslow, M. (1990). A discretized population balance for continuous systems at steady state,
AIChE journal 36(1): 106–116.
Hsu, G., Levin, H., Hogle, R., Praturi, A. & Lutwack, R. (1982). Fluidized bed silicon
deposition from silane. US Patent 4,314,525.
Hsu, G., Rohatgi, N. & Houseman, J. (1987). Silicon particle growth in a fluidized-bed reactor,
AIChE journal 33(5): 784–791.
137
Producing Poly-Silicon from Silane in a Fluidized Bed Reactor
14 Will-be-set-by-IN-TECH
Hulburt, H. & Katz, S. (1964). Some problems in particle technology:: A statistical mechanical
formulation, Chemical Engineering Science 19(8): 555–574.
Iya, S., Flagella, R. & DiPaolo, F. (1982). Heterogeneous decomposition of silane in a fixed bed
reactor, Journal of The Electrochemical Society 129: 1531.
Kojima, T. & Morisawa, O. (1991). Optimum process conditions for stable and effective
operation of a fluidized bed cvd reactor for polycrystalline silicon production.
Kunii, D. & Levenspiel, O. (1991). Fluidization engineering, Vol. 101, Butterworth-Heinemann
Boston.
Lai, S., Dudukovic, M. & Ramachandran, P. (1986). Chemical vapor deposition and
homogeneous nucleation in fluidized bed reactors: silicon from silane, Chemical
Engineering Science 41(4): 633–641.
Mahecha-Botero, A., Grace, J., Elnashaie, S. & Lim, C. (2005). Femlab simulations
using a comprehensive model for gas fluidized-bed reactors, COMSOL Multiphysics
(FEMLAB) Conference Proceedings, Boston, USA.
Mahecha-Botero, A., Grace, J., Elnashaie, S. & Lim, C. (2006). Comprehensive modeling of gas
fluidized-bed reactors allowing for transients, multiple flow regimes and selective
removal of species, International Journal of Chemical Reactor Engineering 4(4): 11.
Muller, A., Ghosh, M., Sonnenschein, R. & Woditsch, P. (2006). Silicon for photovoltaic
application, Materials Science and Engineering 134: 257–262.
Muller, M., Birkmann, B., Mosel, F., Westram, I. & Seidl, A. (2010). Silicon efg process
development by multiscale modeling, Journal of Crystal Growth 312(8): 1397–1401.
Neuhaus, D. & Münzer, A. (2007). Industrial silicon wafer solar cells, Advances in
OptoElectronics, ID 24521.
Odden, J., Egeberg, P. & Kjekshus, A. (2005). From monosilane to crystalline silicon, part i:
Decomposition of monosilane at 690-830ák and initial pressures 0.1-6.6 ámpa in a
free-space reactor, Solar energy materials and solar cells 86(2): 165–176.
Piña, J., Bucalá, V., Schbib, N., Ege, P. & De Lasa, H. (2006). Modeling a silicon cvd spouted
bed pilot plant reactor, International Journal of Chemical Reactor Engineering 4(4): 9.
Randolph, A. & Larson, M. (1971). Theory of particulate processes, Academic Press.
Steinbach, I., Apel, M., Rettelbach, T. & Franke, D. (2002). Numerical simulations for
silicon crystallization processes–examples from ingot and ribbon casting, Solar energy
materials and solar cells 72(1-4): 59–68.
Surek, T. (2005). Crystal growth and materials research in photovoltaics: progress and
challenges, Journal of Crystal Growth 275(1-2): 292–304.
Talalaev, R. (2009). Polysim: Modeling of polysilicon deposition by siemens process,
International Semiconductor Technology Conference.
White, C. (2007). Modeling for design and control of particulate systems.
White, C., Ege, P. & Erik Ydstie, B. (2006). Size distribution modeling for fluidized bed
solar-grade silicon production, Powder technology 163(1-2): 51–58.
White, C., Zeininger, G., Ege, P. & Ydstie, B. (2007). Multi-scale modeling and
constrained sensitivity analysis of particulate cvd systems, Chemical Vapor Deposition
13(9): 507–512.
Woditsch, P. & Koch, W. (2002). Solar grade silicon feedstock supply for pv industry, Solar
energy materials and solar cells 72(1-4): 11–26.
Würfel, P. (2005). Physics of solar cells: from principles to new concepts, Vch Verlagsgesellschaft
Mbh.
Zambov, L. (1992). Kinetics of homogeneous decomposition of silane, Journal of crystal growth
125(1-2): 164–174.
138
Solar Cells – Silicon Wafer-Based Technologies
8
Silicon-Based Third Generation Photovoltaics
Tetyana Nychyporuk and Mustapha Lemiti
University of Lyon, Nanotechnology Institute of Lyon (INL),
UMR CNRS 5270, INSA de Lyon,
France
1. Introduction
In order to ensure the widespread use of photovoltaic (PV) technology for terrestrial
applications, the cost per watt must be significantly lower than 1$ / Watt level. Actually, the
wafer based Silicon (Si) solar cells referred also as the 1
st
generation solar cells are the most
mature technology on PV market. However such PV devices are material and energy intensive
with conversion efficiencies which do not exceed in average 16 %. In 2008 the average cost of
industrial 1 Wp Si solar cell with conversion efficiency of 14.5 % (multicrystalline Si cell of
150 x 150 mm
2
, 220 m of thick, SiN antireflecting coating with back surface field and screen
printing contacts) achieved approximately 2.1 € assuming the production volume of 30 –
50 M Wp / per year (Sinke et al., 2008). At that cost level, the PV electricity still remains more
expensive comparing with traditional nuclear or thermal power engineering. One of the most
promising strategies for lowering PV costs is the use of thin film technology, referred also as
2
nd
generation solar cells. It involves low cost and low energy intensity deposition techniques
of PV material onto inexpensive large area low-cost substrates. Such processes can bring costs
down but because of the defects inherent in the lower quality processing methods, have
reduced efficiencies compared to the 1
st
generation solar cells.
Material limitations of the 1
st
generation solar cells and efficiency limitations of the 2
nd
generation solar cells are initiated boring of the Si-based 3
rd
generation photovoltaic. Its
main goal is to significantly increase the conversion efficiency of low-cost photovoltaic
product. Indeed, the Carnot limit on the conversion of sunlight to electricity is 95% as
opposed to the theoretical upper limit of 30% for a standard solar cell (Shockley & Queisser
1961). This suggests the performance of solar cells could be improved 2 – 3 times if different
concepts permitting to reduce the power losses were used.
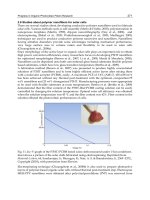
The two most important power loss mechanisms in single-band gap photovoltaic cells are (1)
the inability to absorb photons with energy less than the band gap and (2) thermalisation of
photon energy exceeding the gap (Fig. 1). Longer wavelength is not absorbed by the solar cell
material. Shorter wavelength generates an electron-hole pair greater than the bandgap of the
p-n junction material. The excess of energy is lost as heat because the electron (hole) relaxes to
the conduction (valence) band edges. The amounts of the losses are around 23 % and 33 % of
the incoming solar energy, respectively (Nelson, 2003). Other losses are junction loss, contact
loss and the recombination loss. Theory predicts (Shockley & Queisser 1961) that the highest
single – junction solar cell efficiency is roughly 30%, assuming such factors as the intensity of
one sun (no sunlight concentration), a one-junction solar cell (a single material with a single
bandgap), and one electron-hole pair produced from each incoming photon.
Solar Cells – Silicon Wafer-Based Technologies
140
To efficiently convert the whole solar spectrum into the electricity three main families of
approaches have been proposed (Green et al., 2005) (Green, 2002): (i) increasing the number
of bandgaps (tandem cell concept); (ii) capturing carriers before thermalisation, and (iii)
multiple carrier pair generation per high energy photon or single carrier pair generation
with multiple low energy photons. Up to now, tandem or in other words multijunction cells
provide the best-known example of such high-efficiency approaches. Indeed, the loss
process (2) of Fig. 1 can be largely eliminated if the energy of the absorbed photon is just a
little higher that the cell bandgap. The concept of tandem solar cells is based on the use of
several solar cells (or subcells) of different bandgaps stacked on top of each other (Fig. 2),
with the highest bandgap cell uppermost and lowest on the bottom. The incident light is
automatically filtered as it passes through the stack. Each cell absorbs the light that it can
most efficiently convert, with the rest passing through to underlying lower bandgap cells
(Green et al., 2007). The using of multiple subcells in the tandem cell structure permits to
divide the broad solar spectrum on smaller sections, each of which can be converted to
electricity more efficiently. Performance increases as the number of subcells increases, with
the direct sunlight conversion efficiency of 86.8 % calculated for an infinite stack of
independently operated subcells (Marti & Araujo, 1996). The efficiency limit reaches 42.5 %
and 47.5 % for 2- and 3-subcell tandem solar cells (Nelson, 2003) as compared to 30% of one
junction solar cell.
Fig. 1. Loss processes in a standard solar
cell: (1) non-absorption of below band gap
photons; (2) lattice thermalisation loss; (3)
and (4) junction and contact voltage losses;
(5) recombination loss (Green, 2003).
Fig. 2. Tandem cell approach (Green, 2003).
Having to independently operate each subcell is a complication best avoided. Usually,
subcells are designed with their current output matched so that they can be connected in
series. This constrain reduces performance. Moreover, it makes the design very sensitive to
the spectral content of the sunlight. Once the output current of one subcell in a series
connection drops more than about 5 % below that of the next worst, the best for overall
performance is to short-circuit the low-output subcell, otherwise it will consume, rather than
generate power.
It should be also noted the common point of confusion about solar cells efficiency. The
measured efficiency of solar cell depends on the spectrum of its light source. The space solar