Solar Cells Silicon Wafer Based Technologies Part 5 doc
Bạn đang xem bản rút gọn của tài liệu. Xem và tải ngay bản đầy đủ của tài liệu tại đây (3.12 MB, 25 trang )
Trichromatic High Resolution-LBIC: A System for the Micrometric Characterization of Solar Cells
91
characterization. Applied Surface Science, Vol.253, No.4 (May 2006), pp. 2179-2188,
ISSN 0169-4332.
Fredin, K.; Nissfolk, J.; Boschjloo, G.; Hagfeldt, A. (2007). The influence of cations on charge
accumulation in dye-sensitized solar cells. Journal of Electroanalytical Chemistry,
Vol.609, No.2, (November 2007), pp. 55-60, ISSN 1572-6657.
Gregg, B.A. (2004). Interfacial processes in dye-sensitized solar cell. Coordination Chemistry
Reviews, Vol.248, No.13-14, (July 2004), pp. 1215-1224, ISSN 0010-8545.
Lipinski, W.; Thommen, D.; Steinfeld, A. (2006). Unsteady radiative heat transfer within a
suspension of ZnO particles undergoing thermal dissociation. Chemical Engineering
Science, Vol.61, No.21, (November 2006), pp. 7039-7035, ISSN 0009-2509.
Navas, F.J.; Alcántara, R.; Fernández-Lorenzo, C. & Martín, J. (2009). A methodology for
improving laser beam induced current images of dye sensitized solar cells. Review
of Scientific Instruments, Vol.80, No.1(June 2009), pp. 063102-1-063102-7, ISSN 0034-
6748.
Nichiporuk, O.; Kaminski, A.; Lemiti, M.; Fave, A.; Litvinenko, S. & Skryshevsky, V. (2006).
Passivation of the surface of rear contact solar cells by porous silicon. Thin Solid
Films, Vol.511–512, (July 2006), pp. 248-251, ISSN 0040-6090
Nishioka, k.; Yagi, T.; Uraoka, Y. & Fuyuki, T. (2007). Effect of hydrogen plasma treatment
on grain boundaries in polycrystalline silicon solar cell evalulated by laser beam
induced current. Solar Energy Materials & Solar Cells, Vol.91, No.1, (January 2007),
pp. 1-5, ISSN 0927-0248.
O’Regan, B.; Grätzel, M. (1991). A low-cost, high-efficiency solar cell based on dye-sensitized
colloidal TiO
2
films. Nature, Vol.353, No.1 (October 1991), pp. 737-740, ISSN 0028-
0836.
Peter, L.M. (2007). Characterization and modeling of dye-sensitized solar cells. Journal of
Physical Chemistry C, Vol. 111, No.18, (April 2007), pp. 6601-6612, ISSN 1932-7447
Poce-Fatou, J.A.; Martín, J.; Alcántara, R.; Fernández-Lorenzo, C. (2002). A precision method
for laser focusing on laser beam induced current experiments. Review of Scientific
Instruments, Vol.73, No.11, (November 2002), pp. 3895-3900, ISSN 0034-6748.
Sontag, D.; Hahn, G.; Geiger, P.; Fath, P. & Bucher, E. (2002). Two-dimensional resolution of
minority carrier diffusion constants in different silicon materials. Solar Energy
Materials & Solar Cells, Vol.72, No.1-4, (April 2002), pp. 533-539, ISSN 0927-0248.
van Dyk, E.E.; Radue, C. & Gxasheka, A.R. (2007). Characterization of Cu(In,Ga)Se
2
photovoltaic modules. Thin Solid Films, Vol.515, No.15, (May 2007), pp. 6196-6199,
ISSN 0040-6090.
Vorasayan, P.; Betts, T.R.; Tiwari, A.N. & Gottschalg, R. (2009). Multi-laser LBIC system for
thin film PV module characterisation. Solar Energy Materials & Solar Cells, Vol.93,
No.6-7, (June 2009), pp. 917-921, ISSN 0927-0248.
Vorster, F.J.; van Dyk, E.E. (2007). High saturation solar light induced current scanning of
solar cells. Review of Scientific Instruments, Vol.78, No.1, (January 2007), pp. 013904-
1-013904-7, ISSN 0034-6748.
Walker, A.B.; Peter, L.M.; Lobato, K.; Cameron, P.J. (2006). Analysis of photovoltage decay
transients in dye-sensitized soar cells. Journal of Physical Chemistry B, Vol.110, No.50,
(October 2006), pp. 25504-25507, ISSN 1520-6106.
Solar Cells – Silicon Wafer-Based Technologies
92
Yagi, T.; Nishioka, K.; Uraoka, Y.; Fuyuki, T. (2004). Analysis of electrical properties of grain
boundaries in silicon solar cell using laser beam induced current. Japanese Journal of
Applied Physics, Vol.43, No.7A, (July 2004), pp. 4068-4072, ISSN 0021-4922.
5
Silicon Solar Cells: Structural Properties of
Ag-Contacts/Si-Substrate
Ching-Hsi Lin, Shih-Peng Hsu and Wei-Chih Hsu
Industrial Technology Research Institute ,
Taiwan, R.O.C.
1. Introduction
The screen-printed silver (Ag) thick-film is the most widely used front side contact in
industrial crystalline silicon solar cells. The front contacts have the roles of efficiently
contacting with the silicon (Si) and transporting the photogenerated current without
adversely affecting the cell properties and without damaging the p-n junction. Although it is
rapid, has low cost and is simplicity, high quality screen-printed silver contact is not easy to
make due to the complicated composition in the silver paste. Commercially available silver
pastes generally consist of silver powders, lead-glass frit powders and an organic vehicle
system. The organic constituents of the silver paste are burned out at temperatures below
500°C. Ag particles, which are ~70-85wt% and can be different in shape and size
distribution, show good conductivity and minor corrosive characteristics. The concentration
of glass frit is usually less than 5wt %; however, the glass frit in the silver paste plays a
critical role for achieving good quality contacts to high-doping emitters. The optimization of
the glass frit constitution can help achieve adequate photovoltaic properties.
The melting characteristics of the glass frit and also of the dissolved silver have significant
influence on contact resistance and fill factors (FFs). Glass frit advances sintering of the
silver particles, wets and merges the antireflection coating. Moreover, glass frit forms a glass
layer between Si and Ag-bulk, and can further react with Si-bulk and forms pin-holes on the
Si surface upon high temperature firing.
This chapter first describes the Ag-bulk/Si contact structures of the crystalline silicon solar
cells. Then, the influences of the Ag-contacts/Si-substrate on performance of the resulted
solar cells are investigated. The objective of this chapter was to improve the understanding
of front side contact formation by analyzing the Ag-bulk/Si contact structures resulting
from different degrees of firing. The observed microscopic contact structure and the
resulting solar-cell performance are combined to clarify the mechanism behind the high-
temperature contact formation. Samples were fired either at a optimal temperature of
~780°C or at a temperature of over-fired for silver paste to study the effect of firing
temperature. The melting characteristics of the glass frit determine the firing condition
suitable for low contact resistance and high fill factors. In addition, it was found the post
forming gas annealing can help overfired solar cells recover their FF. The results show that
after 400°C post forming gas annealing for 25min, the over-fired cells improve their FF. On
the other hand, both of the optimally-fired and the under-fired cells did not show similar
Solar Cells – Silicon Wafer-Based Technologies
94
effects. The FF remains the same or even worse after post annealing. Upon overfiring, more
silver dissolve in the molten glassy phase than that of optimally fired; however, some of the
supersaturated silver in the glass was unable to recrystallize because of the rapid cooling
process. The post annealing helps the supersaturated silver precipitate in the glass phase or
on silicon surface. This helps in recovering high FF and low contact resistance. An increase
in the size and number of silver crystallites at the interface and in the glass phase can
improve the current transportation.
2. Overview of Ag contacts on crystalline Si solar cells
2.1 Silver paste
Currently, screen printing a silver paste followed by sintering is used for the deposition of
the front contacts on almost all industrial crystalline silicon solar cells. Metallization with a
silver paste is reliable and particularly fast. The silver paste have to meet several
requirements: opening the dielectric antireflection layer and forming a contact with good
mechanical adhesion and low contact resistance. For most crystalline silicon solar cells, SiN
x
is used as an antireflection coating. The surface must be easily wetted by the paste. Figure 1
shows a typical front-electrode configuration of a commercial crystalline silicon solar cell.
The electrode-pattern consists of several grid fingers that collect current from the
neighboring regions and then collected into a bus bar. The bus bar has to be able to be
soldered.
Fig. 1. A typical front-electrode configuration of a commercial crystalline silicon solar cell.
The contact performance is influenced by the paste content, the rheology and the wetting
behavior.
Commercially available silver pastes generally consist of silver powders, lead-glass frit
powders and an organic vehicle system. The glass frit is used to open the antireflection
coating and provide the mechanical adhesion. The glass frit also promotes contact
formation. The organic vehicle system primarily includes polymer binder and solvent with
small molecular weight. Other additives like rheological material are also included in the
paste for better printing. The paste system must have a fine line capability. This requires a
well-balanced thixotropy and low flow properties during printing, drying and firing. In
addition, the paste should have wide range for firing process window.
Silicon Solar Cells: Structural Properties of Ag-Contacts/Si-Substrate
95
2.2 Screen printing and firing
Screen printing and the subsequent firing process are the dominant metallization techniques
for the industrial production of crystalline silicon solar cells. The front contact of the cell is
designed to offer minimum series resistance, while minimizing optical shadowing. The high
current density of the cell can be achieved by the low shadowing loss due to the high aspect
ratio of the front grid. However, a compromise between the shadowing loss and the
resistive loss due to the front grid is needed. The finger-pattern with the bus bar typically
covers between 6-10% of the cell surface. To achieve good performance contact, the printing
parameters should be selected based on criteria directly related to the silver paste. All
parameters such as the screen off-contact distance, squeegee speed and shore hardness of
the squeegee rubber must be optimized and matched according to the requirements.
The industrial requirements for technical screen printing regarding excellent print
performance, long screen life and higher process yields have increased significantly over
recent years. The high mesh count stainless steel mesh is well suited for fine line, high
volume printing. The screen should have good tension consistency and suitable flexibility
required for the constant deformation associated with off-contact printing. Besides, the
combinations of mesh count and thread diameter should be capable of printing the grid
thickness electrode requires.
The fast firing techniques are usually applied for electrode formation. During the firing step,
the contact is formed within a few seconds at peak temperature around 800°C. A typical
firing profile of a commercial crystalline silicon solar cell is shown in Figure 2. The optimal
firing profile should feature low series resistance and high fill factor (FF). A high series
resistance of a solar cell usually degrades the output power by decreasing the fill factor. The
total series resistance is the sum of the rear metal contact resistance, the emitter sheet
resistance, the substrate resistance, the front contact resistance, and the grid resistance.
Fig. 2. A typical firing profile of a commercial crystalline silicon solar cell.
2.3 Contact mechanisms
A good front-contact of the crystalline silicon solar cell requires Ag-electrode to interact with
a very shallow emitter-layer of Si. An overview of the theory of the solar cell contact
resistance has been reported (Schroder & Meier, 1984). Despite the success of the screen
printing and the subsequent firing process, many aspects of the physics of the front-contact
Solar Cells – Silicon Wafer-Based Technologies
96
formation are not fully clear. The major reason is probably because the metal-silicon
interface for screen printed fingers is non-uniform in structure and composition. The Ag
particles can interact with the Si surface in a few seconds at temperatures that are
considerably lower than the eutectic point.
Many mechanisms have been proposed to explain how contact formation is though to occur.
The general understanding of the mechanisms agree that the glass frit play a critical role on
front-contact formation. Silver and silicon are dissolved in the glass frit upon firing. When
cooled, Ag particles recrystallized (Weber 2002, Schubert et al. 2004). It has been suggested
that Ag crystallites serve as current pickup points and that conduction from the Ag
crystallites to the bulk of the Ag grid takes place via tunneling (Ballif et al., 2003). The effect
of glass frit and Ag particles on the electrical characteristics of the cell was also reported
(Hoornstra et al. 2005, Hillali et al. 2005, Hillali et al. 2006). It was further suggested that lead
oxide gets reduced by the silicon. The generated lead then alloys with the silver and silver
contact crystallites are formed from the liquid Ag-Pb phase (Schubert et al. 2004, Schubert et
al. 2006). Due to the complicate and non-uniform features of the contact interface, more
evidence and further microstructure investigation is still needed. The objective of this
chapter was to improve the understanding of front side contact formation by analyzing the
Ag-bulk/Si contact structures resulting from different degrees of firing. The influences of
the Ag-contacts/Si-substrate on performance of the resulted solar cells are also investigated.
3. Structural properties of Ag-contacts/Si-substrate
3.1 Sample preparation
This study is based on industrial single-crystalline silicon solar cells with a SiN
x
antireflection coating, screen-printed silver thick-film front contacts and a screen-printed
aluminum back-surface-field (BSF). The contact pattern was screen printed using
commercial silver paste on top of the SiN
x
antireflective-coating (ARC) and fired rapidly in a
belt furnace. The exact silver paste compositions are not disclosed by the paste
manufacturers. The glass frit contents are estimated from the results found in this work. The
boron-doped p-type 0.5-2Ωcm, 200-230μm thick (100) CZ single-crystalline Si wafers were
used for all the experiments. Si wafers were first chemically cleaned and surface texturized
and then followed by POCl
3
diffusion to form the n
+
emitters. The resulted pyramid-shaped
silicon surface is sharp and smooth, as shown in Figure 3. After phosphorus glass removal, a
single layer plasma-enhanced chemical vapor deposition (PECVD) SiN
x
antireflection
coating was deposited on the emitters. Then, both the screen-printed Ag and the Al contacts
were cofired in a lamp-heated belt IR furnace.
In this work, cells were fired either at a optimal temperature of ~780°C or at a temperature
of over-fired for silver paste to study the effect of firing temperature. Some cells were
further post annealed in forming gas (N
2
:H
2
=85:15) at 400°C for 25min. The forming gas
anneal improve the fill factor (FF) for some over-fired cells.
Transmission electron microscopy (TEM) and Scanning electron microscopy (SEM) was
used to study the microstructures and features at contact interface. Microstructural
characterization of the contact interface was performed using a JEM-2100F transmission
electron microscope (TEM) operated at 200kV. Cross-sectional TEM sample foils were
prepared by mechanically thinning followed by focused-ion-beam (FIB) microsampling to
electron transparency. Current-voltage (I-V) measurements were taken under a WACOM
solar simulator using AM1.5 spectrum. The cells were kept at 25°C while testing.
Silicon Solar Cells: Structural Properties of Ag-Contacts/Si-Substrate
97
Fig. 3. SEM image of a pyramid-textured silicon surface structure
3.2 Interface microstructure
The microstructural properties of the screen-printed Ag-bulk/Si contacts were examined by
TEM (Lin et al., 2008). TEM results confirmed that the glassy-phase plays an important role
in contact properties. The typical Ag-bulk/Si microstructure, which includes localized large
glassy-phase region, is shown in Figure 4(a). The area where Ag-bulk directly contact with
Si through SEM observation is actually with a very thin glass layer (<5nm) in between as
shown in Figure 4(b). This possibly can be attributed to shape-effect of Ag particles and to
the existence of the glassy-phase. Ag particles do not sinter into a very compact structure
and a porous Ag-bulk is formed, resulting in a complex contact structure. In this study, it
was found that in optimal fired contacts, there are at least three different microstructures,
illustrated in Figure 5(a)-(c) (Lin et al., 2008). The combination effects of glassy-phase and
the dissolved metal atoms have a crucial influence on Ag-bulk/Si-emitter structures, and
consequently, the current transport across the interface is affected.
Fig. 4. (a) TEM bright field cross-sectional image of the the Ag-bulk/Si contact structure
with localized large glassy-phase region. (b) HRTEM of the Ag-bulk/Si interface. There is a
very thin glass layer between Si and Ag-bulk.
Solar Cells – Silicon Wafer-Based Technologies
98
Figure 6 shows a high-resolution TEM (HRTEM) contrast of the Ag embryos on Si-bulk. This
results in Ag-bulk/thin-glass-layer/Si contact structure which is schematic drawing in
Figure 5(a). It is suggested that Ag-bulk/thin-glass-layer/Si contact structure shown in
Figure 5(a) is the most decisive path for current transportation (Lin et al., 2008).
(a) (b) (c)
Fig. 5. Schematic drawing of the three major microstructures present in optimal fired Ag-
bulk/Si contacts: (a) Ag-bulk/thin-glass-layer/Si; (b) Ag-bulk/thick-glass-layer/Si; and (c)
Ag-bulk/glass-layer/ARC/Si contact structure.
Fig. 6. HRTEM contrast of the Ag embryos on Si-bulk. This results in Ag-bulk/thin-glass-
layer/Si contact structure.
Silicon Solar Cells: Structural Properties of Ag-Contacts/Si-Substrate
99
The schematic Ag-bulk/thick-glass-layer/Si contact structure shown in Figure 5(b) may
arise if there are large glass-frit clusters and/or large voids at the interface plane prior to
high temperature treatment. Upon firing, the glass frits soften and flow all around. The flow
behavior of the molten glassy-phase, to a degree, is associated with capillary attraction force
caused by the tiny spacing between Ag particles, and it also depends on their wetting ability
to the antireflection layer. Large and thick glassy-phase region is very likely due to the
agglomeration of the molten glass frit at high temperature, and is responsible for a
significant variation in glass-layer thickness.
Another interesting feature shown in Fig. 4(a) is the curve-shaped glassy-phase/Si
boundary, which suggests the occurrence of mild etching of Si-bulk by the Ag-
supersaturated glassy-phase. Penetration of native SiO
x
and SiN
x
ARC is essential for
making good electrical contact with the Si emitter, thus achieving a low contact resistance.
However, this must be achieved without etching all the way through the p-n junction and
results in shorting the cell. It is found that a smooth curve-shaped Si surface is a
distinguishable phenomenon for samples fired optimally (Lin et al., 2008). Underfired
samples usually have sharp and straight interface under <110> beam direction, while rough
Si surface is usually observed for overfired samples.
Even for optimally fired samples, the residual antireflection coating can be observed at some
locations, especially in the valley area of the pyramid-shaped textured structure as shown in
Figure 7. Amorphous antireflection layer is thus in between the glassy-phase and Si-bulk.
This lead to an Ag-bulk/glass-layer/ARC/Si contact structure as illustrated in Figure 5(c).
Here, ARC (~100nm thick prior to firing) includes native SiO
x
layer and SiN
x
ARC. To some
extent, the residual SiNx under the contacts help to reduce surface recombination.
Microstructures studies revealed that there is more residual ARC in underfired samples
Fig. 7. TEM bright field cross-sectional image. Even for optimally fired samples, the residual
antireflection coating can be observed at some locations, especially in the valley area of the
pyramid-shaped textured structure. This leads to an Ag-bulk/glass-layer/ARC/Si contact
structure.
Solar Cells – Silicon Wafer-Based Technologies
100
than in optimally fired samples. In addition, no Ag embryo was found on Si-bulk because
the residual ARC helps inhibit Ag diffusion onto Si substrate.
It is still not clear how does glassy-phase, which is a molten phase of the glass frit, etch or
interact with the SiN
x
ARC? It was reported that the SiN
x
ARC can be opened during the
firing step by a reaction between the PbO (glass) and SiN
x
(Horteis et al., 2010). In the
reaction, lead oxide (PbO) was reduced to lead. By tracing Pb content, this work shows that
Pb precipitates usually appear in the area where SiN
x
ARC can be found. That is, lead
embedded in the glassy-phase with an Ag-bulk/glass-layer/ARC/Si contact structure as
illustrated in Figure 5(c). The Pb concentration in glassy-phase, which originates from lead
silicate glass frit, is much higher than that in ARC. Therefore, Pb can serve as a good tracer
to distinguish glassy-phase-area from ARC using energy dispersive spectroscopy (EDS).
Figure 8 shows Pb precipitates in the glassy phase. The inset in Figure 8 is an energy
dispersive spectroscopy (EDS) mapping. This work suggests that during the firing process,
the amorphous SiN
x
ARC was incorporated into the already-existing glass phase. It is like
two loose glassy-phase merge to each other upon firing. It is shown in this work that the
SiN
x
ARC in more dense structure, ex. deposited at 850°C through low-pressure CVD
(LPCVD), is difficult to merge in the lead silicate glass phase.
Fig. 8. TEM bright field image shows Pb precipitates in the glassy phase. The inset is the
energy dispersive spectroscopy (EDS) mapping.
3.3 Crystallite-free zone in glassy phase
Commercially available Ag pastes consist of Ag powders, lead-glass frit powders and an
organic vehicle system. It was found that the glass frit plays a very important role during
contact formation. Upon firing, the glass frits soften and flow all around. Furthermore, the
melted lead silicate glass dissolves the Ag particles. The melted glass also merges the
amorphous silicon nitride layer. Upon further heating, the melted glass etches into the
silicon bulk underneath and results in non-smooth silicon surface.
Silicon Solar Cells: Structural Properties of Ag-Contacts/Si-Substrate
101
TEM micrographs in Figure 9(a) and (c) show the precipitates in the large solidified glassy-
phase region which is enclosed with Si and Ag-bulk (Lin et al., 2008). The selected area
diffraction (SAD) pattern (Figure 9(d)) reveals that only Ag precipitates exist. As shown in
Figure 9(a) and its schematic drawing in Figure 9(b), the dissolved Ag atoms near Si-bulk
tend to nucleate on the Si surface and lead to an Ag-crystallite-free zone in close vicinity of
the Si surface. Also, an Ag-crystallite-free zone near the bulk-Ag can be found. Few or
virtually no Ag microcrystallites were found in the Ag-crystallite-free zone. This indicates
that the observed Ag microcrystallites are not un-melted Ag particles which were trapped or
suspended in the glassy region; instead, they are precipitates from Ag supersaturation
molten glassy-phase.
Fig. 9. (a) TEM bright field image. The large glassy-phase enclosed with Si and Ag-bulk.
(b) Ag precipitates in the large solidified glassy-phase region. (c) Schematic drawing of
image in (b). (d) Selected-area-diffraction pattern of the glassy-phase region shown in (b).
Only Ag crystallites exist.
The occurrence of the observed Ag-crystallite-free zone can be accounted for by the
diffusion-dependent nucleation mechanism (Porter and Easterling, 1981) as illustrated in
Figure 10 (Lin et al., 2008). Upon heating, the dispersed lead silicate glass frits soften into
molten phase, in the mean time. They further merged and surrounded the Ag particles due
Solar Cells – Silicon Wafer-Based Technologies
102
to capillary attraction force. Some Ag atoms then dissolved in the molten glassy-phase. The
observed Ag precipitates confirm the dissolution of Ag because a critical Ag supersaturation
must be exceeded for nucleation to occur. Higher temperature increases the Ag dissolution
in the glassy-phase. In the mean time, the majority un-dissolved Ag particles, which are in
contact with one another, sinter or coalesce to achieve Ag-bulk via interdiffusion of Ag
atoms. The molten glassy-phase can further merge (or etch) the amorphous antireflection
coating and, therefore, is in direct contact with the Si-bulk. The formation of Ag-crystallite-
free zone is attributed to the nucleation and growth of Ag crystallites on Si-bulk. Upon
cooling, the dissolved Ag was drained from the surrounding area to Si surface and an Ag-
crystallite-free zone results. The width of the Ag-crystallite-free zone is affected by the
cooling rate. High cooling rate will produce narrow Ag-crystallite-free zone. This helps in
tunneling-assisted carrier transportation. A narrow (width < 20nm) Ag-crystallite-free zone
was observed in a large glassy-phase region for optimally fired samples.
It can be found that Ag precipitates in glassy-phase tend to coarsen into larger crystallites
with smaller total interfacial area. Also, wide Ag-crystallite-free zones, which surround the
large Ag precipitate, were observed. However, the combination effects of low Ag-precipitate
density and wide Ag-crystallite-free zone are not favor for current transportation. It,
therefore, suggests that long stay in high temperature as well as low cooling rate is of
particular concern in the design of firing profile.
Fig. 10. (a) Schematic cross-section drawing of the Ag-embryo on Si-bulk. (b) Schematic
drawing of the dissolved Ag-concentration profile near an Ag embryo.
4. Impacts of contact structure on performance of solar cell
4.1 A possible mechanism for carrier transportation
The current transport across screen-printed front-side contact of crystalline Si solar cells should
be strongly affected by the contact microstructures. This study shows that the area where Ag-
bulk directly contact Si, through SEM observation, is actually with a very thin glass layer in
Silicon Solar Cells: Structural Properties of Ag-Contacts/Si-Substrate
103
between. In addition, high-density Ag-embryo was found on Si-bulk for samples fired
optimally. In Figure 11, Ag embryos with sizes less than 5 nm in diameter nucleate epitaxially
on the Si surface. The Ag-embryo density is more than 2×10
16
cm
-2
, which was counted via
TEM. This results in Ag-bulk/thin-glass-layer/Si contact structure. The lack of Ag-bulk/Si
direct contact for optimally fired samples leads to a reasonable assumption that Ag-bulk/thin-
glass-layer/Si contact structure is the most decisive path for current transporting across the
interface. The glass layer between Ag-embryos and Ag-bulk for samples fired optimally is too
thin (<5nm) to be an effective barrier to electron transfers, which can occur by tunneling.
Fig. 11. Cross-sectional HRTEM of the Ag embryos on Si-bulk. This results in Ag-bulk/thin-
glass-layer/Si contact structure.
The schematics of a possible conductance mechanisms across the Ag-bulk/thin-glass-
layer/Si contact structure is shown in Figure 12. Current transport between Si substrate and
front contact is enabled by separated silver crystallites. Since the curved regions of the tiny-
pricipitate/glass-phase interface have higher field intensity due to the small radius of
curvature; therefore, the breakdown voltage is less (Sze S.M., 1981). Besides the curved-
interface effect mentioned above, the metal-supersaturated glassy-phase has better
conductivity. The embedded metal precipitates in glassy-phase, as shown in Figure 9, can
retain the charge and form the interfacial charge storage centers. In addition, the embedded
Ag precipitates can be charged and discharged by quantum-mechanical tunneling of
electrons. Moreover, the dissolved Ag can substantially increase the trap density at the
interface, thereby allowing shorter times for the transportation. Thus, current can transport
through the thick glassy-phase not only by multi-tunneling steps between Ag precipitates,
but also by thermally excited electrons hopping from one isolated precipitate to the next. In
the case of a current transport by multi-tunneling steps between microscopic Ag
precipitates, high Ag-precipitate density in the glassy-phase could help to decrease the
specific contact resistance of samples (Gzowski et al. 1982, Ballif et al. 2003).
Many of the ideas that were discussed with regard to Ag-particles/thick-glass-layer/Si
microstructure can be carried over to Ag-particles/thin-glass-layer/Si (Figure 5(a)). Only
the thick glassy-phase is replaced by an ultrathin glass layer, and this has important
consequences for the current conduction across the interface. It was reported (Rollert et al.,
Solar Cells – Silicon Wafer-Based Technologies
104
1987) that if the Ag-bulk is in direct contact with the Si and if there was no glass layer in
between, the Ag would diffuse at least 5μm deep during the firing cycle and it would shunt
the p-n junction. The high-density Ag-embryo on Si found in this study originates from the
dissolved Ag in glassy phase, which is in direct contact with Si-bulk. This should play an
important role in current transport across the interface. This could be supported by the
observation of less Ag-embryo on Si was found for underfired samples, which result in
poorer FF of the cell compared to those of optimally fired samples. In the case of underfired
samples, the dissolution of Ag is much less; it therefore reduces the supersaturation of Ag.
Thus, few Ag precipitates were detected on Si.
Fig. 12. (a) Schematic cross-section drawing of the Ag-embryo on Si-bulk. (b) Schematic
energy-band drawing of a possible conductance mechanisms across Ag-bulk/thin-glass-
layer/Si contact structure.
As shown in Figure 12, Ag-embryo on Si could serve as current pickup points and that
conduction from the Ag-embryo to Ag-bulk takes place via tunneling through the ultrathin
glass layer in between. An increase in the width and the number of Ag precipitates on Si
may improve the probability of the encounter of thin glass regions where tunneling can take
place. Also, due to tunneling-assisted carrier transport, the fraction of thin glass regions at
Ag-bulk/Si interface is critical in reducing the macroscopic contact resistance. Thus, the
abilities to generate high-density Ag-embryos on Si-bulk and to keep the glass layer thin are
crucial in achieving good electrical contact.
It was reported (Card & Rhoderick 1971, Kumar & Dahlke 1977) that if the insulator layer is
sufficiently thick, the tunneling probability through the insulator layer is negligible.
Alternatively, if the insulator layer is very thin (< 5nm), little impediment is provided to
carrier transport. This study confirms that the spacing between Ag-embryos and Ag-bulk can
Silicon Solar Cells: Structural Properties of Ag-Contacts/Si-Substrate
105
be less than 5nm. In addition, the dissolved Ag could improve the electrical conductivity of the
glass layer. It, therefore, suggest that carriers through the ultrathin glass layer are the most
decisive path for current transportation. A possible mechanism for carriers passing through
the thin glass layer is illustrated by considering electron tunnel, as shown in Figure 12.
The interface microstructure analysis of the screen-printed front-side contact shown in this
work is based on industrial-type rapid firing-profile, which results in good contact quality.
Although Ag-paste composition and characteristics can be different between manufacturers,
the results and trends shown in this work have high degree similarity to other screen-printed
crystalline Si solar cells using different types of Ag-paste. Further understanding of the effects
of the paste constituents and firing conditions on the contact interface can lead to the
development of better, more reproducible, and higher performance contacts in the future.
4.2 Effects on fill factor
The fill factor, FF, is a measure of the squareness of the I-V characteristic. The fill factor is
given: FF=(V
max
I
max
)/(V
oc
I
sc
), where V
oc
is the open-circuit voltage and I
sc
is the short-circuit
current. V
max
and I
max
are voltage and current at maximum power point (P
max
) respectively.
The graphical interpretation of P
max
is the area of the largest rectangle below the I-V curve.
In practice, FF is less than one because series and parallel resistances will always result in a
FF decrease. A good value for industrial silicon solar cells is ~76-78%.
It was found that the glass frit plays an important role during contact formation. During
firing procedures, the glass frits firstly get fluid, wet and merge the SiNx dielectric layer. It
was then etching into silicon substrate. It was known that defects and impurities tend to
move to surface upon high temperature treatments to release their high thermodynamic
energies. Therefore, the etching degree of silicon by the glass fluid, to some extent, affects
the quality of the contacts. On cooling down, silver precipitates, which serve as a transport
medium, recrystallize on silicon surface as well as in the glassy phase. This chapter shows
that silver precipitates during cooling and the etching degree of silicon during firing are
important for achieving good quality contacts.
On cooling down from high temperature firing, the over-saturated silver tends to precipitate.
Figure 13(a) shows a SEM microstructure image of optimally fired sample. Besides
precipitating in the glassy phase, high density Ag recrystallizes appear on the silicon substrate.
The area where silver directly contacts to Si through SEM observation is actually with a very
thin glass layer in between. The dissolved Ag atoms near Si-bulk tend to nucleate on the Si
surface. Ag-embryo on Si can serve as current pickup points and that conduction from the Ag-
embryo to Ag-bulk takes place via tunneling through the ultrathin glass layer in between.
Thus, the abilities to generate high density Ag embryos on Si-bulk and to keep the glass layer
thin are crucial in achieving good electrical contact. The observed Ag precipitates confirms the
dissolution of Ag because a critical Ag supersaturation must be exceeded for nucleation to
occur. In the case of underfiring, the less dissolved Ag reducing the supersaturation, and
therefore, fewer Ag precipitates grow on Si during cooling as shown in Figure 13(b).
Penetration of native SiO
x
and SiN
x
antireflective coating is essential for making good
electrical contact to the Si emitter, thus achieving a low contact resistance. However, this
must be achieved without etching all the way through the p-n junction and results in
shorting the cell. It is found that a smooth curve-shaped Si surface is a distinguishable
phenomenon for samples fired optimally. Underfired samples usually have sharp and
straight interface, while rough Si surface is usually observed for overfired samples. As
shown in Figure 14(a) and (b), overfiring results in rough Si surface. Rough Si surface
Solar Cells – Silicon Wafer-Based Technologies
106
Fig. 13. (a) SEM cross-sectional image of the optimally fired sample. Besides precipitating in
the glassy phase, high density Ag recrystallizes on the <111> planes of the pyramid Si. (b)
SEM cross-sectional image of the underfired sample. Fewer Ag precipitates grow on Si.
Fig. 14. (a) SEM cross-sectional image of the overfired sample. More bulk Si, especially in the
area near the tip of the pyramid, was etched during firing. (b) TEM bright field cross-
sectional image of the overfired sample.
increase the possibility of undesired surface recombination. Furthermore, as shown in
Figure 14(a), more bulk Si, especially in the area near the tip of the pyramid, was etched
during firing. The overetching of Si may result in locally shunt of the cell.
In general, the relation between the current density through the contact and the potential
across it is non-linear for metal-semiconductor contacts (Schroder and Meier, 1984). The metal-
silicon interface for screen printed fingers is known to be non-uniform in structure and
composition. It is found the melting characteristics of the glass frit and its ability to dissolved
Ag have significant influence on contact resistance and fill factors (FF). Glass frit advances
sintering of the Ag particles, wets and merges the antireflection coating. Moreover, glass frit
forms a glass layer between Si and Ag-bulk, and can further react with Si-bulk and forms pin-
holes on the Si surface upon high temperature firing. Typical firing temperatures of a
commercial solar cell were between 750C and 800C, where the optimum balance between the
Ag-crystallite density and the distribution of the glass layer should be found.
Silicon Solar Cells: Structural Properties of Ag-Contacts/Si-Substrate
107
For optimum solar cell efficiency, the current-voltage curve must be as rectangular as
possible. The new paste design should increase the fill factor of the solar cell without
hurting the short-circuit current density. The current-voltage (I-V) characteristic of an ideal
silicon solar cell is plotted in Figure 15 denoted as curve-1. In Figure 15, Curve-2 shows the
effect of shunt resistance on the current-voltage characteristic of a solar cell (series resistance
R
s
=0). The shunt resistance, R
sh
, has little effect on the short-circuit current, but reduces the
open-circuit voltage. Curce-3 shows the effect of series resistance on the current-voltage
characteristic of a solar cell (R
sh
∞). Conversely, the series resistance, R
s
, has no effect on
the open-circuit current, but reduces the short-circuit current. Sources of series resistance
include the metal contacts. The extreme current-voltage characteristic, ex. Curve-2 or Curve-
3 shown in Figure 15, is not difficult to explain. However, the original sources for I-V curve
denoted as Curve-4 in Figure 15 remain unclear. It is not unusually to have I-V feature
similar to that of Curve-4. The difference between the curve-1 and curve-4 (the rounded
corner of the I-V curve) is probably due to the non-uniform contact resistance of the front
contact. Although it is known that the curve can be rounded by series resistance, in practice
curve shapes are often found that cannot be explained by the single series resistance.
Fig. 15. Current-voltage (I-V) characteristic of a silicon solar cell. The I-V curve for an ideal
cell is denoted as curve-1.
The front-contact interface for screen printed fingers is non-uniform in structure and
composition. The complicate interface-structure influences the series resistance and the fill
factor of the cell. From the view of contact-formation mechanism described in this chapter,
the melting characteristics of the glass frit determine whether the paste together with the
firing condition is suitable for low contact resistance and high fill factors.
It was found the post forming gas annealing can help overfired solar cells recover their F.F. The
results show that after 400°C post forming gas annealing for 25min, the overfired cells improve
their FF. On the other hand, both of the optimally-fired and the under-fired cells did not show
similar effects. The FF remains the same or even worse after conducting post-annealing.
The mechanism of FF recovers for overfired cells after post forming-gas annealing was
further investigated. It was found that the supersaturated silver in the glassy-phase plays a
very important role for FF recover. More Ag can dissolve in the molten glassy phase for
overfired samples than that of optimally fired counterparts. Either higher temperature or
Solar Cells – Silicon Wafer-Based Technologies
108
longer heating time increases the Ag dissolution in the glassy-phase. Some of the
supersaturated silver in the glass for overfired cells was unable to recrystallize because of
the rapid cooling process. The post-annealing helps the supersaturated silver further
precipitate in the glassy-phase or move to already exist Ag crystallites. The number of small
precipitates is increased and the conductivity of the insulating glass is improved. Post-
annealing the overfired cells thus results in recovering high FF and low contact resistance.
An increase in the size and number of silver crystallites at the interface and in the glass
phase can improve the current transportation.
Post-annealing of overfired cells helps the supersaturated Ag precipitate. It also coalesce the
pre-formed Ag crystallites. More Ag embryos were generated and grew to larger size, which
decreased the contact resistance, and enhanced the F.F. As shown in Table 1, the forming-
gas anneal reduces the contact resistance, and thus, it improves the FF for the overfired cells.
In Table 1, the post-annealing increases the FF by 1.5~9%. However, it should be mentioned
that the cells cannot be overfired too much. It must be avoided to etch all the way through
the p-n junction, which results in shorting the cell. The overetching of Si underneath may
result in locally shunt of the cell. Besides, overfiring results in rough Si surface. Rough Si
surface increase the possibility of undesired surface recombination.
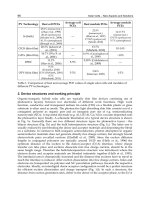
Sample #
Jsc/Jsc
(%)
Voc/Voc
(%)
FF/FF
(%)
Eff/Eff
(%)
1 -0.68 -0.25 2.66 1.71
2 -0.30 -0.27 1.75 1.16
3 -0.36 -0.05 4.68 4.25
4 -1.92 -0.61 3.19 0.58
5 -0.01 -0.68 9.13 8.38
Table 1. The forming gas anneal improves the FF for the overfired cells.
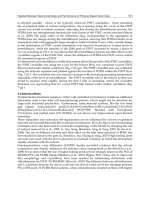
The mechanism for FF enhancement of the overfired cells after post-annealing is related to
the supersaturated Ag. Figure 16(a) shows a HRTEM image of the silicon/electrode
Fig. 16. (a) HR TEM contrast of more and large Ag crystallites in the glassy phase. (b) HR
TEM contrast of contact interface. Ag precipitates are closer to Ag-bulk.
Silicon Solar Cells: Structural Properties of Ag-Contacts/Si-Substrate
109
interface structure. It can be found that the Ag crystals in the glassy phase grow to larger
size either by electron beam annealing or by heat treatments, indicating a better current
transportation. The Ag area coverage at the Si-Ag interface is increased. More and larger Ag
crystallites in the glassy phase increase the contact area fraction, which improves the
probability of tunneling from Ag crystallites to the Ag bulk. The better conductance
contributes to lower contact resistance and a higher FF. Also shown in Figure 16(b), more
Ag embryos were generated and result in a locally decreased contact resistance. The
rounded-corner feature of the I-V curve, as shown as Curve-4 in Figure 15, can be improved.
The rounded-corner feature of the I-V curve is caused by combination effects of resistance
and recombination. Control the process better and decrease the carriers’ jumping-path can
improve the fill factor of the cell.
5. Conclusion
Despite the success of the screen printing and the subsequent firing process, many aspects of
the physics of the front-contact formation are not fully clear. The major reason is probably
because the contact-interface for screen printed fingers is non-uniform in structure and
composition. The contact microstructures have a high impact on current-transport across the
contact-interface.
This chapter first presents the Ag-bulk/Si contact structures of the crystalline silicon solar
cells. Then, the influences of the Ag-contacts/Si-substrate on performance of the resulted cells
are investigated. The objective of this work was to improve the understanding of front-side
contact formation by analyzing the individual contact types and their role in the Ag-bulk/Si
contact. Microstructure analyzing confirmed that the glassy-phase plays an important role in
contact properties. The location where Ag-bulk directly contact Si-substrate, through SEM
observation, is actually a very thin glass layer in between. High density Ag-embryos on Si-
bulk were found for samples fired optimally. It is suggested that Ag-bulk/thin-glass-layer/Si
contact is the most decisive path for current transportation. Possible conductance mechanisms
of electrons across the contact interface are also discussed.
Ag-embryo on Si could serve as current pickup points and that conduction from the Ag-
embryo to Ag-bulk takes place via tunneling through the ultrathin glass layer in between.
Thus, the abilities to generate high density Ag embryos on Si-bulk and to keep the glass
layer thin are crucial in achieving good electrical contact.
This chapter also reports that after 400°C post forming-gas annealing for 25min, the
overfired cells improve their FF. The mechanism for FF enhancement of the overfired cells
after post-annealing is related to the supersaturated silver in glassy-phase. The post-
annealing helps the supersaturated silver further precipitate in the glassy-phase or move to
already exist Ag crystallites. More and larger Ag crystallites in the glassy phase increase the
contact-area fraction, which improves the probability of tunneling from silver crystallites to
the silver bulk.
The interface microstructure analysis of the screen-printed front-side contact shown in this
work is based on industrial-type rapid firing-profile. Although Ag-paste composition and
characteristics can be different per manufacturer, the results and trends shown in this work
have high degree similarity to other screen-printed cell using different type Ag-paste.
Further understanding the effects of the paste constituents and firing conditions on the
contact-interface can lead to develop a better, more reproducible, and higher performance
screen-printed electrode.
Solar Cells – Silicon Wafer-Based Technologies
110
6. Acknowledgements
It is gratefully acknowledged that this work has been supported by Bureau of Energy,
Ministry of Economics Affairs, Taiwan. The authors would also like to thank Shu-Chi Hsu
and Chih-Jen Lin for their TEM operation.
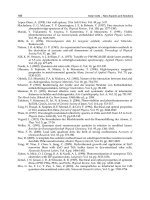
7. References
Ballif C., D. M. Huljić, G. Willeke, and A. Hessler-Wysser (2003). Silver thick-film contacts
on highly doped n-type silicon emitters: structural and electronic properties of the
interface, Applied Physics Letters, Vol. 82, pp. 1878-1880. ISSN 0003-6951.
Card H.C. and E. H. Rhoderick (1971). Studies of tunnel MOS diodes I. Interface effects in
silicon Schottky diodes, Journal of Physics D: Applied Physics, Vol. 4, pp. 1589.
Gzowski O., L. Murawski, and K. Trzebiatowski (1982). The surface conductivity of lead
glasses, Journal of Physics D: Applied Physics, Vol. 15, pp. 1097-1101.
Hilali M.M., K. Nakayahiki, C. Khadilkar, R. C. Reedy, A. Rohatgi, A. Shaikh, S. Kim, and S.
Sridharan (2006). Effect of Ag particle size in thick-film Ag paste on the electrical
and physical properties of screen printed contacts and silicon solar cells, Journal of
The Electrochemical Society, Vol. 153, pp. A5-A11. ISSN 0013-4651.
Hilali M.M., M. M. Al-Jassim, B. To, H. Moutinho, A. Rohatgi, and S. Asher (2005). Journal of
The Electrochemical Society, Vol. 152, pp. G742-G749. ISSN 0013-4651.
Hoornstra J., G. Schubert, K. Broek, F. Granek, C. LePrince (2005). Lead free metallization
paste for crystalline silicon solar cells: from model to results, 31st IEEE PVSC
conference, Orlando, Florida.
Horteis M, T. Gutberlet, A. Reller, and S.W. Glunz (2010). High-temperature contact
formation on n-type silicon: basic reactions and contact model for seed-layer
contacts, Advanced Functional Mateials, Vol. 20, pp. 476-484.
Kumar V. and W. E. Dahlke (1977), Solid State Electron., Vol. 20, pp. 143.
Lin C H., S Y. Tsai, S P. Hsu, and M H. Hsieh (2008). Investigation of Ag-bulk/glassy-
phase/Si heterostructures of printed Ag contacts on crystalline Si solar cells, Solar
Energy Materials & Solar Cells, Vol. 92, pp. 1011-1015.
Porter D.A. and K.E. Easterling (1981), Phase Transformations in Metals and Alloys, Chapman
& Hall, New York.
Rollert F., N. A. Stolwijk, and H. Mehrer (1987), Solubility, diffusion and thermodynamic
properties of silver in silicon, Journal of Physics D: Applied Physics, Vol. 20, pp. 1148-
1155.
Schroder D.K. & Meier D.L. (1984). Solar cell contact resistance – a review, IEEE Transactions
on Electron Devices, Vol. 31, pp. 637-647. ISSN 0018-9383.
Schubert G., F. Huster, P. Fath (2004), Current Transport Mechanism in printed Ag Thick
Film Contacts to an n-type Emitter of a Crystalline Silicon Solar Cell, Proceedings of
19
th
European Photovoltaic Solar Energy Conference, Paris, France, pp. 813-817.
Schubert G., F. Huster, and P. Fath (2006). Physical understanding of printed thick-film front
contacts of crystalline Si solar cells—Review of existing models and recent
developments, Solar Energy Materials & Solar Cells, Vol. 90, pp. 3399-3406.
Sze S.M.(1981). Physics of Semiconductor Devices, 2nd Edition, John Wiley & Sons, New York,
ISBN 10-0471-0566-18.
Weber L. (2002), Equilibrium solid solubility of silicon in silver, Metallurgical and Materials
Transactions A, Vol. 33, pp. 1145-1150.
6
Possibilities of Usage LBIC Method for
Characterisation of Solar Cells
Jiri Vanek and Kristyna Jandova
Brno University of Technology
Czech Republic
1. Introduction
Light Beam Induced method works on principle of exposure very small area of a solar cell,
usually by laser beam focused directly on the solar cell surface. This point light source
moves over measured solar cell in direction of both X and Y axis. Thanks to local current -
voltage response the XY current - voltage distribution in investigated solar cell can be
measured. Acquainted data are then arranged in form of a current map and the behaviour of
whole solar cell single parts is thus visible. Most common quantity measured by Light Beam
Induced method is Current (LBIC) which is set near local I
SC
current.
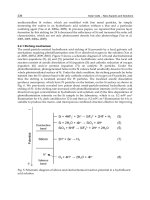
Fig. 1. Diagrammatical demonstration of measuring system (Vanek J, Fort T, 2007)
If the inner resistance of the measured amplifier is set to high value then the response of
light is matching to V
OC
and the method is designed as LBIV. There was some attempt to
track the local maximum power point and to record local power value (LBIP) but the most
widespread method is LIBC for this predicative feature. In such current map is possible to
determine majority of local defects, therefor the LBIC is the useful method to provide a non-
destructive characterization of structure of solar cells.
Solar Cells – Silicon Wafer-Based Technologies
112
Fig. 2. Operating point of measuring amplifier and resultant method
1.1 Different wavelengths of light source used in LBIC
The effect on the absorption coefficient and penetration depth, defined as distance that light
travels before the intensity falls to 36% (1/e), is clearly shown in figure 3. Note that the data
in figure 3 represent unstrained bulk material with no voltage applied. By introducing strain
or electrical bias, it is possible to shift the curves slightly to a higher wavelength due to a
reduction in the effective band gap.
Fig. 3. Absorption coefficient and penetration depth of various bulk materials as a function
of wavelength. (Intel,Photodetectors, 2004)
In cases where the photon energy is greater than the band gap energy, an electron has a high
probability of being excited into the conduction band, thus becoming mobile. This interaction
is also known as the photoelectric effect, and is dependent upon a critical wavelength above
which photons have insufficient energy to excite or promote an electron positioned in the
valence band and produce an electron-hole pair. When photons exceed the critical wavelength
(usually beyond 1100 nanometres for silicon) band gap energy is greater than the intrinsic
photon energy, and photons pass completely through the substrate. Table 1 lists the depths (in
microns) at which 90 percent of incident photons are absorbed by a typical solar cell.
Possibilities of Usage LBIC Method for Characterisation of Solar Cells
113
Wavelength
(Nanometers)
400 450 500 550 600 650 700 750
Penetration
Depth
(Micrometers)
0.1 0.4 0.9 1.5 2.4 3.4 5.2 7.0
Wavelength
(Nanometers)
750 800 850 900 950 1000 1050 1100
Penetration
Depth
(Micrometers
8.4 11 19 33 54 156 613 2857
Table 1. Photon Absorption Depth in Silicon (c-Si PC1D 300K)
On the other hand when the wavelength is closer to energy of band gab the spectral
efficiency is higher. When photon with high energy impacts silicon atom there is high
probability to excitation of valence electron to non-stable energy band and in short time the
electron is moving to lower stable energy band. The energy difference is lost and change to
heat. Therefor spectral response of higher wavelength photons should be higher than of
photons of lower wavelength (even they have higher energy).
2. Light beam induced current measurement
Light sources with wavelengths of various colors were used for scanning of samples –
Table 2. Various wavelengths of light were used to show the different defects in different
depth under the surface of silicon solar cells. See Table 1. Apart from laser, highly
illuminating LED diodes installed in a tube similar to that of LASER were used. The tube
was a capsule enabling smooth installation of the LED diode instead of laser. It also enabled
regulation of illumination.
The LBIC method is realized by the movement of the light source (focused LED diode or
laser) fixed on the grid of the pen XY plotter MUTOH IP-210 near the solar cell surface.
Thanks to the local response of the solar cell to incident light we get the scan of local current
differences (we were using the measurement PC card Tedia PCA-1208). From the obtained
data we can get the whole picture of the solar cell current response to light. From this
picture we can read the most local type of defect.
For light exposure LASERs and high luminous LED diodes were used. They were inserted
into a special container with the same dimensions like the LASERs. The container was used
for smooth assembling in the same grid like the LASER and for holding the focusing lens
and screening slide.
We have studied set of four samples of solar cells with known defects like swirl defect,
scratches, diffusion fail and missing contacts act.
All global parameters of these test cells were known from previous measurements. These
parameters are showed in Table 3.
source laser LED LED LED
color infrared red green blue
wavelength 830 nm 660 nm 560 nm 430 nm
Table 2. Used light sources
Solar Cells – Silicon Wafer-Based Technologies
114
Fig. 4. Laser used in LBIC
Fig. 5. Front and back side of monocrystaline silicon solar cell.
Sample
I
450
[A]
I
sc
[A]
U
oc
[V]
I
m
[A]
U
m
[V]
P
m
[W]
FF
[%]
EEF
[%]
1 2,729 2,842 0,576 2,628 0,476 1,252 76,5 12,04
2 2,344 2,511 0,559 2,293 0,461 1,057 75,4 10,17
3 2,426 2,602 0,560 2,344 0,466 1,092 74,9 10,50
4 2,500 2,670 0,567 2,473 0,459 1,136 75,1 10,92
Table 3. Data for global parameters of tested solar cells (Solartec s.r.o, 2005)
There are presented two results for each wavelength (colour of light) of inducing radiation
to the chosen samples for a better comparison. There were the sample no. 1 and no 3 chosen.
The maximal value of local current is assigned the white color and the minimal current
Possibilities of Usage LBIC Method for Characterisation of Solar Cells
115
response is assigned black color. For authenticity of measurement the pictures are kept in
their original setting.
Fig. 6. Analyses of output local current of the sample no. 1 by usage of focused LED diode
with middle wavelength 650 nm (red LED, T=297 K)
Fig. 7. Analyses of output local current of the sample no. 3 by usage of focused LED diode
with middle wavelength 650 nm (red LED, T=297 K)