Modern Telemetry Part 13 doc
Bạn đang xem bản rút gọn của tài liệu. Xem và tải ngay bản đầy đủ của tài liệu tại đây (603.31 KB, 30 trang )
Modern Telemetry
352
Prentice, E.F., Flagg, T.A. & McCutcheon, C.S. (1990)a. Feasibility of using implantable
passive integrated transponder (PIT) tags in salmonids. American Fisheries Society
Symposium 7: 317-322.
Prentice, E.F., Flagg, T.A., McCutcheon, C.S. & Brastow, D.F. (1990)b. PIT-Tag monitoring
systems for hydroelectric dams and fish hatcheries. American Fisheries Society
Symposium 7: 323-334.
Quintella, B.R., Andrade, N.O., Espanhol, R. & Almeida, P.R. (2005). The use of PIT
telemetry to study movements of ammocoetes and metamorphosing sea lampreys
in river beds. Journal of Fish Biology 66: 97-106.
Riley, W.D., Eagle, M.O., Ives, M.J., Rycroft, P. & Wilkinson, A. (2003). A portable passive
integrated transponder multi-point decoder system for monitoring habitat use and
behaviour of freshwater fish in small streams. Fisheries Management and Ecology 10:
265-268.
Roghair, C.N. & Dolloff, C.A. (2005). Brook trout movement during and after recolonization
of a naturally defaunated stream reach. North American Journal of Fisheries
Management 25: 777-784.
Roussel, J.M., Haro, A. & Cunjak, R.A. (2000). Field test of a new method for tracking small
fishes in shallow rivers using passive integrated transponder PIT technology.
Canadian Journal of Fisheries and Aquatic Sciences 57: 1326-1329.
Scruton, D.A., McKinley, R.S., Kouwen, N., Eddy, W. & Booth, R.K. (2002). Use of telemetry
and hidraulic modelling to evaluate and improve fish guidance efficiency at a louve
rand bypass system for downstream-migration Atlantic salmon (Salmo salar) smolts
and kelts. Hydrobiologia 483: 83-94.
Statsoft Inc. 2004. STATISTICA (Data Analysis Software System). Version 7. www.statsoft.com.
Tulsa, USA.
Teixeira A., Cortes R.M.V. & Oliveira D. (2006). Habitat Use by Native and Stocked Trout
(Salmo trutta L.) In Two Northeast Streams, Portugal. Bulletin Française de la Pêche et
la Pisciculture 382: 1-18.
Teixeira A. & Cortes R.M.V. (2007). Pit Telemetry as a Method to Study the Habitat
Requirements of Fish Populations. Application to Native and Stocked Trout
Movements. Hydrobiologia 582:171-185.
ter Braak, C.J.F. (1986). Canonical correspondence analysis: a new eigenvector technique for
multivariate direct gradient analysis. Ecology 67: 1167-1179.
ter Braak, C.J.F. & Smilauer, P. (1998). CANOCO- Reference manual and user’s guide to Canoco
for Windows: Software for Canonical Community Ordination (version 4). Microcomputer
Power, Ithaca, NY, USA.
Weber, E.D. & Fausch, K.D. (2003). Interactions between hatchery and wild salmonids in
streams: differences in biology and evidence for competition. Canadian Journal of
Fisheries and Aquatic Sciences 1018-1036.
White, R.J., Karr, J.R. & Nehlsen, W. (1995). Better roles for fish stocking in aquatic resource
management. In: Uses and Effects of Cultured Fish in Aquatic Ecosystems, Schramm,
H.L. Jr. & Piper, R.G. (eds.), 527-547, American Fisheries Society, Bethesda,
Maryland.
Young, M.K. (1994). Mobility of brown trout in south-central Wyoming streams.
Canadian
Journal of Zoology 72: 2078-2083.
Young, M.K. (1999). Summer diel activity and movement of adult brown trout in high-
elevation streams in Wyoming, U.S.A. Journal of Fish Biology 54: 181-189.
17
Sea Turtle Research
I-Jiunn Cheng
Institute of Marine Biology,
National Taiwan Ocean University, Keelung, Taiwan
Republic of China (ROC)
1. Introduction
1.1 Definition
Telemetry includes an array of techniques that allow remote monitoring, measurement and
recording or reporting of information. It was first used in weather research and has
expanded quickly to other disciplines. Relatively accurate measurements without direct
observer participation allow some important research that was impossible to conduct in the
past. This has an important implication for study of life history traits of species that migrates
long-distances, such as sea turtles. The ocean habitat, wide distribution ranges and
movement across political boundaries all create difficulties for direct study of sea turtle
behavior. Telemetry can overcome these obstacles and is a cost-effect tool for behavioral
ecology.
1.2 Importance to sea turtle researches
1.2.1 Life history trait studies
Animal migrations, especially long-distance movements, are to explore for resources
across substantial temporal and spatial scales. They are often adaptations for avoiding
seasonal depletion of local resources in order to survive and reproduce in suitable
environments (Alerstan et al., 2003; Southwood and Avens, 2010). Sea turtle hatchlings,
because of high predation pressure in nearshore waters and otherwise unsuitable habitats
near nesting beaches, must migrate (actually they must “drift”) after leaving their nests to
suitable nursery grounds (Bolten, 2003). In addition, sea turtles evolved from freshwater
turtles (Pritchard, 1997). Thus, even though these giant reptiles have successfully invaded
the ocean, they must still return to their natal beaches to nest (called “natal homing”; Carr,
1967). Therefore, migrations play substantial roles in the survival of sea turtle
populations.
Sea turtles are ocean-wide, long-distance migrating reptiles that spend more than 95% of
their time at sea. Except for leatherbacks, olive ridleys, flatbacks and some loggerheads,
hatchlings spend their early lives drifting in the ocean (often referred to as “the lost years”;
e.g. Bolten, 2003; Carr, 1967). After 5 to 7 years in the open ocean, they migrate into food-
rich nearshore waters and feed along the bottom (Carr, 1967; Plotkin, 2003). Some food-rich
areas, such as coral reefs, seagrass beds and nearshore fishing grounds are the sites
favorable for juvenile sea turtles (e.g. Hawkes et al., 2006). Due to the developmental shift in
nutrient requirements and other needed conditions for growth, sea turtles often exhibit an
Modern Telemetry
354
ontogenetic shift in habitat (Crouse et al., 1987). In addition, different species may stay in
different habitats. For example, green, hawksbill, olive ridley, flatback and some loggerhead
turtles migrate into nearshore waters when they advance from hatchling to juvenile status,
while leatherbacks and some loggerhead turtles remain in the open ocean until adulthood
(Bolten, 2003). Therefore, understanding the population dynamics of these giant reptiles
requires detailed information for each life stage.
1.2.2 Energy and material transformation among ecosystems
Sea turtles are important in the dynamics of material and energy in the ocean, especially in
nearshore ecosystems. Even though the migration of sea turtles is resource-driven (Plotkin,
2003), they can transfer the energy and material they have gathered by feeding hundreds to
thousands of miles away to their nesting beaches and nearshore waters. The materials are
deposited in the form of excretion, feces and eggs, providing resources for the local
ecosystem (Bjorndal and Jackson, 2003). Also, they can transfer the materials and energy
from feeding during their post-nesting migrations to their foraging and resting areas in the
form of excretion and feces (e.g. Bjorndal and Jackson, 2003).
1.2.3 Sea turtle conservation
Sea turtles appeared in the world more than one hundred million years ago. Due to their
large body size, fast swimming speed and scales and scutes armor, they thrived through the
age of dinosaurs and the radiation of mammals until two hundred years ago. The ancient
character of sea turtles raises great interest in understanding their phylogeny, adaptive
evolution, distribution and migratory behavior. Furthermore, the high commercial value
and development of their nesting beaches for human recreation and housing projects, the
losses they sustain to fisheries by-catch, the effects of pollution, the ingestion of marine
debris and other human impacts have resulted in severe depletion of these once abundant
marine reptiles (Hutchinson and Simmonds, 1992). The endangered status of sea turtles
stresses the importance of understanding how they migrate from one life-stage habitat to the
next, migrations being among the most vulnerable phases of their lives. Adequate
knowledge of migrations is critical for design and adoption of effective conservation
measures. The puzzles of migration can be largely solved through the application of
telemetry tools, along with other techniques such as genetic markers of relationship (e.g.
Bolten et al., 1998).
2. History of sea turtle telemetry studies
2.1 Initiation ages
Sea turtles are endangered or vulnerable species according to the list of the World
Conservation Union (IUCN, 2003). They are difficult to track because a majority of their
lives is spent in the ocean. In addition, the conservation status forbids extensive sampling
and sacrifice of live specimens. Thus, the life history of sea turtles has remained largely
unknown for a long period of time. In the past, Dr. Carr used helium balloons (Carr and
Schroder, 1967) and flipper tagging (Carr, 1980) to track the whereabouts of sea turtles in the
ocean, but without much success. The problems remained unsolved until the late 1970s
when satellite telemetry techniques were first applied to wildlife studies (Stonburner, 1982;
Sea Turtle Research
355
Taillade, 1992). Solutions to the mysteries of sea turtle movement in the ocean have begun to
emerge.
The first publications on satellite telemetry were by Timko and Kolz (1982) and Stoneburner
(1982), based on studies conducted in 1979. The tags they used, designed to study the
migrations of polar bears, reported to Nimbus satellites. Despite the cumbersome tags
involved, the success of their work strongly encouraged researchers to apply satellite
telemetry to sea turtle migratory behavior worldwide.
2.2 Early generation of satellite telemetries
The early generation of satellite tags was heavy and large, such as the Telonics ST-6 and
ST-14 PTT. All the data were processed by the Argos system (Taillade, 1992). They only
provides locations based on Doppler analyses, date and time of the data collection, location
class, dive duration and on-site temperature. The accuracy and confidence limits of each
location were determined based on how many transmitted data the satellites received
during the passover period and were referred to a location class (LC). The most accurate LC
(LC 3) has an estimated precision <150 m when at least four messages are received during a
satellite pass. The worst available location class has only one message during a passover,
with no estimate of location accuracy (LC Z; Argos, 1996). The relatively low accuracy of the
location data and the diving behavior of sea turtles, only surfacing briefly for breath (e.g.
Lutcavage and Lutz, 1997), resulted in small data volumes with high uncertainties. Despite
these shortfalls, the widespread application of this technique allows us a thorough
understanding of the behavior and distribution of animals, especially those most difficult to
observe in the past. For example, by deploying 7 Argos-linked satellite PTTs (platform
terminal transmitters) on green turtles that nested on Wan-an Island, Penghu Archipelago,
Taiwan from 1994 till 1996, Cheng (2000) found that they migrate to coastal waters in
Northeast Asia after their nesting seasons.
2.3 Radio and sonic telemetries
Distinct from satellite tags are directional radio and sonic telemetry and ultrasonic-pinger
tracking. Directional radio and sonic telemetry have been used widely to track terrestrial
animals such as rabbits, raccoons and striped skunks (e.g. Cochran et al., 1963), and also
birds (e.g. Fuller et al., 1988). However, application of these techniques to sea turtle
migration study is very limited. Because positions of animals are determined by
triangulation, radio telemetry can only be applied in areas where three receivers can be set
up. Thus, most studies on sea turtles are limited either to the coastal zone during short-term
studies of movements between nesting visits to the shore (e.g. Dizon and Balazs, 1982) or to
estuarine environments (e.g. Brauna et al., 1997) where the detection range is less than 5 km.
Ultrasonic pinger tracking involves attaching a pinger to the trailing edge of a sea turtle’s
dorsal carapace, and then locating its position by listening with a hydrophone from a boat.
Theoretically, the receiver can detect signals within 1 to 2 km. In practice, however, due to
the attenuation of the sound and contamination of the sound by noise from waves,
turbulence, marine organisms, etc., the signal can only be heard clearly within 100 to 200 m.
Thus, this system, like radio tracking, works better for very short-range studies, such as diel
migration in foraging grounds or coastal movements. (e.g. Addison et al., 2002). The labor-
intensive aspect and the short range of detection have curtailed extensive development of
these telemetry systems.
Modern Telemetry
356
2.4 Diving behavior studies
Since 1980, researchers have turned their attention to the study of sea turtle diving behavior.
This is based on the general interest in animal behavior and to serve conservation purposes
Techniques have indeed been developed to record turtle diving behaviors. Time-Depth
Recorders (TDRs) have been used for this purpose since the late 80’s (Eckert et al., 1986;
Hays et al., 2001). A TDR contains pressure and light sensors and a clock. Thus, one can
calculate the depth and record the diving behavior of a sea turtle during the course of
monitoring. A TDR is a self-recording device without transmitting function, so the
instrument and data must be retrieved before the dive sequences can be analyzed. This
limits application mainly to the study of diving behavior for short durations in narrow
geographic areas, such as the intervals between nestings (e.g. Cheng, 2009).
2.5 Advancement in satellite tag performances
For satellite telemetry studies, the advances of computer techniques in the 1990s enabled
development of satellite tags that are smaller, lighter and with greater battery capacity.
These improvements allow application of satellite tags to a wider range of both species and
ages for longer tracking durations. For example, Shaver and Rubio (2008) used satellite tags
to study the migration of the “head-strated” olive ridleys. They confirmed that nearshore
areas close to the release points of the “head started” turtles are their main foraging
grounds. In addition, the migration behaviors of the “head started” release turtles were
similar to those of wild-born turtles. Recently, Wyneken et al. (2008) used miniature satellite
tags to track small juvenile loggerhead turtles, discovering the migration of the hatchlings
during their “lost years” proposed by Carr (1967).
Advances in tag performance include addition of new sensors. Thus, more information on
the life history traits can be measured. Among the most useful and widely used are
pressure sensors, which enable us to characterize the diving behavior of the tagged
animal along the migration route. We can now view sea turtle migration patterns in three,
rather than two, dimensions. An important example is the SDR (Satellite Depth Recorder)
produced by Wildlife Computer Inc. Depth sensors require extended recording, enabled
by the SPLASH, MK-10 tags and SRDL (Satellite Relay Data Logger) produced by the Sea
Mammal Research Unit. Other sensors attached to turtles and reporting via satellite tags
include IMASEN (Inter-MAndibular Angle SENsor), which is used to understand the
foraging behavior of a sea turtle during migration (e.g. Fossette et al., 2008), and a body
temperature logger, which is used to understand how large sea turtles like leatherbacks
maintain body temperatures suitable for survival in both warm tropical and cold polar
waters (Casey et al., 2010). These improvements in data collection provide more complete
understanding of sea turtle life history traits other than simple migration routes in the
wild. After review of more than 130 relevant publications over 20 years, Godley et al.
(2008) confirmed that detailed information on sea turtle life history traits in the ocean can
be gathered through this technique. However, the limit on the available storage space on
the environmental polar orbiting satellites curtails the detailed information provided from
the sensors themselves.
2.6 GPS satellite telemetries
A new technique emerged in late 2000—the GPS (global positioning system) satellite tag.
This advance acts as the stepping stone to a new era of telemetry studies. GPS was
Sea Turtle Research
357
developed in the early 1970s to overcome the limitations of navigation systems
and mainly was used for military defense purposes at that time. A code (i.e. SA; Selective
Availability) added by the US government resulted in poor resolution (± 100 m) for the
civilian purposes. Lifting of the SA interference in 2000 increased the accuracy of GPS
positions substantially (< ± 10 m). This enables us to apply GPS to the study of
animal behavior more widely. Despite this improvement, the application of GPS to
marine organisms, especially those emerging briefly for breath like sea turtles, is
still impossible. Each geographic location determined by the GPS device requires
confirmation from at least 6 satellites, which takes about 3 minutes to complete.
The breath duration of sea turtles is equal to or less than 90 seconds. Thus, the GPS can
only be applied to general oceanographic studies, such as buoy tracking. Only in recent
years has the development of Fastloc technology allowed combining GPS with satellite
telemetry technology. According to a document available from Widllfie Computer Inc.
(www.wildlifecomputers.com), this software can acquire position signals within 10 mS.
This makes possible the study of sea turtle movement on fine scales, such as home-range
studies during the inter-nesting interval (e.g. Schofield et al., 2009).
2.7 Underwater video camera Crittercam
In recent years, underwater video camera systems have been introduced to “visualize” an
animal’s behavior in the water by attaching the camera to the carapace aligned toward the
head. This system is called “Crittercam” and has been funded mostly by the National
Geographic Society. Seminoff et al. (2006) used this system to determine that there are six
different diving patterns and three foraging strategies of the green sea turtle.
Furthermore, they found that sea turtles may conduct different types of activities during
the same dive. Thus, one has to interpret diving behavior with caution. Because this
system provides more information than the TDR, it provides us new interpretations of the
diving behavior of sea turtles in the wild. However, due to the expense of the instruments
and lack of transmission capability, Crittercam has to be retrieved and the data
downloaded. Therefore, application of this technique to the diving behavior of sea turtles
is still limited.
3. Retrievable recording studies
3.1 Time-Depth Recorders (TDRs)
Retrievable recording instruments are self-recording devices without data transmitting
ability. They are mainly used for the study of animal diving behavior. The most important
instrument in sea turtle research is the TDR.
Sea turtles spend more than 95% of their time in the ocean, and their migration behaviors
are not simply swimming in surface water and recordable in just 2-dimentions. Rather, they
dive during their migrations; thus, migrations are three-dimensional movements. Similarly
to marine mammal activity, how sea turtles adapt to changes of water temperature and
pressure when diving is an interesting physiological question. For example, Boye (1997)
discussed the relationships among foraging depth, lung oxygen content, dive duration,
water temperature and the size of sea turtles. TDR has been used widely to record the
diving behavior of sea turtles since late 80’s (e.g. Eckert et al., 1986; Hays et al., 2000a),
enhancing our understanding of sea turtle diving substantially.
Modern Telemetry
358
3.2 Dive patterns
Based on the high frequency of TDR sampling (1 second or less per sample) the pattern of
each dive can be represented graphically. Basically, six diving patterns have been identified,
U, V, W, S (include inverse S), shallow and “others”. U dives are mainly used during rest
intervals or for moving along the seabed (Cheng, 2009); V dive are mainly used for traveling
or exploring the environment (Hochscheid, et al., 1999); W dives are commonly considered
as foraging dives during which turtles spend time in a food patch (Fossette et al., 2008); S
dives are apparently related to energy conservation (Hochscheid et al., 1999); shallow dives
are mainly used for swimming in near-surface waters (Houghton et al., 2002); and “others”
are dives that combine more than one dive type. The high resolution of the diving pattern
allows us to explain what turtles really do during diving periods, including the diel
variability of the behavior (Storch et al., 2005). This instrument has used to study the diving
behavior of immature hawksbill (van Dam and Diez , 1996), wild hawksbill turtles (Storch et
al., 2005), gravid leatherback turtles during the inter-nesting interval (Eckert et al. , 1986;
Southwood et al., 2005), green turtles (Hays et al., 2004) and loggerhead turtles (Houghton
et al., 2002). It is generally found that most gravid females conduct resting U-dives during
the inter-nesting intervals, decreasing this dive type and switching to shallow dives a few
days prior to nesting events, apparently searching for the proper nesting beach (Cheng,
2009). Recently, a new device has emerged on the market, the G5 tag. It is a miniature tag, 8
mm long and 1.3 g weight in the water. This instrument has been used to study the diving
behavior of jellyfish (Hays et al., 2008). It may enable us to study the diving behavior of
turtle hatchlings after they enter the sea.
3.3 Long-term migration studies
Only a few researchers have employed TDR tags to conduct long-term migration studies
that include pre-nesting, inter-nesting and post-nesting periods (e.g. Rice and Balazs, 2008).
A requirement for conducting such TDR studies is that researchers must understand the
whereabouts of sea turtles in detail. Then they can determine when and where to retrieve
the TDR. Based on the results of the above studies, one can clearly define the diving
behavior and the physiological significance of different dive patterns, as well as the
responses of sea turtles to the temporal and spatial variations of both food availability and
hydrodynamic features. This has made an indelible contribution to the understanding of the
diving behavior of sea turtles.
4. Non-retrievable telemetry studies
4.1 Satellite telemetry studies
Non-retrievable telemetry instruments use an antenna to transmit data they have collected
via radio to a boat or shore station or via radio to a satellite and from the satellite to a
ground receiver. They do not require having the instrument in hand to download the data.
Therefore, they can be used to determine movement patterns across wide geographic areas
and under varied environmental condition. Due to the size limit of this chapter, I will only
focus on the instruments most widely used to date such as satellite telemetry.
There are two kinds of satellite tag; the conventional satellite PTT (platform terminal
transmitter) tag and Pop-up Archival Transmitting (PAT) tags. Each tag is designed for a
specific purpose and provides slightly different information.
Sea Turtle Research
359
4.2 Conventional satellite telemetries
A conventional satellite PTT transmits its data to a satellite at frequency determined by the
user, e.g. 6 h on (transmitting) and 6 h off (not transmitting). Because radio signals cannot be
transmitted under water, there is a salt-water switch installed on the tag that stops
transmission of signals 5 seconds after the sensor is covered by the water, in most cases
when the sea turtle starts to dive. It allows transmission when the turtle surfaces.
Combining the salt-water switch with intermittent transmissions maximizes tag
performance and extends battery life significantly. Because sea turtles are air breathing, this
kind of tag enables us to track their migrations in detail.
Sea turtles are capital breeders, investing heavily in their beach deposits of eggs (Southwood
and Avens, 2010). They must use hydrodynamic features effectively in order to arrive at
nesting destinations at suitable seasons, reduce unnecessary costs and increase their fitness.
However, both genetic and tagging studies show that sea turtles migrate several hundreds
to thousands miles to both forage and nest (Bowen et al., 1995; Cheng, 2000), even crossing
entire oceans (Bolten et al., 1998; Hughes et al., 1998). There is much evidence also showed
that, except for a few species like flatbacks (Natator depressa), sea turtle species have
widespread distributions in the oceans (Bowen et al., 1992). Thus, use of environmental
information to determine their migration routes is essential to the survivor of their
populations. Studies have shown that currents, fronts, winds, Earth’s magnetic field
variations, bathymetric features, path integrations and more factors are important influences
determining the migratory navigation of sea turtles (Plotkin, 2003).
Many studies have shown that the highly migratory species tend to use surface currents to
conduct their long-distance movements (e.g. across the ocean) (Bolten et al., 1998). From a
physiological ecology point of view, swimming with the current can reduce energy
expenditure. However, it is not easy to prove this argument. Usually, in addition to the
migratory routes of animals, researchers also need the current trajectories or related
information to determine the relationships. One may misinterpret the relationship if the two
parameters are evaluated on the different scales. For example, when examining the overlap
of migration routes tracked by the satellite telemetry with surface chlorophyll distributions
in Atlantic, Hays et al. (2002) found no apparent relationship between the post-nesting
migration of green turtles from Ascension Island and surface currents. It is possible that the
scale of measurement for chlorophyll is much larger than that of the migration routes of the
turtles. In other cases, the relationship is more straightforward. For example, Hawkens et al.
(2006) combined satellite telemetry with surface currents and chlorophyll distribution,
revealing that larger loggerhead turtles in the Atlantic migrate to the coastal waters, while
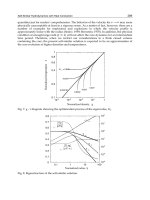
smaller ones remain in the open ocean.
4.3 Study the diving behavior with satellite telemetries
Some researchers try to expand the function of conventional PTTs by using the dive
duration to judge the diving behavior (e.g. Godley et al., 2003). However, due to the fact that
this instrument does not provide detailed information on dives (see TDR functions in the
previous section), researchers can only evaluate the diving behaviors in different waters.
The application of this device to study diving behavior is quite limited.
Adding pressure sensors to satellite tags is a substantial improvement. In addition to the
position data provided by conventional satellite tags, pressure data allows us to study sea
turtle diving behavior during oceanic migration. Two of the most widely used combinations
Modern Telemetry
360
are the SDR (Satellite Depth Recorder) and SRDL (Satellite Relay Data Logger), already
mentioned. However, due to the limited space available in the satellite to store data for
transmission, not all the collected data are processed and send to the user. SDR only
provides the percentage of time a sea turtle stays in a specific water depth. It does not
describe the full diving behavior, but it does reveal the water depths where sea turtles
explore most frequently. Howell et al. (2010) used SDR-10 and SDR-16 tags to track
loggerhead turtles captured as longline by-catch in the mid-Pacific. They found that the
seasonal diving behavior of these immature turtles is related to hydrodynamic features such
as eddies and the depth of the mixing layer.
Sea Mammal Research Unit selects the five most representive positions in a dive profile
from SRDL (Satellite Relay Data Logger) data and provides them to the user. One can then
reconstruct the dive profile based on those five positions. By using this device, Hays et al.
(2004) found that, once leatherbacks migrated well out into Atlantic Ocean, they go deeper
and deeper the longer away from the nesting beaches. They suggested that this behavior
was related to foraging activities. Hamel et al. (2008) deployed SRDLs to study the inter-
nesting diving behavior of six olive ridley turtles offshore from Northern Australia and
found that they spent most of the time resting on the seabed and decreased dive durations a
few days prior to each nesting event.
In recent years, these instruments reporting to satellites have been used extensively to study
the diving behavior of sea turtles during their post-nesting phase, even their whole
migration periods. Among sea turtles, leatherbacks are the best candidates. This is because
leatherbacks make cross-ocean migrations. They nest on tropical beaches and forage in sub-
polar waters. Their exclusive food items - jellyfish – are distributed widely in the open
ocean; from pole to pole and from surface to several hundred even a thousand meters depth.
Thus, the study of their diving behaviors can provide long-term and rich information on
their life history traits. López-Mendilaharsu et al. (2009) conducted a long-term study of
leatherback turtles with SDRL, confirming the high use area for nesting in South Africa and
the relationship between the dive depth and the concentration of zooplankton.
4.4 Dichotomous development in satellite tracking devices
The emergence of GPS satellite telemetry creates a new dimension in the study of animal
behavior. For example, by combining GPS satellite telemetry with the local marine
environmental data, Schofield et al. (2010) determined the home range of nesting loggerhead
turtles at Zakynthos Island, Greece. Furthermore, they found that the females would adjust
their home range and nesting beaches slightly, depending on weather conditions, to
maintain the maximum fitness of the population.
There has been a dichotomous development in satellite tracking devices after emergence of
GPS technology. Despite their fine-scale position resolution, GPS satellite tags are not
equipped with pressure sensors, and thus provide no diving information. On the other
hand, even though SDR or SRDL does provide good dive information it still relies on the
Argos system to determine positions. There is an urgent need to combine these techniques
to provide comprehensive information on 3-D behavior of sea turtles in the ocean.
Furthermore, despite the improvements in tag performance, a major drawback is the
limitation on power supply. The water-tight design of the satellite tag does not allow battery
replacement. Thus, if the antenna has not broken during operation, the lifetime of the tag
depends mainly on battery life. Even though the manufacturer uses lithium batteries,
Sea Turtle Research
361
saltwater switches and pre-set transmitting intervals to extend tag lifetime, scarcely any
telemetry study lasts more than 2 years. Some researchers try to extend their tag life by
using 2 batteries instead of one or by refrigerating tags to protect the batteries. Still, tags
cease transmission once their batteries are drained. The remigration interval of sea turtles
usually lasts from 2 to 7 or more years, which is much longer than the battery lifetime.
Therefore, the understanding of life history traits throughout the period before remigration
will be limited. One solution to this problem is to use solar-battery satellite tags. This tag is
still in the protocol stage at this writing. The other solution is to invent a hydrodynamically
rechargeable battery.
4.5 Pop-up PAT tags
PAT tags are designed to track the large-scale movements and behavior of fish and other
animals which do not spend enough time at the surface to allow the use of real-time
satellite tags ( In sea turtle
research, PAT tags are used to study survivorship. A PAT must detach from the animal
and surface before the data it collected (e.g. temperature, depth, light level) can be
transmitted to a satellite. Thus, the length of attachment is a compromise between the
requirements for the tag to release properly and the need for long-term attachment. The
interval should also allow for operation of a break-away link should the animal become
entangled (Epperly et al., 2007). PATs are usually used to determine the post-hooking
survival rate of marine turtles interacting with fishing gear such as longlines. Sasso and
Epperly (2007) deployed them on 15 by-caught loggerhead turtles in the North Atlantic
Ocean and found that lightly hooked turtles may not suffer any additional mortality after
release. Despite these important functions, the major drawback of PAT tags is that they
only transmit signals when they surface, thus providing only one position datum (the tag
surface position).
5. Multi-disciplinary telemetry studies
5.1 Combination the satellite telemetries with oceanographic features
Multi-disciplinary telemetry studies combine telemetering devices with other techniques,
sensors and oceanographic instruments for sea turtle research. With advances in image
processing in recent years, we can combine migration route data with oceanographic
features like chlorophyll distribution, sea surface height, temperature, salinity, etc. Then, the
influence of oceanographic features on sea turtle behaviors becomes graphically evident.
Saba et al. (2008) found that ENSO, by influencing the abundance of major food sources,
specifically jellyfish for leatherback turtles, determines the number in the nesting population
in the next year; warm El Niño years had decreased nesting populations, while cold La Niña
years had greater nesting populations.
Recently, the focus of telemetry studies has shifted to the relationship between sea turtle
migration and currents. From the physiological point of view, migration routes of sea turtles
are influenced by the distance to food sources (Godley et al., 2003). For example, in order to
save energy on long-distance trips, sea turtles may divide migration routes into several
sections and feed during the migration to reduce the energy depletion and replenish body
energy reserves (Alerstan et al., 2003).
Modern Telemetry
362
5.1.1 Qualitative evaluation the relationship between oceanographic features and
migration behavior
Physical features in the ocean, such as tidal currents can influence the migratory behavior
of sea turtles. Alerstan et al. (2003) believed that currents can be either beneficial or
negatively impact the long distance migration of sea turtles. Some recent studies even
estimate qualitatively the extent of current influence on the migration of sea turtles. For
example, in a recent review paper, Sale and Luschi (2009) pointed out that sea turtles
adjust their migration speed and direction to overcome the influence of currents to reach
their destinations. Recently, Hay’s research team fitted buoy tracks and particle drifts in
the ocean into a Lagrangian drifter model. They compared the model results with satellite
tracking trajectories of turtles, distributions of foraging areas, nesting sites and a genetic
map to prove that, after hatchling green turtles enter the sea, they drift with the current to
their distant foraging ground. Then, with the aid of surface current, they return to the
vicinity of their birth places to forage after reaching the size of immature juveniles (Hays
et al., 2010).
5.1.2 Quantitative evaluation the relationship between oceanographic features and
migration behavior
In addition to qualitative studies, some researchers try to determine quantitatively the
influence of current on the migration behavior of sea turtles. Most such studies are done by
fitting the migration data to numerical current models and determining their relationship.
The first publication of a model for turtle trajectories was done by Graper et al. (2006). They
found that leatherback turtles in the Atlantic Ocean swim either with, against or across the
current and forage in the dynamically active areas. They also suggested that the current has
a noticeable influence on the migration behavior of sea turtles. Cheng and Wang (2009)
compared the satellite tracking results from the post-nesting migration of green turtles from
Wan-an Island, Penghu Archipelago, Taiwan, with the current strength and direction on
each monitoring position from a sb-ADCP derived current model. They proved that the
tidal current in Taiwan Straits does influence the migration behavior of green turtles: some
migrated with the current to save energy; some migrated against the current, possibly using
it as directional cue, while others were deflected by the current. In addition, even though
they were able to adjust their speeds and directions when deflected by the current, they
were not able to compensate completely for the deflection. Kobayash et al. (2011) compared
the satellite telemetry from 34 by-caught loggerheads from pondnets in I-Lan County,
Taiwan, with oceanographic features (e.g. NOAA Pathfinder sea surface temperature (SST),
AVISO altimetry products - sea surface height, geostrophic u- and v-component, SeaWiFS
ocean colour, bathymetry) and Earth magnetic-field data from the IGRF-10 model (total
force, declination, inclination) and found that the East China Sea is their main region of
congregation, and they prefer to stay on the edges of eddies. Sea turtles migrate in the ocean
in three dimensions, sometimes diving down to hundreds of meters, and current strength
and direction may be different at different depths. The above quantitative studies assumed
that the animal swims entirely in the surface water, which is not true. Thus, there is a need
to include diving data in the numerical models, as well as the migration speed, in order to
determine the “true” influence of ocean currents on the migration of sea turtle.
In addition to satellite telemetry, combinations of other instruments have also been used to
discover sea turtle migration patterns and diving behaviors. By combining TDR and
Sea Turtle Research
363
electrocardiograph studies, Southwood et al. (1999) confirmed the increase in heart rate
while leatherback turtles are air breathing during surface emergence. Makawski et al. (2006)
used ultrasonic pinger with TDR recording and found that the home range of immature
green turtles in offshore Florida waters is related to the distribution of seagrass meadows.
They forage there during daytime and rest as well as avoid predators there in the night. All
these results emphasize the importance of multi-disciplinary approaches for acquiring full
understanding of the life history traits of sea turtles.
6. Telemetry studies for sea turtle conservation
6.1 By-catch post-release survivorship studies
Sea turtles spend the majority of their lives in the sea, only emerging on beaches to nest.
Despite the intense conservation efforts on the beaches, some populations have still declined
to the edge of extinction. Results of population stochastic model analyses, such as elastic and
deterministic models (e.g. Heppell et al., 1998), show that fisheries by-catch is the major
source of mortality. Therefore, understanding of the interaction between the sea turtles and
fisheries is the key to solving the conservation problem. Telemetry, especially satellite
telemetry, can be a useful tool for this purpose. Pop-up PAT tags described in the previous
section were used to determine the post-release survivorship of by-caught turtles. Snoody
and Williard (2010) combined satellite telemetry results and evaluated plasma biochemistry
of post-release Kemp’s ridley and green turtles caught in gillnets and found that
entanglement by the fishery can disrupt the homeostasis of physiological functions,
reducing their survivorship.
6.2 Identification of the “hot spot” regions in the ocean
In addition to study of the interaction of sea turtle migrations and diving behavior with
fishing gear, the aggregation of sea turtles in the open ocean identified by satellite telemetry
(so called “hot spots”) can also act as a focal point for conservation measures. Polovina et al.
(2006) used SDR and oceanographic features (chlorophyll and geostrophic current) to prove
that oceanic regions, specifically the KEBR (Kuroshio Extension Bifuration Region),
represent an important forage habitat for loggerheads. They suggested that conservation
efforts should focus on identifying and reducing threats to the survivorship of loggerhead
turtles in that region of the North Pacific. Kobayash et al. (2011) trackedg 34 by-caught
loggerheads carrying conventional satellite PTT tags that had been released near eastern
Taiwan. They found that loggerhead hotspot areas are on the continental shelf next to the
Yangtze River and in coastal and pelagic areas next to Taiwan, China, Japan, and South
Korea. They noted that this area is also intensively fished, primarily by boats from China.
The incidental or targeted takes of loggerhead turtles by these and other fisheries over the
continental shelf need detailed investigation. Recently, GPS satellite telemetry was also
apply to this issue. For example, Schofield et al. (2010) used GPS satellite tags to determine
in fine scale the home range of loggerhead turtles nesting in Greece during their inter-
nesting interval. The improvement in accuracy of the positions provides important
information for delimiting and adjusting marine protected areas.
6.3 Application of the GIS (geographic information system)
With the popularization of GIS (geographic information system) since 2000, researchers
have tried to combine the migration data from this technique with relevant physical,
Modern Telemetry
364
chemical and biological oceanographic information, and to determine their relationships,
basically using mapping. For example Halpin et al. (2006) developed the OBIS-SEAMAP
(Ocean Biogeographic Information System-Spatial Ecological Analysis of Marine
Megavetebrate Animal Population) system in 2002, and they post the migration routes of
marine animals at large scales on ocean and weather feature maps in order to understand
the dynamics of animal populations. That not only serves research on animal biogeography,
but acts as a reference tool for resource management, marine conservation and popular
science education. Despite the fact that this system is still in the promotion stage, many
research teams have published their results using this system.
6.4 Global climate change effects
The effect of global climate changes on living organisms and ecosystems has become one of
the major scientific and social issues in recent years. For the marine environment, the rise in
temperature will change wind patterns and influence both marine productivity and the
survival of sea turtle populations (Reina et al., 2009). Besides, global climate change will also
influence surface current patterns. This will influence the foraging behavior of sea turtles
and the quality of their nesting environments, influencing the migration routes and
behaviors of sea turtles (Hawkes et al., 2009). Thus, long-term application of satellite
telemetry and relevant ocean features will provide valuable information on how sea turtles
come to cope with the ever changing environment. Because the influence of global climate
change is more pronounced in higher latitude regions than at lower latitudes, the
leatherback turtle appears to be an excellent candidate for this kind of study. Leatherback
turtles forage near the polar region and nest in tropical continents (López-Mendilaharsu et
al., 2009).
7. Biologging
7.1 Definition
Biologging is a miniature self-recording device that attaches to an animal, records its
behavior, physiological condition and nearby environmental information (Rutz and Hays,
2009). The collected data either transmits via antenna or is stored and decoded after the
device is retrieved. Because it is not necessary to observe the animal directly, these devices
are usually used to study animal behaviors that are difficult to track, especially those of
endangered species.
7.2 New tools to study the behavioral ecology of the animal
Biologging research started in the 1960s’ and 1970s’ (Koyman, 2004) and has expanded
substantially in the last 20 years. With the advances of computer technologies, these devices
have become lighter and smaller, while their function improved greatly and memory
capacity (e.g. allowing increased sampling frequency). The sensors on the device, such as
oxygen content, pH, stomach temperature meters, have also increased substantially. In
addition, the development of software to analyze the large quantity of data allows scientists
to conduct more sophisticated research on the behavior of large animals, and to an extent on
small animals as well (e.g. jellyfish; Lilley et al., 2009). With more accuracy in the data and
improvement in the software to analyze the relevant environmental information, the
researchers can obtain important details of animal behavior in the wild. These kinds of
device act as diaries that faithfully record the animal’s activities during the deployment
Sea Turtle Research
365
period and lead to possible explanations. Therefore, an entire field has opened in biologging
research (e.g. Rutz and Hays, 2009). For example, Hochscheid et al. (2010) found, based on
the diving data from SRDL, that the extended surface drifting period of the loggerheads in
the Mediterranean is related to breathing and the absorption of solar energy to assist in
digestion and to increase body temperature for deep dives.
Biologging-related research has increased substantially since the First International
Symposium on Biologging Science in 2003. Because biologging systems allow us to record
much unnoticed behavior, it cans both determine the relationship between the animal
behavior and the environment and bring new explanatory power to the field of behavioral
ecology (Cheng, 2010). Sea turtles are oceanic migratory animals and are difficult to track
directly. Thus, one can use biologging data to obtain much greater understanding of sea
turtle behavior in the wild.
8. Conclusion
Sea turtles are ocean-wide, long-distance migrating reptiles that spend more than 95% of
their time at sea. The study of migratory behavior is important to demographic studies,
dynamics of marine ecosystem and conservation measures of these marine reptiles .
Telemetry devices developed since the late 70’s, enhancing our understanding of sea turtle
migratory mechanism substantially. In addition to conventional satellite tags, directional
radio and sonic telemetry and ultrasonic-pinger were also developed in 1980’s. However,
the low resolution and labor-intense efforts limited their developments. The retrievable
device—TDR developed since 1980’s enables us to interpret the diving behavior of sea turtle
in great detail. With the advancement of computer technologies, the new generation of non-
retrievable satellite tags allows more sensors add to the satellite tags, thus enhance the tag
performance. The combination of the oceanographic instruments with the satellite
telemetries allows researchers to conduct multi-disciplinary approach to study the sea turtle
migratory behavior, both qualitatively and quantitatively. These approaches allow us to
conduct proper conservation measures in the ocean. The miniature, high resolution and
multi-function telemetry tags emerges the biologging concept and may bring new
explanatory power to the field of behavioral ecology.
9. Acknowledgements
Author thanks the students and assistants from Marine Ecology and Conservation Laboratory
at Institute of Marine Biology, National Taiwan Ocean University, Taiwan for their assistants
in the field works. Author especially thanks Mr. George H. Balazs, from Pacific Islands
Fisheries Science Center, National Marine Fisheries Services, NOAA, US for his selfless
introduce into this field and provides all the necessary assistants. The telemetry studies in
Taiwan were mainly supported by grants from National Science Council, Department of
Forestry, Council of Agriculture and I-Mei Environmental Protection Foundation.
10. References
Addison, DS, JA. Gore, J. Ryder, and K. Worley. “Tracking Post-nesting Movements of
Loggerhead Turtles (Caretta caretta) with Sonic and Radio Telemetry on the
Southwest Coast of Florida, U.S.A.,” Marine Biology 141 (2002): 201-205.
Modern Telemetry
366
Alerstan, T, A. Hedenström, and S. Akesson. “Long-distance Migration: Evolution and
Determinants,” Oikos 103 (2003): 247-260.
Argos. User’s Manual. Version 1.0 January 1996. Service Argos, Inc. Toulouse, France, 1996.
Bjorndal, KA, and JBC. Jackson. “Chap. 10. Roles of Sea Turtles in Marine Ecosystems:
Reconstructing the Past,” In The Biology of Sea Turtles, Vol. II, edited by Lutz, PL,
JA. Musick, and J. Wyneken, 259-273. New York: CRC Press, 2003.
Bolten, AB. “Chap. 9. Variation in Sea Turtle Life History Patterns: Neritic vs. Oceanic
Developmental Stages.” In The Biology of Sea Turtles, Vol. II, edited by Lutz, PL,
JA. Musick, and J. Wyneken, 243-257. New York: CRC Press, 2003.
Bolten, AB, KA. Bjorndal, HR. Martins, T. Dellinger, MJ. Biscotto, SE. Encalada, and BW.
Bowen. “Transaltanic Developmental Migrations of Loggerhead Sea Turtles
Demonstrated by mtDNA Sequence Analysis,” Ecological Application 8 (1998): 1-7.
Bowen, BW, AB. Melyan, JP. Ross, CJ. Limpus, GH. Balazs, and JC. Avise. “Global
Population Structure and Natural History of the Green Turtle (Chelonia mydas) in
Terms of Matriarchal Phylogeny,” Evolution. 46 (1992): 865-881.
Bowen, BW, FA. Abreu-Grobois, GH. Balazs, N. Kamezaki, CJ. Limpus, and RJ. Ferl. “Trans-
Pacific Migrations of the Loggerhead Sea Turtle Demonstrated With Mitochondrial
DNA Markers,” Proceedings of National Academy of Science USA 92 (1995):3731-
3734.
Boye, JL. “The Behavioural and Physiology Ecology of Diving,” TREE 266 (1997): 213-217.
Brauna, J, SP. Epperly, and JA. Collazo. “Evaluation of a sonic Telemetry System in Three
Habitats of an Estuarine Evironment,” Journal of Experimental Marine Biology and
Ecology 212 (1997): 111–121.
Carr, A. So Excellent a Fishe: A Natural History of Sea Turtles. Scribner Publishers. New
York, 1967.
Carr, A. “Some Problems of Sea Turtle Ecology.” American Zoology 20 (1980): 489-498.
Carr, A, and RE. Schroder. “Caribbean Green Turtle, Imperiled Gift of the Sea,” National
Geographic Journal. 131 (1967): 876-890.
Casey, JJ, JJ. Garner, SS. Garner, and AS. Williard. 2010. “Diel Foraging Behavior of Gravid
Leatherback Sea Turtles in Deep Waters of the Caribbean Sea,” Journal of
Experimental Biology 213 (2010): 3961-3971.
Cheng, I-J. Post-nesting Migrations of Green Turtle (Chelonia mydas) at Wan-An Island,
Penghu Archipelago, Taiwan,” Marine Biology 137 (2000): 747-754.
Cheng, I-J. “Changes in Diving Behaviour During the Internesting Period by Green Turtles,”
Journal of Experimental Marine Biology and Ecology 381 (2009): 18-24.
Cheng, I-J. Green Turtle—Follow the Sea Turtle Professor to Search for Green Turtle.
Taiwan: Morning Star Publishing Co. 2010.
Cheng, IJ, YH. Wang. “Influence of Surface Currents on Post-nesting Migration of Green Sea
Turtles Nesting on Wan-an Island, Penghu Archipelago, Taiwan,” Journal of
Marine Science and Technology 17(4) (2009): 306-311
Cochran, WW, and RD. Lord Jr. “A Radio-tracking System for Wild Animals,” Journal of
Wildlife Management 27(1) (1963): 1963: 9-24.
Crouse, DT, LB. Crowder, and H. Caswell. “A Stage-Based Population Model for
Loggerhead Sea Turtles and Implications for Conservation,” Ecology 68
(1987):1412–1423.
Sea Turtle Research
367
Van Dam, RP, and CE. Diez. “Diving Behavior of Immature Hawksbill (Eretmochelys
imbricate) in a Caribbean Cliff-wall Habitat,” Marine Biology 127 (1996): 171-178.
Dizon, AE, and GH. Balazs. “Radio Telemetry of Hawaiian Green Turtles at Their Breeding
Colony,” Marine Fisheries Review 44 (1982): 13-20.
Eckert, SA, DW. Nellis, KL. Eckert, and GL. Kooyman. “Diving Patterns of Two Leatherback
Sea Turtles (Dermochelys coriacea) During Internesting Intervals at Sandy Point, St.
Croix, U.S. Virgin Islands,” Herpetologica 42(3) (1986): 381-388.
Epperly, SP, J. Wyneken, J. Flanagan, CA. Harms, and B. Higgins. “Attachment of Popup
Archival Transmitting (PAT) Tags to Loggerhead Sea Turtles (Caretta caretta),”
Herpetological Review 38(4) (2007): 419-425.
Fossette, S, P. Gaspar, Y. Handrich, Y. Le Maho, and J-Y. Georges. “Dive and Beak
Movement Patterns in Leatherback Turtles Dermochelys coriacea During Internesting
Intervals in French Guiana,” Journal of Animal Ecology 77 (2008): 236-246.
Fuller, MR, WS. Seegar, and LS. Schueck. “Routes and Travel Rates of Migrating Peregrine
Falcons Falco peregrinus and Swainson's Hawks Buteo swainsoni in the Western
Hemisphere,” Journal of Avian Biology 29(4) (1988): 433-440.
Gaspar, P, JY. Georges, S. Fossette, A. Lenoble, S. Ferraroli, and YL. Maho. “Marine Animal
Behaviour: Neglecting Ocean Currents Can Lead us Up the Wrong track,”
Proceedings of the Royal Society B, 3623 (2006): 1-5.
Godley, BJ, AC. Broderick, F. Glen, and GC. Hays. “Post-nesting Movements and
Submergence Patterns of Loggerhead Marine Turtles in the Mediterranean
Assessed by Satellite Tracking,” Journal of Experimental Marine Biology and
Ecology 287 (2003): 119-134.
Godley, BJ, JM. Blumenthal, AC. Broderick, MS. Cyone, MH. Godfrey, LA. Hawies, and MJ.
Witt. “Satellite Tracking of Sea Turtles: Where Have We Been and Where Do We
Go Next?” Endangered Species Research 4 (2008): 3-22.
Hamel, MA, CR. McMahon, CJA. Bradshaw. “Flexible Inter-nesting Behaviour of Generalist
Olive Ridley Turtles in Australia,” Journal of Experimental Marine Biology and
Ecology 359 (2008): 47-54.
Halpin, PN, AJ. Read, BD. Best, KD. Hyrenbach, E. Fujioka, MS. Coyne, LB. Crowder, SA.
Freeman, and C. Spoerri. “OBIS-SEAMAP: Developing a Biogeographic Research
Data Commons for the Ecological Studies of Marine Ammals, Seabirds, and Sea
Turtles,” Marine Ecology Progress Series 316 (2006): 239-246
Hawkes, LA, AC. Broderick, MS. Coyne, MF. Godfrey, L-F. Lopez-Jurado, P. Lopez-Suarez,
SE. Marino, N. Vero-Cruz and BJ. Godley. “Phenotypically Linked Dichotomy in
Sea Turtle Foraging Requires Multiple Conservation Approaches,” Current Biology
16 (2006): 990-995.
Hays, GC, JD. Metcalfe, and AW. Walne. “The Implications of Lung-regulated Buoyancy
Control for Dive Depth and Duration,” Ecology 85(4) (2004): 1137-1145.
Hays, GC, R. Adams, AC. Broderick, BJ. Godley, DJ. Lucao, JD. Metacalfe, and AA. Prior.
2000. “The Diving Behavior of Green Turtles at Ascension Island,” Animal
Behavior 59 (2000): 577-586.
Hays, GC, AC. Broderick, F. Glen, BJ. Godley, and WJ. Nichols. “The Movements and
Submergence Behaviour of Male Green Turtles at Ascension Island,” Marine
Biology 139 (2001): 386-399.
Modern Telemetry
368
Hays, GC, TK. Doyle, JR. Houghton, MKS. Lilley, JD. Metcafle, and D. Righton. 2008.
“Diving Behaviour of Jellyfish Equipped with Electronic Tags,” Journal of Plankton
Research 30 (2008): 325-331.
Hays, GC, S. Fossette, KA. Katselidis, P. Mariani, G. Schofield. “Ontogenetic Development
of Migration: Lagrangian Drift Tajectories Suggest a New Paradigm for Sea
Turtles,” Journal of Royal Society of Interface 7 (2010): 1319-1327.
Heppel, SS, CJ. Limpus, DT. Crouse, NB. Frazer, and LB. Crowder. “Population Model
Analysis for the Loggerhead Sea Turtle, Caretta caretta, in Queensland,” Wildlife
Research 23(2) (1998): 143 – 161.
Hoscheid, S, BJ. Godley, AC. Broderick, and RP. Wilson. “Reptilian Diving: Highly Variable
Dive Patterns in the Green Turtle Chelonia mydas,” Marine Ecology Progress Series
185 (1999): 101-112.
Hochscheid, S, F. Bentivegna, A. Hamza, and GC. Hays. 2010. “When Surfacers Do Not
Dive: Multiple Significance of Extended Surface Times in Marine Turtles,” Journal
of Experimental Biology 213 (2010): 1328-1337.
Houghton, JDR, AC. Broderick, BJ. Godley, JD. Metcalfe, and GC. Hays. “Diving Behaviour
During the Internesting Interval for Loggerhead Turtle Caretta caretta Nesting in
Cyprus,” Marine Ecology Progress Series 237 (2002): 63-78.
Howell, EA, PH. Dutton, JJ. Polovina, H. Bailey, DM. Parker, and GH. Balazs.
“Oceanographic Influences on the Dive Behavior of Juvenile Loggerhead Turtles
(Caretta caretta) in the North Pacific Ocean,” Marine Biology 157 (2010):1011–1026.
Hughes, GR, P. Luschi, R. Mencacci, and F. Papi. “The 7000-km Oceanic Journey of a
Leatherback Turtle Tracked by Satellite,” Journal of Experimental Marine Biology
and Ecology 229 (1998): 209-217.
Hutchinson, J, and M. Simmonds. “Escalation of Threats to Marine Turtles,” Oryx 26 (1992):
95-102.
IUCN, 2003. 2003 IUCN Red List of Threaten Species. International Union for Nature and
Natural Resources Conservation.
Kobayash, DR, I-J. Cheng, DM. Parker, JJ. Polovina, N. Kamezaki, and GH. Balazs.
“Loggerhead Turtle (Caretta caretta) Movement off the Coast of Taiwan:
Characterization of a Hotspot in the East China Sea and Investigation of Mesoscale
Eddie,” ICES Journal of Marine Sciemce 68(4) (2011): 704-718.
Liew, H-C, and E-H. Chan. “Biotelemetry of Green Turtles (Chelonia mydas) in Pulau
Redang, Malaysia, During the Internesting Period,” Biotelemetry XII (1992).
Lilley, MKS, JDR. Houghton, and GC. Hays. “A Review of Distribution, Extent of Inter-
annual Variability and Diet of the Bloom-forming Jellyfish Rhizostoma in European
Waters,”Journal of Marine Biology Association United Kingdom 89 (2009): 39-48.
López-Mendilaharsu, M, CFD. Rocha, P. Miller, A. Domingo, and l. Prosdocimi. “Insights on
Leatherback Turtle Movements and High Use Areas in the Southwest Atlantic
Ocean,” Journal of Experimental Marine Biology and Ecology 378 (2009): 31-39.
Lutcavage, ME, and PL. Lutz. “Diving Physiology.” In The Biology Of Sea Turtles, edited by
Lutz, PL, and JA. Musick, 277-296. Boca Raton: CRC Press, 1997.
Plotkin, P. “Chap. 8. Adult migrations and habitat use,” In The Biology of Sea Turtles, Vol.
II, edited by Lutz, PL, JA Musick, and J. Wyneken. 205-240, New York: CRC Press,
2003.
Sea Turtle Research
369
Pritchard, PCH. “Chap. 1. Evolution, Phylogeny and Current Status.” In The Biology of Sea
Turtles, edited by Lutz PL, and JA. Musick. 1-28, New York: CRC Press, 1997.
Rice, MR, and GH. Balazs. “Diving Behavior of the Hawaiian Green Turtle (Chelonia mydas)
During Oceanic Migration,” Journal of Experimental Marine Biology and Ecology
356 (2008): 121-127.
Rutz, C, and GC. Hays. “New Frontiers in Biologging Science,” Biology Letter 5 (2009):289–
292.
Saba, VS, GL. Shillinger, AM. Swithenbank, BA. Block, JR. Spotila, JA. Musick, and FV.
Paladino. 2008. “An Oceanographic Context for the Foraging Ecology of Eastern
Pacific Leatherback Turtles: Consequences of ENSO,” Deep-Sea Research I, 55
(2008): 646-660.
Sale, A, and P. Luschi. “Navigational Challenges in the Oceanic Migrations of Leatherback
Sea Turtle,” Proceedings of Royal Society B 276 (2009): 3737–374
Sasso, CR, and SP. Epperly. “Survival of Pelagic Juvenile Loggerhead Turtles in the Open
Ocean,” Journal of Wildlife Management 71(6) (2007): 1838-1835.
Schofield, G, CM. Bishop, KA. Katselidis, P. Dimopoulos, JD. Pantis, and GC. Hays. 2009.
“Microhabitat Selection by Sea Turtles in a Dynamic Thermal Marine
Environment,” Journal of Animal Ecology 78 (2009): 14–22.
Schofield, G, VJ. Hobson, MKS. Lilley, KA. Katselidis, CM. Bishop, P. Brown, and GC. Hays.
“Inter-annual Variability in the Home Range of Breeding Turtles: Implications for
Current and Future Conservation Management,” Biological Conservation 143
(2010):722–730
Seminoff, JA, TT. Jones, and GJ. Marshall. “Underwater Behavior of Green Turtles
Monitored With Vedio-time-recorders: What’s Missing from Dive Profile?” Marine
Ecology Progress Series 322 (2006): 269-280.
Shaver, DJ, and C. Rubio. “Post-nesting Movement of Wild and Head-started Kemp’s Ridley
Sea Turtles Lepidochelys kempii in the Gulf of Mexico,” Endangered Species Research
4 (2008): 43-55.
Snoddy, JE, and AS Williard. “Movements and Post-release Mortality of Juvenile Sea Turtles
Released from Gillnets in the Lower Cape Fear River, North Carolina, USA,”
Endangered Specie Research 12 (2010): 235–247.
Southwood, A, and L. Avens. “Physiological, Behavioral, and Ecological Aspects of
Migration in Reptiles,’ Journal of Comparative Physiology B 180 (2010):1–23.
Southwood, AL, RD. Andrew, ME. Lutcage, FV. Paladino, NH. Wes, RH. George, and DR.
Jones. “Heart Rate and Diving Behavior of Leatherback Sea Turtles in the Eastern
Pacific Ocean,” Journal of Experimental Biology 202 (1999): 1115-1125.
Southwood, AL, RD. Andrews, FV. Palodino, and DR. Jones. “Effects of Diving and
Swimming Behavior on Body Temperature of Pacific Leatherback Turtles in
Tropical Seas,” Physiology, Biochemistry and Zoology 78(2) (2005): 285-297.
Stoneburner, DL. 1982. “Satellite Telemetry of Loggerhead Sea Turtle Movement in the
Georgia Bight,” Copeia (1982): 400-408.
Storch, S, R. Pwilson, Z-M. Hills-Starr, and D. Adolung. “Cold-blooded Divers:
Temperature-dependent Dive Performance in the Wild Hawksbill Turtle
Eretmochelys imbricate,” Marine Ecology Progress Series 293 (2005): 263-271.
Modern Telemetry
370
Taillade, M. “Chap. 21. Animal tracking by satellite.” In Wildlife Telemetry, Remote
Monitoring and Tracking of Animals, edited by Priede, IG, and SM. Swift, 149-160.
New York: Ellis Horwood Ltd., 1992.
Timko, RE, and AL. Kolz. “Satellite Sea Turtle Tracking,” Marine Fishery Review 44(4)
(1982): 19-24.
Wyneken, J, SV. Madrak, M. Salmon, and J. Foote. “Migratory Activity by Hatchling
Loggerhead Sea Turtle (Caretta caretta): Evidence for Divergence Between Nesting
Groups,” Marine Biology 156 (2008): 171-181.
18
Movements and Habitat Use by Lake
Sturgeon (Acipenser fulvescens) in an
Unperturbed Environment: A Small Boreal
Lake in the Canadian Shield
Terry A. Dick
1
, D. Block
2
and Dale Webber
3
1
Department of Biological Sciences, University of Manitoba, Winnipeg, Manitoba
2
Department of Highways, Province of Manitoba
3
Vemco, Division of Amirix, Halifax Nova Scotia
Canada
1. Introduction
The order Acipenseriformes, belonging to a group of basal Acthopterygian fishes
(Choudhury and Dick 1998), has two living families (Acipenseridae and Polyodontidae), 6
genera, and 26 species worldwide (Nelson and Paetz, 1992; Nelson 1994). The Acipenseridae
are old with the fossil record of sturgeon like fish dating back 100 million years to the upper
Cretaceous (Harkness and Dymond 1961, Fogle 1975, Pearce 1986, Mecozzi 1988,
Choudhury and Dick 1998). Fossils of an extinct family, the chondrosteidae, are dated from
the lower Jurassic to the lower Cretaceous (Scott and Crossman 1998). Other authors state
that sturgeon species are primitive relicts of the Devonian period 300 million years ago
(Glover 1961, Ono et al. 1983, Houston 1987). Choudhury and Dick (1998) suggest that
acipenserids diversified within a narrow time frame and lapsed into a subsequent long
period of morphologica1 stasis.
The lake sturgeon has the most local names of al1 North American sturgeon species. These
names include: rock, common, red, ruddy, Ohio, stone, shell-back, bony, freshwater,
smooth-back, rubbernose, black, dogface, bull-nosed and Great Lakes sturgeon (Harkness
and Dymond 1961, Williams and Vondett 1962, Scott and Crossman 1998), Pearce 1986,
Mecozzi 1988).
The decline of sturgeon populations throughout the world (Bemis and Findeis, 1994) and in
North America is well documented. Population numbers plummeted around the turn of the
20
th
century as a result of over-fishing (Prince, 1905, Dick et al. 1998). The continued decline
of populations across Canada is due to a variety of factors including habitat loss, continued
fishing pressure in the form of commercial, sport, and subsistence fisheries. Consequently,
the Committee on the Status on Wildlife in Canada (COSEWIC) raised major concerns on
the status of the species and a report was written for Canada by Dick et al. (2006a).
Considerable effort has gone into sturgeon research over the past two decades and since
then the understanding of lake sturgeon biology and habitat use has improved, facilitating
the possible rehabilitation of some populations. The Manitoba records on lake sturgeon
population declines are relatively complete because there are good historical records for lake
Modern Telemetry
372
sturgeon harvests from commercial fisheries (Prince, 1905; Bajkov and Neave, 1930; Baldwin
et al. 1979, Choudhury et al. 1990), and the aboriginal communities have a strong knowledge
base and a long fishing and cultural connection to sturgeon (Holzkamm and Wilson, 1988;
Dick et al. 2002).
Information on lake sturgeon (Acipenser fulvescens) in North America was first compiled by
Dick and Choudhury (1992). A considerable amount of new data has been accumulated
since the early 1990s on lake sturgeon in North America and in Canada (Dick et al. 2006b).
This document clearly shows that the national trends for lake sturgeon populations are a
general decrease in numbers with some of the decline attributed to environmental
perturbation. However, not all declines are due to environmental perturbations, for
example, the recent decision by the Province of Quebec to reduce the commercial fishery
quota on what was considered viable stocks indicates that commercial fishing still has a
major impact on a few sturgeon populations (Dick et al. 2006a). Furthermore, continued
fishing of any sort on numerous sturgeon stocks across Canada will have a detrimental
affect on their chances of survival. According to current information there are atleast six
distinct genetic stocks across Canada, therefore rehabilitation programs will be limited by
restrictions on the transfer of stocks across major watersheds (Ferguson and Duckworth,
1997; Ferguson et al. 1993).
Today, a substantial amount of information is available on the general state of most lake
sturgeon populations across Canada and the United States, the natural fragmentation of
sturgeon populations, and how to retrospectively view lake sturgeon distributions. We also
have some idea of what constitutes “good” sturgeon habitat, the habitat by juvenile
sturgeon in natural systems (Chiasson et al. 1997; Barth et al. 2009), and new information on
genetic diversity and rare phenotypes of lake sturgeon in a Canadian contex (Ferguson and
Duckworth 1997; Ferguson et al. 1993).
The objectives of this study were to develop methods to study movements and habitat use
by lake sturgeon, especially subadults and juveniles and develop tags that provide data on
specific activities such as feeding. This study was designed to collect data on lake sturgeon
movements and then to attempt to define habitat by describing substrate and currents in the
vicinity of their movements. The Pigeon River was chosen because there was a relatively
confined population in Round Lake, which would allow for fine scale movements to be
assessed without the complications of immigration and emigration. Most of the data on which
this chapter is based is from research conducted in Round Lake, Manitoba, Canada and
from the laboratory of T. Dick at the University of Manitoba. No attempt was made in this
chapter to provide a complete literature review of lake sturgeon as this has been published
elsewhere (Dick et al. 2006b).
Round Lake study area: Round Lake is located on the Pigeon River which flows from Family
Lake to Lake Winnipeg (Fig. 1). It is a small isolated lake in eastern Manitoba, Canada that
was never commercially fished and consequently has remained a relatively unperturbed
and an important reference lake for lake sturgeon studies. The study area included the
Pigeon River in the vicinity of Round Lake, areas upstream from the lake to the first set of
falls, Grant Falls, and downstream of the lake to the first set of falls. Round Lake has a
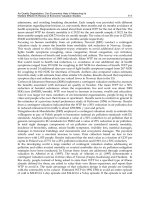
typical boreal lake fish species compositions plus lake sturgeon. The fish species composition
in Round Lake is illustrated in Fig. 2. Diets of fish species collected from Round Lake are
presented in (Fig. 3) and lake sturgeon consumed mostly mayflies, clams and amphipods
(based on the gavage method, see Dick (2004). Lake sturgeons are about 10% of the fish
community based on catch per unit effort.
Movements and Habitat Use by Lake Sturgeon (Acipenser fulvescens)
in an Unperturbed Environment: A Small Boreal Lake in the Canadian Shield
373
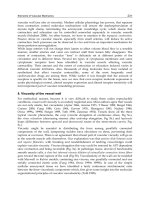
Fig. 1. Map of the Pigeon River, from Family Lake to Lake Winnipeg.
Fig. 2. The composition of fish Fig. 3. The abundance of prey items in the
species in Round Lake. stomach contents of each individual species of
fish in Round Lake.
0
5
10
15
20
25
30
35
Other
WhtSucker
Pike
Redhorse
Sauger
Walleye
Mooneye
Perch
Sturgeon
Round Lake Fish Species
Percent Total Catch
0
10
20
30
40
50
60
70
80
90
100
Ephemeridae
Gomphidae
Siphlonuridae
Hydropsychidae
Chironomidae
Gammaridae
Pelycapoda
Gastropoda
Corixidae
Notonectidae
fish
Prey Category
Percent Total Abundance
Perch
Walleye
Sauger
Mooneye
Pike
suckers
Modern Telemetry
374
2. Telemetry technologies
2.1 Comparison of radio and acoustic tag technologies
Radio and acoustic telemetry were the two methods used to study animal movements but
there are differences in their applications and the type of data acquired. Acoustic signals
must be received underwater while radio signals are received in the air. Data from radio
tags can be received from boats, airplanes and through the ice and is best for large scale
studies where animals move considerable distances but is usually less precise in terms of
location and is also labour intensive, especially the way we applied it. Both types of tags
provide repeat data. Acoustic receivers are more precise (especially the VRAP system of
Vemco Ltd.) and tags can measure variables such as depth and temperature, and are good
for fine scale studies. Initially acoustic tags were large and the equipment was expensive
and cumbersome to handle due to bulk and weight. More recently tags and receivers have
been constructed that are reduced in size and the life of the tags has increased. Both radio
and acoustic tags can be detected with mobile receivers but precision in locating animals is
lower, for both systems, and there are usually fewer observations.
Gill nets were used to capture all lake sturgeon. Three different nets were used: 30 cm
stretched mesh, 22.5 cm stretched mesh and a standard gang with six panels (3.1, 5, 6.9, 8.8,
10.6, 12.5 cm stretched mesh). Fish were brought to shore and placed on a damp canvas
sheet. Weight, length was recorded and on a few fish a pectoral fin ray was removed to
establish a size to age relationship.
This following section deals with a comparison between the two technologies. Both radio
and acoustic tags were attached externally to the dorsal fin. For short term studies over
days or a few months, external tags are adequate but for longer term studies of several
years internally implanted tags are necessary. Radio tags were obtained from Lotek,
Missassauga, Ontario, Canada and the acoustic tags were obtained from Vemco Ltd.
(Halifax, Nova Scotia). Two types of acoustic tags were used. Large fish were tagged with
V16 pressure tags, the remaining fish were tagged with V8 position tags. Pressure tags
transmitted information on swimming depth as well as positional information. The V8
tags transmitted positional data. The tag weight to body weight ratio for both radio and
acoustic telemetry was less than 1% for all fish. A piece of neoprene was placed between
the tag and the dorsal fin and a piece of neoprene was placed on the opposite side of the
fin for support of the attachment wires. Two hypodermic needles, spaced apart the length
of the tag, were pushed through the neoprene backing and then through the dorsal fin of
the fish. The attachment wires were fed through the tag, through the second piece of
neoprene, and then through the needles. The needles were then pulled out pulling the
attachment wires through the fin and the neoprene on the opposite side of the fin. The
attachment wires were pulled snug and several knots were tied to secure the tag. Excess
wire was removed using wire cutters. Later, a 40 gauge neoprene was used between the
tag and the fin instead of the foam and neoprene also replaced the foam and plastic
backing on the opposite side. This method gave a tighter fit for the tag when tested by
hand, however there was no tag loss using either method. The radio tags were
manufactured by Lotek Engineering, Missassauga, Ontario, Canada. All tools were
sterilized before use and salt was applied to the tagged area after the procedure to reduce
infection. Lake sturgeons, after attaching external tags, were held in a holding net placed
in the lake at a depth of 2.0 meters. Fish remained inactive for periods of 20 to 40 minutes
but as soon as normal swimming behaviour was observed they were released.
Movements and Habitat Use by Lake Sturgeon (Acipenser fulvescens)
in an Unperturbed Environment: A Small Boreal Lake in the Canadian Shield
375
Fig 4. Diagram of the Vemco Fig. 5. Location of the two acoustic arrays in
(VRAP) system. Round Lake.
Precise positioning of lake sturgeon was done using two radio linked acoustic positioning
arrays (VRAP, Vemco Ltd.). Each array consisted of a base station which communicated
with each of three buoys anchored in the lake (Fig. 4). Each buoy contained an acoustic
transmitter, an omnidirectional hydrophone, and a VHF modem.
Buoy location was determined using survey techniques and having an understanding of the
lake morphometry so that there was a clean line of site between receivers so that a tag signal
was picked up by atleast two receivers. Test tags determined if a signal could not be picked
up by a receiver due to an under water obstruction, such as a boulder, and if the receiver
was obstructed it was re-positioned. The chosen positions covered 80% of the surface area of
the lake. Figure 5 shows the distribution of the two 3-receiver arrays.
2.2 Telemetry data
Telemetry data analysis and presentation was done using Idrisi for Windows (Clark
University, MA). Some maps were created in Idrisi for Windows. Acoustic telemetry data
was imported from the VEMCO system program.
Determination of depth selection and substrate selection was done by hand. Seven days
were selected for analysis. Selection was based on movements to include the widest possible
range of movement patterns. Days 206 and 221 were selected for sturgeon 4014. Days 210
and 222 were selected for sturgeon 4015. Days 206, 211 and 219 were selected for sturgeon
4017. For each location on each day bottom depth was determined.
Swimming depth minus bottom depth was calculated to determine all locations in which the
fish was in contact with the substrate. All values of 1 or less were included. All figures and
comments pertaining to substrate selection only include locations in which a fish was in
contact with the bottom. Other location statements and figures used all the positional data
available.
Radio tags: These tags were attached externally to the dorsal fin. Initially, a piece of foam was
placed between the tag and the dorsal fin and a piece of foam and a plastic backing were
placed on the opposite side of the fin for support of the attachment wires. Details on tag
attachment are outlined above.
BASE
STATION