Heat Analysis and Thermodynamic Effects Part 5 doc
Bạn đang xem bản rút gọn của tài liệu. Xem và tải ngay bản đầy đủ của tài liệu tại đây (525.22 KB, 30 trang )
On the Thermal Transformer Performances
109
3. Hierarchical decomposition
There are three technical system decomposition types. The first is a physical decomposition
(in equipment) used for macroscopic conceptual investigations. The second method is a
disciplinary decomposition, in tasks and subtasks, used for microscopic analysis of mass
and heat transfer processes occurring in different components. The third method is a
mathematical decomposition associated to the resolution procedure of the mathematical
model governing the system operating mode (Aoltola, 2003).
The solar absorption refrigeration cycle, presented on Fig. 1 (Fellah et al., 2010), is one of
many interesting cycles for which great efforts have been consecrated. The cycle is
composed by a solar concentrator, a thermal solar converter, an intermediate source, a cold
source and four main elements: a generator, an absorber, a condenser and an evaporator.
The thermal solar converter constitutes a first thermal motor TM
1
while
the generator and
the absorber constitute a second thermal motor TM
2
and the condenser and the evaporator
form a thermal receptor TR. The exchanged fluxes and powers that reign in the different
compartments of the machine are also mentioned. The parameterization of the cycle
comprises fluxes and powers as well as temperatures reigning in the different compartments
of the machine.
The refrigerant vapor, stemmed from the generator, is condensed and then expanded. The
cooling load is extracted from the evaporator. The refrigerant vapor, stemmed from the
evaporator, is absorbed by the week solution in the absorber. The rich solution is then
decanted from the absorber into the generator through a pump.
The number of the decomposition levels must be in conformity with the physical bases of
the installation operating mode. The mathematical identification of the subsystem depends
on the establishment of a mathematical system with nil degree of freedom (DoF). Here, the
decomposition consists in a four levels subdivision. The first level presents the compact
global system which is a combination of the thermal motors TM
1
and TM
2
with the thermal
receptor TR. After that, this level is decomposed in two sublevels the thermal converter TM
1
and the command and refrigeration system TM
2
+TR. This last is subdivided itself to give the
two sublevels composed by the thermal engine TM
2
and the thermal receptor TR. The fourth
level is composed essentially by the separated four elements the generator, the absorber, the
condenser and the evaporator. For more details see Fellah et al., 2010.
4. Optimization problem formulation
For heat engines, power-based analysis is usually used at maximum efficiency and working
power, whereas the analysis of refrigerators is rather carried out for maximal cooling load.
Therefore, there is no correspondence with the maximal value of the coefficient of
performance COP. According to the objectives of the study, various concepts defined
throughout the paper of Fellah et al. 2006 could be derived from the cooling load parameter
e.g. the net Q
e
, the inverse 1/Q
e
, the inverse specific A/Q
e
cooling load.
For an endoreversible heat transformer (Tsirlin et Kasakov 2006), the optimization
procedure under constraints can be expressed by:
0
1
max ( , )
i
n
iii
u
i
PQTu
(1)
Heat Analysis and Thermodynamic Effects
110
Fig. 1. Working principle and decomposition of a solar absorption refrigerator cycle
Under the constraints:
1
(,)
0
n
iii
i
i
QTu
u
(2)
And
1
(,) (,)
n
i
jj
iiii
j
QTT QTu
i = 1,…,m (3)
where T
i
: temperature of the i
th
subsystem
Q
ij
: the heat flux between the i
th
and the j
th
subsystem
Q(T
i
, u
i
): the heat flux between the i
th
subsystem and the transformer
P: the transformer power.
The optimization is carried out using the method of Lagrange multipliers where the
thermodynamic laws constitute the optimization constraints. The endoreversible model
takes into account just the external irreversibility of the cycle, consequently there is a
minimization of the entropy production comparing to the entropy production when we
consider internal and external irreversibilities.
For a no singular problem described by equations (1 to 3), the Lagrange function can be
expressed as follows:
111 1 11
mn m n mn
i i ii ii i i
j
i
iim i im ij
LQ Q Qu Qu QQ
(4)
T
i
f
T
si
T
ia
T
ia
T
i
g
T
st
T
sc
T
si
T
sf
TM
1
TM
2
TR
P
ref
u
Q
gen
Q
con
d
Q
Q
eva
p
Q
abs
Generator
Eva
p
orator
Absorber
Condenser
Solar thermal
converter
Solar Concentrator
Intermediate
source
Intermediate
source
Cold source
P
fc
On the Thermal Transformer Performances
111
Where
i
and are the Lagrange multipliers, m is the number of subsystems and n is the
number of contacts.
According to the selected constraint conditions, the Lagrange multipliers λi are of two types.
Some are equivalent to temperatures and other to dimensionless constants. The refrigerant
temperatures in the condenser and the absorber are both equal to T
ia
. Thus and with good
approximation, the refrigeration endoreversible cycle is a three thermal sources cycle. The
stability conditions of the function L for i> m are defined by the Euler-Lagrange equation as
follows:
(,)(1 ) 0
iii i
ii
L
QTu u
uu
Where (i = m+1,…, n) (5)
5. Endoreversible behavior in permanent regime
5.1 Optimal characteristics
Analytical resolution delivers the following temperature distributions:
T
ig
/T
ia
= (T
st
/T
int
)
1/2
(6)
T
ie
/T
ia
= (T
cs
/T
int
)
1/2
(7)
T
st
/T
ia
= (T
sc
/T
int
)
1/2
(8)
Expressions (6 to 8) relay internal and external temperatures. Generalized approaches (e.g.
Tsirlin et Kasakov, 2006) and specific approaches (e.g. Tozer and Agnew, 1999) have derived
the same distributions.
The thermal conductances UA
i
, constitute the most important parameters for the heat
transformer analysis. They permit to define appropriate couplings between functional and
the conceptual characteristics. Considering the endoreversibility and the hierarchical
decomposition principles, the thermal conductance ratios in the interfaces between the
different subsystems and the solar converter, are expressed as follows:
UA
e
/ UA
st
= I
st
T
ie
1/2
(T
int
1/2
-T
st
1/2
) / I
e
T
sc
1/2
(T
ie
1/2
-T
int
1/2
) (9)
UA
g
/ UA
st
= I
st
T
st
1/2
/ I
g
T
sc
1/2
(10)
UA
c
/ UA
st
= I
st
T
int
1/2
(T
int
1/2
-T
st
1/2
) / I
a
T
sc
1/2
(T
ie
1/2
-T
int
1/2
) (11)
UA
a
/UA
st
=I
st
T
int
1/2
/I
a
T
sc
1/2
(12)
Where I
i
represents the i
th
interface temperature pinch.
The point of merit is the fact that there is no need to define many input parameters while the
results could set aside many functional and conceptual characteristics. The input parameters
for the investigation of the solar refrigeration endoreversible cycle behaviors could be as
presented by Fellah, 2008:
-
The hot source temperature T
sc
for which the transitional aspect is defined by Eufrat
correlation (Bourges, 1992; Perrin de Brichambaut, 1963) as follows:
T
sc
= −1.11t
2
+ 31.34t + 1.90 (13)
Heat Analysis and Thermodynamic Effects
112
where t represents the day hour.
- The cold source temperature T
sf
, 0◦C ≤ T
sf
≤ 15◦C
-
The intermediate source temperature T
si
, 25◦C ≤ T
si
≤ 45◦C.
For a solar driven refrigerator, the hot source temperature T
sc
achieves a maximum at
midday. Otherwise, the behavior of T
sc
could be defined in different operating, climatic or
seasonal conditions as presented in Boukhchana et al.,2011.
The optimal parameters derived from the simulation are particularly the heating and
refrigerant fluid temperatures in different points of the cycle:
-
The heating fluid temperature at the generator inlet T
if
,
-
The ammonia vapor temperature at the generator outlet T
ig
,
-
The rich solution and ammonia liquid temperatures at both the absorber and the
condenser outlets T
ia
,
-
The ammonia vapor temperature at the evaporator outlet T
ie
,
Relative stability is obtained for the variations of the indicated temperatures in terms of the
coefficient of performance COP. However, a light increase of T
ig
and T
if
and a light decrease
of Tia are observed. These variations affect slightly the increase of the COP. Other
parameters behaviors could be easily derived and investigated. The cooling load Q
e
increases with the thermal conductance increase reaching a maximum value and then it
decreases with the increase of the COP. The decrease of Q
e
is more promptly for great T
sc
values. Furthermore, the increase of COP leads to a sensible decrease of the cooling load. It
has been demonstrated that a COP value close to 1 could be achieved with a close to zero
cooling load. Furthermore, there is no advantage to increase evermore the command hot
source temperature
Since the absorption is slowly occurred, a long heat transfer time is required in the absorber.
The fluid vaporization in the generator requires the minimal time of transfer.
Approximately, the same time of transfer is required in the condenser and in the evaporator.
The subsystem TM
2
requires a lower heat transfer time than the subsystem TR.
5.2 Power normalization
A normalization of the maximal power was presented by Fellah, 2008. Sahin and Kodal
(1995) demonstrated that for a subsystem with three thermal reservoirs, the maximal power
depends only on the interface thermal conductances. The maximal normalized power of the
combined cycle is expressed as:
21 3 21 3 13
()() P UAUA UA UAUA UA UAUA
(14)
Thus, different cases can be treated.
a.
If
123
UA UA UA then P
< 1. The power deduced from the optimization of a
combined cycle is lower than the power obtained from the optimization of an associated
endoreversible compact cycle.
b.
If, for example
13
UA UA ; Then P
can be expressed as:
2
1112P
(15)
where:
21
UA UA
.
On the Thermal Transformer Performances
113
For important values of , equation (7) gives P
≈ 1. The optimal power of the combined
cycle is almost equal to the optimal power of the simple compact cycle.
c.
If
123
UA UA UA then P
= 2/3. It is a particular case and it is frequently used as
simplified hypothesis in theoretical analyses of systems and processes.
5.3 Academic and practical characteristics zones
5.3.1 Generalities
Many energetic system characteristics variations present more than one branch e.g.
Summerer, 1996; Fellah et al.2006; Fellah, 2008 and Berrich, 2011. Usually, academic and
theoretical branches positions are different from theses with practical and operational
interest ones. Both branches define specific zones. The most significant parameters for the
practical zones delimiting are the high COP values or the low entropy generation rate
values. Consequently, researchers and constructors attempt to establish a compromise
between conceptual and economic criteria and the entropy generation allowing an increase
of performances. Such a tendency could allow all-purpose investigations.
The Figure 2 represents the COP variation versus the inverse specific cooling load (A
t
/Q
evap
)
the curve is a building block related to the technical and economic analysis of absorption
refrigerator. For the real ranges of the cycle operating variables, the curve starts at the point
M defined by the smallest amount of (A/Q
e
) and the medium amount of the COP. Then, the
curve leaves toward the highest values in an asymptotic tendency. Consequently, the M
point coordinates constitute a technical and economic criterion for endoreversible analyses
in finite time of solar absorption refrigeration cycles Berlitz et al.(1999), Fellah 2010 and
Berrich, 2011 . The medium values are presented in the reference Fellah, 2010 as follow:
2
0,4 / 0,5 /
e
AQ m kW (16)
Fig. 2. Inverse specific cooling load versus the COP.
5.3.2 Optimal zones characteristics
The Figure 3 illustrates the effect of the ISCL on the entropy rate for different temperatures
of the heat source. Thus, for a Neat Cooling Load Q
e
and a fixed working temperature T
sc
,
the total heat exchange area A and the entropy produced could be deduced.
The minimal entropy downiest zones are theses where the optimal operational zones have
to be chosen. The point M is a work state example. It is characterized by a heat source
Heat Analysis and Thermodynamic Effects
114
temperature of about 92°C and an entropy rate of 0.267kW/K and an A/Q
e
equal to 24.9%.
Here, the domain is decomposed into seven angular sectors. The point M is the origin of all
the sectors.
The sector R is characterized by a decrease of the entropy while the heat source temperature
increases. The result is logic and is expected since when the heat source temperature
increases, the COP increases itself and eventually the performances of the machine become
more interesting. In fact, this occurs when the irreversibility decreases. Many works have
presented the result e.g. Fellah et al. 2006. However, this section is not a suitable one for
constructors because the A/Q
e
is not at its minimum value.
Fig. 3. Entropy rate versus the inverse specific cooling load.
The sector A is characterized by an increase of the entropy while the heat source
temperature decreases from the initial state i.e. 92°C to less than 80°C. The result is in
conformity with the interpretation highly developed for the sector R.
The sector I is characterized by an increase of the entropy rate while the heat source
temperature increases. The reduction of the total area by more than 2.5% of the initial state is
the point of merit of this sector. This could be consent for a constructor.
The sector N presents a critical case. It is characterized by a vertical temperature curves for
low T
sc
and a slightly inclined ones for high T
sc
. Indeed, it is characterized by a fixed
economic criterion for low source temperature and an entropy variation range limited to
maximum of 2% and a slight increase of the A/Q
e
values for high values of the heat source
temperature with an entropy variation of about 6.9%.
The sector B is characterized by slightly inclined temperature curves for low T
sc
and vertical
ones for high T
sc
, opposing to the previous zone. Indeed, the A/Q
e
is maintained constant
for a high temperature. The entropy variation attains a maximum value of 8.24%. For low
values of the temperature, A/Q
e
increases slightly. The entropy gets a variation of 1.7%. The
entropy could be decreased by the increase of the heat source temperature. Thus it may be a
suitable region of work.
As well, the sector O represents a suitable work zone.
The sector W is characterized by horizontal temperature curves for low T
sc
and inclined ones
for high T
sc
. In fact, the entropy is maintained fixed for a low temperature. For high values
of the temperature, the entropy decreases of about 8.16%. For a same heat source
temperature, an increase of the entropy is achievable while A/Q
e
increases. Thus, this is not
the better work zone.
On the Thermal Transformer Performances
115
It should be noted that even if it is appropriate to work in a zone more than another, all the
domains are generally good as they are in a good range:
0.21 < A/Q
e
< 0.29 m
2
/kW (19)
A major design is based on optimal and economic finality which is generally related to the
minimization of the machine’s area or to the minimization of the irreversibility.
5.3.3 Heat exchange areas distribution
For the heat transfer area allocation, two contribution types are distinguished by Fellah,
2006. The first is associated to the elements of the subsystem TM
2
(command high
temperature). The second is associated to the elements of the subsystem TR (refrigeration
low temperature). For COP low values, the contribution of the subsystem TM
2
is higher than
the subsystem TR one. For COP high values, the contribution of the subsystem TR is more
significant. The contribution of the generator heat transfer area is more important followed
respectively, by the evaporator, the absorber and the condenser.
0,25 0,3 0,35 0,4 0,45 0,5 0,55
0,35
0,4
0,45
0,5
0,55
0,6
0,65
A
h
/Ar
COP
Fig. 4. Effect of the areas distribution on the COP
The increase of the ratio U
MT2
/U
RT
leads to opposite variations of the area contributions. The
heat transfer area of MT
2
decreases while the heat transfer of TR increases. For a ratio
U
MT2
/U
RT
of about 0.7 the two subsystems present equal area contributions.
The figure 4 illustrates the variation of the coefficient of performance versus the ratio A
h
/A
r
.
For low values of the areas ratio the COP is relatively important. For a distribution of 50%,
the COP decreases approximately to 35%.
6. Endoreversible behavior in transient regime
This section deals with the theoretical study in dynamic mode of the solar endoreversible
cycle described above. The system consists of a refrigerated space, an absorption refrigerator
and a solar collector. The classical thermodynamics and mass and heat transfer balances are
used to develop the mathematical model. The numerical simulation is made for different
operating and conceptual conditions.
6.1 Transient regime mathematical model
The primary components of an absorption refrigeration system are a generator, an absorber,
a condenser and an evaporator, as shown schematically in Fig.5. The cycle is driven by the
Heat Analysis and Thermodynamic Effects
116
heat transfer rate Q
H
received from heat source (solar collector) at temperature T
H
to the
generator at temperature T
HC
. Q
Cond
and Q
Abs
are respectively the heat rejects rates from the
condenser and absorber at temperature T
0C
, i.e.T
0A
, to the ambient at temperature T
0
and Q
L
is the heat input rate from the cooled space at temperature T
LC
to the evaporator at
temperature T
L
. In this analysis, it is assumed that there is no heat loss between the solar
collector and the generator and no work exchange occurs between the refrigerator and its
environment. It is also assumed that the heat transfers between the working fluid in the heat
exchangers and the external heat reservoirs are carried out under a finite temperature
difference and obey the linear heat-transfer law ‘’Newton’s heat transfer law’’.
Reversible
cycle
T
L
T
0
Q
H
Q
L
Q
0
Generator, T
HC
Evaporator,T
LC
Condenser/Absorbeur,T
0C
Solar
Collector
(UA)
H
T
H
(UA)
0
(UA)
L
G
Fig. 5. The heat transfer endoreversible model of a solar driven absorption refrigeration system.
Therefore, the steady-state heat transfer equations for the three heat exchangers can be
expressed as:
0000
()
()
()
LLLLC
HHHHC
C
QUATT
QUATT
QUAT T
(20)
From the first law of thermodynamics:
0HL
QQQ (21)
According to the second law of thermodynamics and the endoreversible property of the
cycle, one may write:
0
0
HL
HC LC C
Q
TTT
(22)
The generator heat input Q
H
can also be estimated by the following expression:
HscscT
QAG
(23)
Where A
sc
represents the collector area, G
T
is the irradiance at the collector surface and η
sc
stands for the collector efficiency. The efficiency of a flat plate collector can be calculated as
presented by Sokolov and Hersagal, (1993):
On the Thermal Transformer Performances
117
()
HstTstH
QAGbTT
(24)
Where b is a constant and T
st
is the collector stagnation temperature.
The transient regime of cooling is accounted for by writing the first law of thermodynamics,
as follows:
01
()
L
air w L L
dT
mCv UA T T Q Q
dt
(25)
Where UA
w
(T
0
-T
L
) is the rate of heat gain from the walls of the refrigerated space and Q
1
is
the load of heat generated inside the refrigerated space.
The factors UA
H
, UA
L
and UA
0
represent the unknown overall thermal conductances of the
heat exchangers. The overall thermal conductance of the walls of the refrigerated space is
given by UA
W
. The following constraint is introduced at this stage as:
0HL
UA UA UA UA
(26)
According to the cycle model mentioned above, the rate of entropy generated by the cycle is
described quantitatively by the second law as:
0
0
HL
CHCLC
Q
dS Q Q
dt T T T
(27)
In order to present general results for the system configuration proposed in Fig. 5,
dimensionless variables are needed. Therefore, it is convenient to search for an alternative
formulation that eliminates the physical dimensions of the problem. The set of results of a
dimensionless model represent the expected system response to numerous combinations of
system parameters and operating conditions, without having to simulate each of them
individually, as a dimensional model would require. The complete set of non dimensional
equations is:
0
0
0
0
0
0
1
0
()
()
(1 )( 1)
()
()
LLC
L
HHC
H
C
st H
H
HL
HL
HC LC C
L
L
L
HL
HL
Qz
Qy
Qyz
QB
QQQ
Q
d
wQQ
d
dS
Q
d
(28)
Where the following group of non-dimensional transformations is defined as:
Heat Analysis and Thermodynamic Effects
118
000
0
00 0
0
1
01
0000
,,,
,, ,
,,,,
.
,
st
HL
HLst
LC C HC
LC OC HC
HL
HL
sc T
air
T
TT
TTT
TTT
TT T
Q
QQ Q
QQQQ
UA T UAT UAT UA T
AGb
tUA
B
UA mCv
(29)
B describes the size of the collector relative to the cumulative size of the heat exchangers,
and y, z and w are the conductance allocation ratios, defined by:
,,
w
HL
UA
UA UA
yzw
UA UA UA
(30)
According to the constraint property of thermal conductance UA in Eq. (26), the thermal
conductance distribution ratio for the condenser can be written as:
0
1
UA
xyz
UA
(31)
The objective is to minimize the time θ
set
to reach a specified refrigerated space temperature,
τ
L,set
, in transient operation. An optimal absorption refrigerator thermal conductance
allocation has been presented in previous studies e.g. Bejan, 1995 and Vargas et al., (2000)
for achieving maximum refrigeration rate, i.e.,(x,y,z)
opt
=(0.5,0.25,0.25), which is also roughly
insensitive to the external temperature levels (τ
H
, τ
L
). The total heat exchanger area is set to
A=4 m
2
and an average global heat transfer coefficient to U=0.1 kW/m
2
K in the heat
exchangers and U
w
=1.472 kW /m
2
K across the walls which have a total surface area of
A
w
=54 m
2
, T
0
= 25°C and Q
1
=0.8 kW. The refrigerated space temperature to be achieved was
established at T
L,set
=16°C.
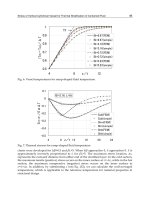
6.2 Results
The search for system thermodynamic optimization opportunities started by monitoring the
behavior of refrigeration space temperature τ
L
in time, for four dimensionless collector size
parameter B, while holding the other as constants, i.e., dimensionless collector temperature
H
=1.3 and dimensionless collector stagnation temperature
st
=1.6. Fig.6 shows that there is
an intermediate value of the collector size parameter B, between 0.01 and 0.038, such that the
temporal temperature gradient is maximum, minimizing the time to achieve prescribed set
point temperature (
L,set
=0.97). Since there are three parameters that characterize the
proposed system (
st
,
H
, B), three levels of optimization were carried out for maximum
system performance.
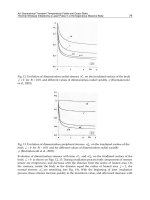
The optimization with respect to the collector size B is pursued in Fig. 7 for time set point
temperature, for three different values of the collector stagnation temperature
st
and heat
source temperatures
H
=1.3. The time θ
set
decrease gradually according to the collector size
parameter B until reaching a minimum θ
set,min
then it increases. The existence of an optimum
with respect to the thermal energy input
H
Q is not due to the endoreversible model aspects.
On the Thermal Transformer Performances
119
However, an optimal thermal energy input
H
Q results when the endoreversible equations
are constrained by the recognized total external conductance inventory, UA in Eq. (26),
which is finite, and the generator operating temperature T
H
.
Fig. 6. Low temperature versus heat transfer time for B=0.1,0.059,0.038.
Fig. 7. The effect of dimensionless collector size B on time set point temperature.
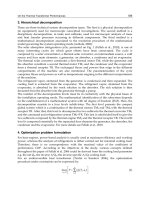
These constraints are the physical reasons for the existence of the optimum point. The
minimum time to achieve prescribed temperature is the same for different values of
stagnation temperature
st
. The optimal dimensionless collector size B decreases
monotonically as
st
increases and the results are shown in Fig. 8. The parameter
st
has a
negligible effect on B
opt
if
st
is greater than 1.5 and B
opt
is less than
0.1. Thus,
sc
has more
effect on the optimal collector size parameter B
opt
than that on the relative minimum time.
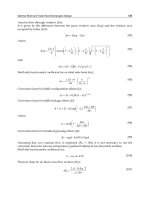
The results plotted in Figures 8, 9 and 10 illustrate the minimum time θ
set,min
and the optimal
parameter B
opt
respectively against dimensionless collector temperature
H
, thermal load
inside the cold space
1
Q and conductance fraction w. The minimum time θ
set,min
decrease
and the optimal parameter B
opt
increase as
H
increase. The results obtained accentuate the
importance to identify B
opt
especially for lower values of τ
H
.
1
Q has an almost negligible
effect on B
opt
. B
opt
remains constant, whereas an increase in
1
Q leads to an increase in
θ
set,min.
. Obviously, a similar effect is observed concerning the behaviors of B
opt
and θ
set,min
according to conductance allocation ratios w.
During the transient operation and to reach the desired set point temperature, there is total
entropy generated by the cycle. Figure 11 shows its behavior for three different collector size
parameters, holding τ
H
and τ
st
constant, while Fig.12 displays the effect of the collector size
Heat Analysis and Thermodynamic Effects
120
Fig. 8. The effect of the collector stagnation temperature
st
on minimum time set point
temperature and optimal collector size.
Fig. 9. The effect of dimensionless heat source temperatures
H
on minimum time set point
temperature and optimal collector size (
st
=1.6).
Fig. 10. The effect of thermal load in the refrigerated space on minimum time set point
temperature and optimal collector size (
H
=1.3 and
st
=1.6).
on the total entropy up to θ
set
. The total entropy increases with the increase of time and this
is clear on the basis of the second law of thermodynamics, the entropy production is always
positive for an externally irreversible cycle. There is minimum total entropy generated for a
On the Thermal Transformer Performances
121
certain collector size. Note that B
opt
, identified for minimum time to reach τ
L,set
, does not
coincide with B
opt
where minimum total entropy occurs.
Fig. 11. The effect of conductance fraction on minimum time set point temperature and
optimal collector size (
H
=1.3 and
st
=1.6).
Fig. 12. Transient behavior of entropy generated during the time (
H
=1.3 and
st
=1.6).
Stagnation temperature and temperature collector effects on minimum total entropy
generated up to θ
set
and optimal dimensionless collector size are shown respectively in
Figs.13 and 14.
set,min
Sis independent of τ
st
, but, as the temperature stagnation increase B
opt
decrease. This behavior is different from what was observed in the variation of temperature
collector. An increase of stagnation temperature leads to a decrease of
set,min
Sand to an
increase of B
opt
. This result brings to light the need for delivering towards the greatest values
of τ
st
to approach the real refrigerator.
The optimization with respect to the size collector parameters for different values of τ
st
is
pursued in Figure 15 for evaporator heat transfer. There is an optimal size collector to attain
maximum refrigeration.
Heat Analysis and Thermodynamic Effects
122
Fig. 13. Total entropy generated to reach a refrigerated space temperature set point
temperature (
H
=1.3)
Fig. 14. The effect of dimensionless collector stagnation temperature, st, on minimum
entropy set point temperature and optimal collector size (
H
=1.3).
Fig. 15. The effect of dimensionless collector stagnation temperature,
H
, on minimum
entropy set point temperature and optimal collector size (
st
=1.6).
On the Thermal Transformer Performances
123
Fig. 16. The effect of dimensionless collector size, B on heat exchanger Q
L
(
H
=1.3 and
L
=0.97).
Finally, Figures 17 and 18 depict the maximization of the heat input to evaporator and
optimal size collector with stagnation temperature and temperature collector, respectively.
L,max
Q remains constant and B
opt
decreases. On the other hand, the curves of Fig. 15
indicate that as τ
H
increases,
L,max
Q and B
opt
increases. For a τ
H
value under 1.35, B
opt
is
lower than 0.1.
Fig. 17. Maximum heat exchanger, Q
L,max
to reached a refrigerated space temperature set
point temperature (
H
=1.3 and
L
=0.97).
Heat Analysis and Thermodynamic Effects
124
Fig. 18. Maximum heat exchanger, Q
L,max
to reached a refrigerated space temperature set
point temperature (
st
=1.3 and
L
=0)
7. Conclusion
This chapter has presented an overview of the energy conversion systems optimization.
Regarding the permanent regime, the functional decomposition and the optimization under
constraints according to endoreversibility principles were the basis of the methodology. This
procedure leads to a simple mathematical model and presents the advantage to avoid the
use of equations with great number of unknowns. In so doing and as an example, the
optimization of solar absorption refrigerator is investigated. The conceptual parameters are
less sensible to temperature variations but more sensible to overall heat transfer coefficients
variations. The couplings between the functional and conceptual parameters have permitted
to define interesting technical and economical criteria related to the optimum cycle
performances. The results confirm the usefulness of the hierarchical decomposition method
in the process analyze and may be helpful for extended optimization investigations of other
conversion energy cycles.
Also, the analysis in transient regime is presented. An endoreversible solar driven
absorption refrigerator model has been analyzed numerically to find the optimal conditions.
The existence of an optimal size collector for minimum time to reach a specified temperature
in the refrigerated space, minimum entropy generation inside the cycle and maximum
refrigeration rate is demonstrate. The model accounts for the irreversibilities of the three
heat exchangers and the finiteness of the heat exchanger inventory (total thermal
conductance).
8. References
Aoltola, J. (2003). Simultaneous synthesis of flexible heat exchanger networks. Thesis,
Helsinky University of Technology
Bejan, A. (1995). Optimal allocation of a heat exchanger inventory in heat driven
refrigerators”, Heat Mass Transfer, vol.38, pp. 2997-3004,
Berrich, E.; Fellah, A.; Ben Brahim, A. & Feidt, M. (2011). Conceptual and functional study of
a solar absorption refrigeration cycle. Int. J. Exergy vol.8,3, 265-280.
On the Thermal Transformer Performances
125
Boukhchana, Y.; Fellah, A.; & Ben Brahim, A. (2010). Modélisation de la phase génération
d’un cycle de réfrigération par absorption solaire à fonctionnement intermittent. Int
J Refrig. 34, 159-167
Bourges, B. (1992). Climatic data handbook for Europe. Kluwer,Dordrecht
Chen, J. (1995). The equivalent cycle system of an endoreversible absorption refrigerator and
its general performance characteristics. Energy 20:995–1003
Chen, J. & Wu, C. (1996). General performance characteristics of an n stage endoreversible
combined power cycle system at maximum specific power output. Energy Convers
Manag 37:1401–1406
Chen, J. & Schouten, A. (1998). Optimum performance characteristics of an irreversible
absorption refrigeration system”, Energy Convers Mgmt, vol.39, pp. 999-1007,
Feidt, M. & Lang, S. (2002). Conception optimale de systèmes combinés à génération de
puissance, chaleur et froid. Entropie 242:2–11
Fellah, A. ; Ben Brahim, A. ; Bourouis, M. & Coronas, A. (2006). Cooling loads analysis of an
equivalent endoreversible model for a solar absorption refrigerator. Int J Energy
3:452–465
Fellah, A. (2008). Intégration de la décomposition hiérarchisée et de l’endoréversibilité dans
l’étude d’un cycle de réfrigeration par absorption solaire: modélisation et
optimisation. Thesis, Université de Tunis-Elmanar, Ecole nationale d’ingénieurs,
Tunis, Tunisia
Fellah, A.; Khir, T.; & Ben Brahim, A. (2010). Hierarchical decomposition and optimization
of thermal transformer performances. Struct Multidisc Optim 42(3):437–448
Goktun, S. (1997). Optimal Performance of an Irreversible Refrigerator with Three Berlitz,
J.T.; Satzeger, V.; Summerer, V.; Ziegler, F. & Alefeld, G. (1999). A contribution to
the evaluation of the economic perspectives of absorption chillers. Int J Refrig
22:67–76
Martinez, P.J. & Pinazo, J.M. (2002). A method for design analysis of absorption machines.
Int J Refrig 25:634–639
Munoz, J.R. & Von Spakovsky, M.R. (2003). Decomposition in energy system
synthesis/design optimization for stationary and aerospace applications. J Aircr
40:35–42 Heat Sources”, Energy, vol. 22, pp. 27-31,
Perrin de Brichambaut, Ch. (1963). Rayonnement solaire: échanges radiatifs naturels.
Editions Gautier-Villars, Paris
Sahin, B. & Kodal, A. (1995). Steady state thermodynamic analysis of a combined Carnot
cycle with internal irreversibility. Energy 20:1285–1289
Summerer, F. (1996). Evaluation of absorption cycles with respect to COP and economics,
Int. J. Refrig., Vol. 19, No. 1, pp.19–24
Sokolov, M. & Hersagal, D. (1996). Optimal coupling and feasibility of a solar powered
year-round ejector air conditioner”, Solar Energy vol.50, pp. 507-516, 1993.
Tozer, R. & Agnew, B. (March 1999). Optimization of ideal absorption cycles with external
irreversibilities. Int. Sorption Heat Pump Conference pp. 1-5, Munich,.
Tsirlin, A.M.; Kazakov, V.; Ahremenkov, A.A. & Alimova, N. A. (2006). Thermodynamic
constraints on temperature distribution in a stationary system with heat engine or
refrigerator. J.Phys.D: Applied Physics 39 4269-4277.
Heat Analysis and Thermodynamic Effects
126
Vargas, J.V.C.; Horuz, I.; Callander, T. M. S.; Fleming, J. S. & Parise, J. A. R. (1998).
Simulation of the transient response of heat driven refrigerators with continuous
temperature control. Int. J. Refrig., vol.21, pp. 648–660,.
Vargas, J.V.C.; Ordonez, J. C.; Dilay, A. & Parise. J. A. R. (2000). Modeling, simulation and
optimization of a solar collector driven water heating and absorption cooling plant.
Heat Transfer Engineering, vol.21, pp. 35-45,
Wijeysundera, N.E. (1997). Thermodynamic performance of solar powered ideal absorption
cycles. Solar energy, pp.313-319
Part 2
Heat Pipe and Exchanger
7
Optimal Shell and Tube Heat
Exchangers Design
Mauro A. S. S. Ravagnani
1
, Aline P. Silva
1
and Jose A. Caballero
2
1
State University of Maringá
2
University of Alicante
1
Brazil
2
Spain
1. Introduction
Due to their resistant manufacturing features and design flexibility, shell and tube heat
exchangers are the most used heat transfer equipment in industrial processes. They are also
easy adaptable to operational conditions. In this way, the design of shell and tube heat
exchangers is a very important subject in industrial processes. Nevertheless, some
difficulties are found, especially in the shell-side design, because of the complex
characteristics of heat transfer and pressure drop. Figure 1 shows an example of this kind of
equipment.
In designing shell and tube heat exchangers, to calculate the heat exchange area, some
methods were proposed in the literature. Bell-Delaware is the most complete shell and tube
heat exchanger design method. It is based on mechanical shell side details and presents
more realistic and accurate results for the shell side film heat transfer coefficient and
pressure drop. Figure 2 presents the method flow model, that considers different streams:
leakages between tubes and baffles, bypass of the tube bundle without cross flow, leakages
between shell and baffles, leakages due to more than one tube passes and the main stream,
and tube bundle cross flow. These streams do not occur in so well defined regions, but
interacts ones to others, needing a complex mathematical treatment to represent the real
shell side flow.
In the majority of published papers as well as in industrial applications, heat transfer
coefficients are estimated, based, generally on literature tables. These values have always a
large degree of uncertainty. So, more realistic values can be obtained if these coefficients are
not estimated, but calculated during the design task. A few number of papers present shell
and tube heat exchanger design including overall heat transfer coefficient calculations
(Polley et al., 1990, Polley and Panjeh Shah, 1991, Jegede and Polley, 1992, and Panjeh Shah,
1992, Ravagnani, 1994, Ravagnani et al. (2003), Mizutani et al., 2003, Serna and Jimenez,
2004, Ravagnani and Caballero, 2007a, and Ravagnani et al., 2009).
In this chapter, the work of Ravagnani (1994) will be used as a base to the design of the shell
and tube heat exchangers. A systematic procedure was developed using the Bell-Delaware
method. Overall and individual heat transfer coefficients are calculated based on a TEMA
(TEMA, 1998) tube counting table, as proposed in Ravagnani et al. (2009), beginning with the
smallest heat exchanger with the biggest number of tube passes, to use all the pressure drop
Heat Analysis and Thermodynamic Effects
130
and fouling limits, fixed before the design and that must be satisfied. If pressure drops or
fouling factor are not satisfied, a new heat exchanger is tested, with lower tube passes
number or larger shell diameter, until the pressure drops and fouling are under the fixed
limits. Using a trial and error systematic, the final equipment is the one that presents the
minimum heat exchanger area for fixed tube length and baffle cut, for a counting tube
TEMA table including 21 types of shell and tube bundle diameter, 2 types of external tube
diameter, 3 types of tube pitch, 2 types of tube arrangement and 5 types of number of tube
passes.
SHELL
INLET
SHELL
OUTLET
BAFFLE
BAFFLE
TUBE
INLET
TUBE
OUTLET
TUBE SHEET
Fig. 1. Heat exchanger with one pass at the tube side
Fig. 2. Bell-Delaware streams considerations in the heat exchanger shell side
Two optimisation models will be considered to solve the problem of designing shell and
tube heat exchangers. The first one is based on a General Disjunctive Programming Problem
(GDP) and reformulated to a Mixed Integer Nonlinear Programming (MINLP) problem and
solved using Mathematical Programming and GAMS software. The second one is based on
the Meta-Heuristic optimization technique known as Particle Swarm Optimization (PSO).
The differences between both models are presented and commented, as well as its
applications in Literature problems.
Optimal Shell and Tube Heat Exchangers Design
131
2. Ravagnani and Caballero (2007a) model formulation
The model for the design of the optimum shell and tube equipment considers the objective
function as the minimum cost including exchange area cost and pumping cost, rigorously
following the Standards of TEMA and respecting the pressure drop and fouling limits.
Parameters are: T
in
(inlet temperature), T
out
(outlet temperature), m (mass flowrate),
(density), Cp (heat capacity),
(viscosity), k (thermal conductivity),
P (pressure drop), rd
(fouling factor) and area cost data. The variables are tube inside diameter (d
in
), tube outside
diameter (d
ex
), tube arrangement (arr), tube pitch (pt), tube length (L), number of tube passes
(N
tp
) and number of tubes (N
t
), the external shell diameter (Ds), the tube bundle diameter
(D
otl
), number of baffles (N
b
), baffles cut (l
c
) and baffles spacing (l
s
), heat exchange area (A),
tube-side and shell-side film coefficients (h
t
and h
s
), dirty and clean global heat transfer
coefficient (U
d
and U
c
), pressure drops (
P
t
and
P
s
), fouling factor (rd) and the fluids
location inside the heat exchanger. The model is formulated as a General Disjunctive
Programming Problem (GDP) and reformulated to a Mixed Integer Nonlinear Programming
problem and is presented below.
Heat exchanger fluids location:
Using the GDP formulation of Mizutani et al. (2003), there are two possibilities, either the
cold fluid is in the shell side or in the tube side. So, two binary variables must be defined, y
1
f
and y
2
f
. If the cold fluid is flowing in the shell side, or if the hot fluid is on the tube side, y
1
f
=
1. It implies that the physical properties and hot fluid mass flowrate will be in the tube side,
and the cold fluid physical properties and mass flowrate will be directed to the shell side. If
y
1
f
= 0, the reverse occurs. This is formulated as:
1
21
ff
yy
(1)
hhh
mmm
21
(2)
ccc
mmm
21
(3)
cht
mmm
11
(4)
chs
mmm
22
(5)
fupperh
ymm
11
(6)
fupperc
ymm
21
(7)
fupperh
ymm
22
(8)
fupperc
ymm
12
(9)
cfhft
yy
21
(10)
cfhfs
yy
12
(11)
Heat Analysis and Thermodynamic Effects
132
cfhft
CpyCpyCp
21
(12)
cfhfs
CpyCpyCp
12
(13)
cfhft
kykyk
21
(14)
cfhfs
kykyk
12
(15)
cfhft
yy
21
(16)
cfhfs
yy
12
(17)
For the definition of the shell diameter (D
s
), tube bundle diameter (D
otl
), tube external
diameter (d
ex
), tube arrangement (arr), tube pitch (pt), number of tube passes (N
tp)
and the
number of tubes (N
t
), a table containing this values according to TEMA Standards is
constructed, as presented in Table 1. It contains 2 types of tube external diameter, 19.05 and
25.4 mm, 2 types of arrangement, triangular and square, 3 types of tube pitch, 23.79, 25.4
and 31.75 mm, 5 types of number of tube passes, 1, 2, 4, 6 and 8, and 21 different types of
shell and tube bundle diameter, beginning on 205 mm and 173.25 mm, respectively, and
finishing in 1,524 mm and 1,473 mm, respectively, with 565 rows. Obviously, other values
can be aggregated to the table, if necessary.
D
s
D
otl
d
ex
arr
pt
N
tp
N
t
0.20500 0.17325 0.01905 1 0.02379 1 38
0.20500 0.17325 0.01905 1 0.02379 2 32
0.20500 0.17325 0.01905 1 0.02379 4 26
0.20500 0.17325 0.01905 1 0.02379 6 24
0.20500 0.17325 0.01905 1 0.02379 8 18
0.20500 0.17325 0.01905 1 0.02540 1 37
0.20500 0.17325 0.01905 1 0.02540 2 30
0.20500 0.17325 0.01905 1 0.02540 4 24
0.20500 0.17325 0.01905 1 0.02540 6 16
. . . . . . .
. . . . . . .
. . . . . . .
1.52400 1.47300 0.02540 1 0.03175 6 1761
1.52400 1.47300 0.02540 1 0.03175 8 1726
1.52400 1.47300 0.02540 2 0.03175 1 1639
1.52400 1.47300 0.02540 2 0.03175 2 1615
1.52400 1.47300 0.02540 2 0.03175 4 1587
1.52400 1.47300 0.02540 2 0.03175 6 1553
1.52400 1.47300 0.02540 2 0.03175 8 1522
Table 1. Tube counting table proposed
To find D
s
, D
otl
, d
ex
, arr, pt, ntp and Nt, the following equations are proposed:
Optimal Shell and Tube Heat Exchangers Design
133
565
1
)(.
i
sis
iyntdD
(18)
565
1
)(.
i
otliotl
iyntdD
(19)
565
1
)(.
i
exiex
iyntdd
(20)
565
1
)(.
i
iyntarriarr
(21)
565
1
)(.
i
iyntptipt
(22)
565
1
)(.
i
iyntntpintp
(23)
565
1
)(.
i
iyntntint
(24)
565
1
1)(
i
iynt
(25)
Definition of the tube arrangement (arr) and the arrangement (pn and pp) variables:
21
pnpnpn
(26)
21
pppppp
(27)
21
ptptpt
(28)
11
.5,0 ptpn
(29)
22
ptpn
(30)
11
.866,0 ptpp
(31)
22
ptpp
(32)
arr
tri
ypt 02379,0
1
(33)
arr
cua
ypt 02379,0
2
(34)
arr
tri
ypt 03175,0
1
(35)
arr
cua
ypt 03175,0
2
(36)
1
arr
cua
arr
tri
yy
(37)