Environmental Monitoring Part 12 ppt
Bạn đang xem bản rút gọn của tài liệu. Xem và tải ngay bản đầy đủ của tài liệu tại đây (4.5 MB, 35 trang )
Environmental Monitoring
376
Quandt et al.
[36]
designed a Love-wave biosensor array by coupling aptamers to the surface
of a Love-wave sensor chip. The sensor chip consists of five single sensor elements and
allows label-free, real-time, and quantitative measurements of protein and nucleic acid
binding events in concentration-dependent fashion. The biosensor was calibrated for
human-thrombin and HIV-1 Rev peptide by binding fluorescently labeled molecules and
correlating the mass of the bound molecules to fluorescence intensity. Detection limits of
approximately 75 pg/cm
2
were obtained, and analyte recognition was specific. The sensor
can easily be regenerated by simple washing steps. They further demonstrated the versatile
applicability of the sensor by immobilizing single-stranded DNA (ssDNA) for the detection
of the corresponding counter-strand.
The large quantity of aptamers which have been selected to bind complex molecules of low
molecular weight leads to the possible use of these aptamers not only in diagnostic assays,
but also in a wider range of applications, such as environmental analytical chemistry
[37]
.
Selection of DNA ligands to the chloroaromatics, 4-chloroaniline (4-CA), 2,4,6-
trichloroaniline (TCA) and pentachlorophenol (PCP), was performed by a novel method
utilizing magnetic beads (MBs) having a linker arm for immobilization
[38]
. Moreover,
Labuda et al.
[39]
reported for the first time the selection of RNA aptamers for the recognition
of hydrophobic aromatic carcinogens. In particular, RNA aptamers with a K
d
in the low
micro-molar range have been selected for aromatic amines residues using as a model
methylendianiline, which is a common industrial chemical employed to manufacture
plastics, glues and foams.
A toxin-related work based on aptamers arrays have been published by Ellington et al.
[40]
.
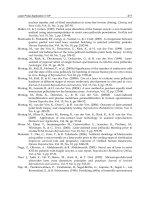
The authors reported the adaptation of a chip-based micro-sphere array (the ‘‘electronic
taste chip’’) to aptamer receptors. Their detection system is illustrated in Figure 11. Unlike
most protein-based arrays, the aptamer chips could be stripped and reused multiple times.
The aptamer chips proved to be useful for screening aptamers from in vitro selection
experiments and for sensitively quantitating the bio-threat agent ricin. The system
composed of a flow cell connected to a fast performance liquid chromatography pump and a
fluorescence microscope for observation. The flow cells contained silicon chips with
multiple wells in which beads modified with the sensor elements were deposited.
Commercially available streptavidin agarose beads were modified with biotinylated
aptamers; RNA anti-ricin aptamers were used to demonstrate the possibility of quantifying
the labeled protein. A sandwich assay format was also optimized using anti-ricin antibodies,
to directly detect the unlabelled protein. In the first type of assay, the aptamer was bio-
tinylated, immobilized and put in contact with the solution containing fluorescently labeled
ricin, once introduced into the chip wells. The fluorescence intensities of the captures
proteins were used to construct a calibration plot for ricin and a detection limit of 8 mg/ml
was obtained. In the sandwich assay, the anti-ricin aptamer acted as a capture reagent and
unlabelled ricin bound to the aptamer could interact with fluorophore-labeled fabricated an
aptamer-based biosensor array for protein detection.
Environmental allergenic disease is a major cause of illness and disability, and there is broad
consensus that the prevalence of type I allergy is increasing worldwide. Recent advances in
biotechnology have yielded potentially useful functional binding aptamers that can enable
low cost, high affinity allergen measurement. Aptamers are selected in vitro from
combinatorial oligonucleotide libraries and therefore have several advantages over the
traditionally used antibodies for detection of allergens. Aptamer-based methods could be
used for measuring environmental allergens. Integrating the resulting aptamer-based
Biosensor Arrays for Environmental Monitoring
377
allergen measurements to enhance quantization in an ongoing and complementary
environmental childhood asthma epidemiological study forms the basis for the third and
final aim. Successful use of aptamers for measuring environmental allergens should lead to
a more cost effective, flexible, and health relevant method and thereby provides the
potential for a more fundamental understanding of the role of environmental allergens in
respiratory health.
Fig. 11. Detection systems. (A) The electronic tongue setup contains a fluid delivery system,
fluorescence microscope, digital camera, flow cell in which the aptamer chip will be loaded,
and computer for data analysis. (B) Close-up look at a bead in a rectangular-shaped micro-
machined well of the aptamer chip. Reprinted from ref. 40 with permission by the Royal
Society of Chemistry.
5. Enzyme based biosensor array
Enzyme-based technology relies upon the natural specificity of given enzymatic protein to
react biochemically with a target substrate or substrates. Like ion channels, there are many
enzymes that participate in cellular signaling and, in some cases, are targeted by compounds
associated with environmental toxicity. In general, enzyme-based biosensors employ semi-
permeable membranes through which target analytes diffuse toward a solid-phase
immobilized enzyme compartment. Ion selective, amperometric, or pH electrodes measure
reaction components such as hydrogen peroxide (from oxidation of glucose by glucose
oxidase) or ammonium ions (from urease metabolism of urea)
[41]
. Enzymes were historically
the first molecular recognition elements included in biosensors and continue to be the basis
for a significant number of publications reported for biosensors in general as well as
biosensors for environmental applications. There are several advantages for enzyme
biosensors. These include a stable source of material (primarily through bio-renewable
sources), the ability to modify the catalytic properties or substrate specificity by means of
genetic engineering, and catalytic amplification of the biosensor response by modulation of
the enzyme activity with respect to the target analyte
[17]
.
Environmental Monitoring
378
Recent progress with respect to enzyme biosensors for environmental applications has been
reported in several areas
[42]
. These areas include the following: genetic modification of
enzymes to increase assay sensitivity, stability and shelf life; improved electrochemical
interfaces and mediators for more efficient operation; and introduction of sampling schemes
consistent with potential environmental applications. More recently, enzyme-based
biosensor arrays also have been used in the application of environmental monitoring. For
example, Kukla et al.
[43]
developed a multi-enzyme electrochemical biosensor array. Their
sensor array is based on capacitance pH-sensitive electrolyte–insulator–semiconductor (EIS)
sensors with silicon nitride ion-sensitive layers and different forms of cholinesterase, urease
and glucose oxidase as sensitive elements. With this sensor array, the authors used a multi-
enzyme analysis to recognize the heavy metal ions in solutions containing a mixture of
different metal ions, as well as for determination of the metal ion content in the analyzed
samples. The content of toxic elements was determined by estimation of the residual activity
of enzymatic membranes after the injection of analyzed samples. The conditions for enzyme
sensors operation, such as buffer capacity, substrate concentration, time of incubation and
time of response signal measurement, were optimized to reach the maximal sensitivity of
multi-sensor for analysis of heavy metal ions in the investigated solutions. The results show
that multi-enzyme analysis followed by mathematical processing is an efficient approach to
develop biosensor arrays for toxic substrates detection.
Organophosphate pesticides (OPs) used to be widely used in agriculture due to their high
efficiency as insecticides. OPs have been shown to result in high levels of acute neuron-
toxicity and carcinogenicity, with the majority being hazardous to both human health and to
the wider environment. A rapid, reliable, economical and portable analytical system will be
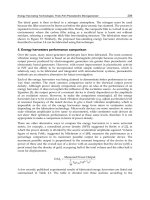
of great benefit in the detection and prevention of OPs contamination. A biosensor array
based on six acetylcholinesterase enzymes coupled with a novel automated instrument
incorporating a neural network program has been reported by Hart et al.
[44]
. The biosensor
array and the instrument is illustrated in Figure 12. Electrochemical analysis was carried out
using chronoamperometry and the measurement was taken 10 s after applying a potential of
0 V vs. Ag/AgCl. The total analysis time for the complete assay was less than 6 min. The
array was used to produce calibration data with six organophosphate pesticides (OPs) in the
concentration range of 10
-5
mol/L to 10
-9
mol/L to train a neural network. The output of the
neural network was subsequently evaluated using different sample matrices. There was no
detrimental matrix effect observed from water, phosphate buffer, food or vegetable extracts.
Furthermore, the sensor system was not detrimentally affected by the contents of water
samples taken from each stage of the water treatment process. Their biosensor array system
successfully identified and quantified all samples where an OP was present in water, food
and vegetable extracts containing different OPs. There were no false positives or false
negatives observed during the evaluation of the analytical system. Their biosensor arrays
and automated instrument were evaluated in situ in field experiments where the instrument
was successfully applied to the analysis of a range of environmental samples.
Recently, many studies have focused on the development of biochemical sensors, which are
well suited for the rapid, simple and selective analysis of pesticides. Specially, they combine
the selectivity of the enzymatic reactions with operational simplicity and simple detection
schemes. Valle et al.
[45]
developed an electronic tongue, employing an array of inhibition
biosensors and Artificial Neural Networks (ANNs). The array of biosensors was made up of
three amperometric pesticide biosensors that used different acetylcholinesterase (AChE)
enzymes: a wild type from electric eel (EE) and two different genetically modified enzymes
Biosensor Arrays for Environmental Monitoring
379
(B1 and B394). In order to model the response to dichlorvos and carbofuran mixtures, a total
amount of 22 solutions were prepared, with random concentrations. Chronoamperometric
responses of the biosensor array were used in order to obtain the inhibition bioelectronic
tongue. Mean values of concentration of pesticides evaluated were 0.79 nmol/L for
dichlorvos and 4.1 nmol/L for carbofuran. Good prediction ability was obtained with
correlation coefficients better than 0.918 when the obtained values were compared with
those expected for a set of 6 external test samples not used for training.
Fig. 12. (a) electrode array comprising 12 screen-printed carbon electrodes and an Ag/AgCl
counter/reference electrode printed on an alumina substrate; (b) array in the prototype
biosensor system operating in the field powered from a car battery via the lighter socket.
Reprinted from ref. 44 with permission by the Elsevier.
Another approach is by using Organophosphorus hydrolase (OPH). OPH is a 72 kDa
homodimeric, metalloenzyme, containing two zinc ions in the active site involved in catalytic
and/or structural functions. OPH catalyzes the hydrolysis of Organophosphates (OPs)
resulting in its detoxification. Some of the biosensors that were developed exploiting OPH as
the bio-recognition element on different detection platforms have been reported. Though
highly sensitive and selective towards different OPs, their inability to provide simultaneous
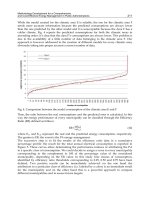
measurements of different analytes was a major shortcoming. Simonian et al.
[46]
developed a
biosensor array (Figure 13) with the potential for direct detection of organophosphates using
OPH, conjugated with a pH-sensitive fluorophore, carboxynaphthofluorescein (CNF). The
presence of reference spots allows the discrimination of the enzymatic and non-enzymatic
based pH changes; bovine serum albumin (BSA) was used as a non-enzymatic scaffold protein
for CNF attachment at the reference spots. An array biosensor unit developed at the Naval
Research Laboratories (NRL) was adopted as the detection platform and appropriately
modified for enzyme-based measurements. A planar multi-mode waveguide was covered
with an optically transparent TiO
2
layer to increase the surface area available for
immobilization. The biosensor enabled the detection of 2.5 μmol/L paraoxon, and 10 μmol/L
parathion respectively. Very short response time of 30 s can be achieved with a total analysis
time of less than 2 min. When operated at room temperature and stored at 4 ℃, the waveguide
retained reasonable activity for greater than 45 days.
An array-based optical biosensor for the simultaneous analysis of multiple samples in the
presence of unrelated multi-analytes was fabricated by Doong et al.
[47]
. The authors used
Environmental Monitoring
380
Urease and acetylcholinesterase (AChE) as model enzymes, which were co-entrapped with
the sensing probe, FITC-dextran, in the sol-gel matrix to measure pH, urea, acetylcholine
(ACh) and heavy metals (enzyme inhibitors). Environmental and biological samples spiked
with metal ions were also used to evaluate the application of the array biosensor to real
samples. The biosensor exhibited high specificity in identifying multiple analytes. No
obvious cross-interference was observed when a 50-spot array biosensor was used for
simultaneous analysis of multiple samples in the presence of multiple analytes. The sensing
system can determine pH over a dynamic range from 4 to 8.5. The limits of detection of 2.5-
50 μmol/L with a dynamic range of 2-3 orders of magnitude for urea and ACh
measurements were obtained. Moreover, the urease-encapsulated array biosensor was used
to detect heavy metals. The analytical ranges of Cd(II), Cu(II), and Hg(II) were between 10
nmol/L and 100 mmol/L. When real samples were spiked with heavy metals, the array
biosensor also exhibited potential effectiveness in screening enzyme inhibitors.`
Fig. 13. (A) Schematic of modified process for incubation using thin glass tubes. (B)
Schematic of the glass slide with immobilized proteins and fluorophores. (C) Schematic of
the array biosensor. Reprinted from ref. 46 with permission by the Elsevier.
Biosensor Arrays for Environmental Monitoring
381
Solna et al.
[48]
use screen-printed four-electrode system as the amperometric transducer
for determination of phenols and pesticides using immobilized tyrosinase, peroxidase,
acetylcholinesterase and butyrylcholinesterase. Acetylthiocholine chloride was chosen as
substrate for cholinesterases to measure inhibition by pesticides, hydrogen peroxide
served as co-substrate for peroxidase to measure phenols. In their work, the compatibility
of hydrolases and oxidoreductases working in the same array was studied. The detection
of p-cresol, catechol and phenol as well as of pesticides including carbaryl, heptenophos
and fenitrothion was carried out in flow-through and steady state arrangements. It was
demonstrated that electrodes modified with hydrolases and oxidoreductases can function
in the same array. The limit of detection for catechol using tyrosinase was equal to 0.35
and 1.7 μmol/L in the flow and steady systems. Lower limits of detection for pesticides
were achieved in the steady state system: carbaryl 26 nmol/L, heptenophos 14 nmol/L
and fenitrothion 0.58 nmol/L. Similar multi-enzyme-based electrochemical biosensor
arrays for the determination of pesticides
[49-52]
and phenols
[53]
have been reported by other
workers.
6. Microorganism-based biosensor array
A microbial biosensor is an analytical device which integrates microorganism(s) with a
physical transducer to generate a measurable signal proportional to the concentration of
analytes. In recent years, a large number of microbial biosensors have been developed for
environmental, food, and biomedical applications
[54]
.
Enzymes are the most widely used biological sensing element in the fabrication of
biosensors. Although purified enzymes have very high specificity for their substrates or
inhibitors, their application in biosensors construction may be limited by the tedious, time-
consuming and costly enzyme purification, requirement of multiple enzymes to generate the
measurable product or need of cofactor/coenzyme. Microorganisms provide an ideal
alternative to these bottle-necks. The many enzymes and co-factors that co-exist in the cells
give the cells the ability to consume and hence detect large number of chemicals; however,
this can compromise the selectivity. They can be easily manipulated and adapted to
consume and degrade new substrate under certain cultivating condition. Additionally, the
progress in molecular biology/recombinant DNA technologies has opened endless
possibilities of tailoring the microorganisms to improve the activity of an existing enzyme or
express foreign enzyme/protein in host cell. All of these make microbes excellent biosensing
elements
[55]
.
Microorganism-based biosensor arrays classically used for environmental biosensing are
mainly bacteria and yeasts, and to a lesser extent algae. Various strains have been exploited,
from commercial and well-characterized cells harboring a broad range of substrates to
genetically engineered organisms specially constructed to detect specific molecules or
groups of molecules, passing through environmental cells isolated from polluted sites
offering greater robustness and more specific enzymatic properties
[56]
.
Rapid identification of Escherichia coli strains is an important diagnostic goal in applied
medicine as well as the environmental and food sciences. Mikkelsen et al.
[57]
reported an
electrochemical, screen-printed biosensor array, where selective recognition is accomplished
using lectins that recognize and bind to cell-surface lipopolysaccharides and coulometric
transduction exploits non-native external oxidants to monitor respiratory cycle activity in
lectin-bound cells. Ten different lectins were separately immobilized onto porous
Environmental Monitoring
382
membranes that feature activated surfaces. Modified membranes were exposed to untreated
E. coli cultures for 30 min, rinsed, and layered over the individual screen-printed carbon
electrodes of the sensor array. The membranes were incubated 5 min in a reagent solution
that contained the oxidants menadione and ferricyanide as well as the respiratory substrates
succinate and formate. Electrochemical oxidation of ferrocyanide for 2 min provided
chronocoulometric data related to the quantities of bound cells. These screen-printed sensor
arrays were used in conjunction with factor analysis for the rapid identification of four E.
coli subspecies (E. coli B, E. coli Neotype, E. coli JM105 and E. coli HB101). Systematic
examination of lectin-binding patterns showed that these four E. coli subspecies are readily
distinguished using only five essential lectins.
The last decade has witnessed a significant increase in interest in whole-cell biosensors for
diverse applications, as well as a rapid and continuous expansion of array technologies.
The combination of these two disciplines has yielded the notion of whole-cell array
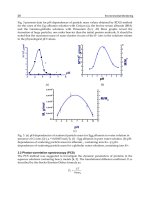
biosensors. Belkin et al.
[58]
presented a potential manifestation of this idea by describing
the printing of a whole-cell bacterial bioreporters array (Figure 14). Exploiting natural
bacterial tendency to adhere to positively charged abiotic surfaces, they describe
immobilization and patterning of bacterial ‘‘spots’’ in the nanoliter volume range by a
non-contact robotic printer. They show that the printed Escherichia coli-based sensor
bacteria are immobilized on the surface, and retain their viability and biosensing activity
for at least 2 months when kept at 4℃. Immobilization efficiency was improved by
manipulating the bacterial genetics, the growth and the printing media and by a chemical
modification of the inanimate surface. The result suggests that the methodology presented
by them may be applicable to the manufacturing of whole-cell sensor arrays for diverse
high throughput applications. In the course of the study, they have also described a novel
specific reporter for the detection of respiratory inhibitors. Sodium azide, a chemical with
a constantly increasing world distribution, served as the model toxicant. The sensor’s
response was rapid (20 minutes after exposure) and dose-dependent, and could be
maintained for at least 2 months at 4 ℃.
Li et al.
[59]
developed a double interdigitated array microelectrodes (IAM)-based flow cell
for an impedance biosensor to detect viable Escherichia coli O157:H7 cells after enrichment in
a growth medium. Their study was aimed at the design of a simple flow cell with embedded
IAM which does not require complex microfabrication techniques and can be used
repeatedly with a simple assembly/disassembly step. The flow cell was also unique in
having two IAM chips on both top and bottom surfaces of the flow cell, which enhances the
sensitivity of the impedance measurement. E. coli O157:H7 cells were grown in a low
conductivity yeast–peptone–lactose–TMAO (YPLT) medium outside the flow cell. After
bacterial growth, impedance was measured inside the flow cell. Equivalent circuit analysis
indicated that the impedance change caused by bacterial growth was due to double layer
capacitance and bulk medium resistance. Both parameters were a function of ionic
concentration in the medium, which increased during bacterial growth due to the
conversion of weakly charged substances present in the medium into highly charged ions.
The impedance biosensor successfully detected E. coli O157:H7 in a range from 8.0 to 8.2×10
8
CFU/mL after an enrichment growth of 14.7 and 0.8 h, respectively. A logarithmic linear
relationship between detection time (T
D
) in h and initial cell concentration (N
0
) in CFU/mL
was T
D
= −1.73 log N
0
+ 14.62, with R
2
= 0.93. Double IAM-based flow cell was more
sensitive than single IAM-based flow cell in the detection of E. coli O157:H7 with 37–61%
more impedance change for the frequency range from 10 Hz to 1 MHz. The double IAM-
Biosensor Arrays for Environmental Monitoring
383
based flow cell could be used to design a simple impedance biosensor for the sensitive
detection of bacterial growth and their metabolites.
Fig. 14. Twenty five spots, 1 nl each, of strain SM118 in ectoine, printed onto the wells of 96-
well plate with an APTES coated glass bottom. Reprinted from ref. 58 with permission by
the Royal Society of Chemistry.
Worldwide herbicide discharge into the aquatic environment is also a growing concern.
Adverse effects induced by herbicide contamination are impacting a great variety of
organisms and ecosystems, ranging from the primary producers to animals and humans.
Biosensors for the rapid detection of herbicides in the environment have also been explored.
A multiple-strain algal biosensor was constructed for the detection of herbicides inhibiting
photosynthesis by Podola et al.
[60]
. Nine different microalgal strains were immobilized on an
array biochip using permeable membranes. The biosensor allowed on-line measurements of
aqueous solutions passing through a flow cell using chlorophyll fluorescence as the
biosensor response signal. The herbicides atrazine, simazine, diuron, isoproturon and
paraquat were detectable within minutes at minimal LOEC (Lowest Observed Effect
Concentration) ranging from 0.5 to 100 µg/L, depending on the herbicide and algal strain.
The most sensitive strains in terms of EC50 values were Tetraselmis cordiformis and
Scherffelia dubia. Less sensitive species were Chlorella vulgaris, Chlamydomonas sp. and
Pseudokirchneriella subcapitata, but for most of the strains no general sensitivity or
resistance was found. The different responses of algal strains to the five herbicides
constituted a complex response pattern (RP), which was analyzed for herbicide specificity
within the linear dose-response relationship.
Recombinant bioluminescent bacterial strains are increasingly receiving attention as
environmental biosensors due to their advantages, such as high sensitivity and selectivity,
low costs, ease of use and short measurement times. Gu et al.
[61]
use a cell-based array
technology that uses recombinant bioluminescent bacteria to detect and classify
environmental toxicity followed by developing two biosensor arrays, i.e., a chip and a plate
array. Twenty recombinant bioluminescent bacteria, having different promoters fused with
the bacterial lux genes, were immobilized within LB-agar. About 2 μl of the cell-agar
mixture was deposited into the wells of either a cell chip or a 384-well plate. The
bioluminescence (BL) from the cell arrays was measured with the use of highly sensitive
cooled CCD camera that measured the bioluminescent signal from the immobilized cells
and then quantified the pixel density using image analysis software. The responses from the
Environmental Monitoring
384
cell arrays were characterized using three chemicals that cause either superoxide damage
(paraquat), DNA damage (mitomycin C) or protein/membrane damage (salicylic acid). The
responses were found to be dependent upon the promoter fused upstream of the lux operon
within each strain. Therefore, a sample’s toxicity can be analyzed and classified through the
changes in the BL expression from each well. Moreover, a time of only 2 h was needed for
analysis, making either of these arrays a fast, portable and economical high-throughput
biosensor system for detecting environmental toxicities.
Because of their ability to perform functional sensing, living cell-based biosensors are
drawing increased attention. The work reported by Walt et al.
[62]
demonstrates the ability to
fabricate an optical imaging fiber-based living bacterial cell array for genotoxin detection. A
biosensor composed of a high-density living bacterial cell array was fabricated by inserting
bacteria into a micro-well array formed on one end of an imaging fiber bundle. The size of
each micro-well allows only one cell to occupy each well. In this biosensor, E. coli cells
carrying a recA::gfp fusion were used as sensing components for genotoxin detection. Each
fiber in the array has its own light pathway, enabling thousands of individual cell responses
to be monitored simultaneously with both spatial and temporal resolution. The biosensor
was capable of performing cell-based functional sensing of a genotoxin with high sensitivity
and short incubation times (1 ng/mL mitomycin C after 90 min). The biosensors
demonstrated an active sensing lifetime of more than 6 h and a shelf lifetime of two weeks.
Their group reported another live cell biosensor array
[63]
, which was fabricated by
immobilizing bacterial cells on the face of an optical imaging fiber containing a high density
array of micro-wells. Each microwell accommodates a single bacterium that was genetically
engineered to respond to a specific analyte. A genetically modified Escherichia coli strain,
containing the lacZ reporter gene fused to the heavy metal-responsive gene promoter zntA,
was used to fabricate a mercury biosensor. A plasmid carrying the gene coding for the
enhanced cyan fluorescent protein (ECFP) was also introduced into this sensing strain to
identify the cell locations in the array. Single cell lacZ expression was measured when the
array was exposed to mercury and a response to 100 nmol/L Hg
2+
could be detected after a
1-h incubation time. The optical imaging fiber-based single bacterial cell array is a flexible
and sensitive biosensor platform that can be used to monitor the expression of different
reporter genes and accommodate a variety of sensing strains.
7. Conclusion and future direction
In recent years, there have been dramatic advances in a new analytical format, the biosensor
array, a tool that has revolutionized our ability to characterize and quantify biologically and
envitonmetally relevant molecules. The biosensor arrays address the need for rapid,
sensitive, and specific screening for multiple pollutants at the site of sample collection. The
biosensor arrays have several very significant advantages for such applications: (1) The
number of analyte which can be detected simultaneously can be expanded as need dictates
and specific analyte become available. (2) The biosensor arrays and tracer reagents are
reusable if no target agent binds to the array surface. This feature significantly decreases the
cost and operational burden for the user and simplifies automation for extended monitoring
applications. (3) The biosensor array is simple to use. It is easily portable for first responder
applications. The insertion of the sensor array, tracer reagents and samples is very simple
with no requirement for alignment operations by the user. (4) The biosensor array is a low-
cost system which can be made even more cost effective with mass production. (5) The
Biosensor Arrays for Environmental Monitoring
385
biosensor array can be easily adapted for continuous monitoring operations by integration
with a computer-controlled sampler to format automatic analytical system. Because of these
advantages, more and more biosensor arrays are applied in varied areas including
environmental monitoring. An overview of the applications for environment by using
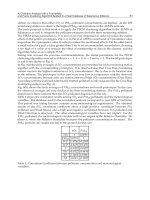
biosensor arrays, which are not mentioned in this review, are listed in Table 1.
Target Biosensor array type LOD Reference
Herbicide
Subclasses
Array of photosystem II mutants
3×10
-9
mol/L
[64]
Metal ions
All-solid-state potentiometric biosensor
array
10
-6
mol/L [65]
Microbial species Electrochemical biosensor array Not given [66]
Escherichia coli
Quantum dot-based array 10 CFU/mL [67]
Bio-hazardous
agents
Planar waveguide biosensor array
5×10
5
CFU/mL
[68]
aflatoxin B
1
NRL biosensor array 0.6 ng/g [69]
Ochratoxin A Antibody-based biosensor array 3.8 ng/g [70]
Odour Colorimetric biosensor array Not given [71]
Escherichia coli
Antimicrobial Peptides based biosensor
array
10
7
CFU/mL [72]
Yersinia pestis F1 Antibody-based biosensor array 25 ng/mL [73]
Bacillus globigii
Antibody-based biosensor array 10
5
CFU/mL [74]
Shigella dysenteriae
Antibody-based biosensor array
5×10
4
CFU/mL
[75]
Table 1. Applications of biosensor arrays for environmental monitoring
Despite the high number of biosensor arrays under development and the amount of
research literature on this area, few practical systems are currently enjoying market
acceptance for environmental applications. The Naval Research Laboratory (NRL) biosensor
arrays are the most successful type of biosensor arrays that have found commercial
application not only in environmental monitoring but also in the monitoring of bio-
molecular interaction events in general. Biosensor arrays still need more research and
development in order to achieve the stability, sensitivity, specificity, and versatility that will
attract confidence of potential users, especially for biotechnology and environmental
applications.
8. References
[1] G. Hanrahan, D.G. Patil, J. Wang, J Environ Monitor, 6 (2004) 657-664.
[2] M. Badihi-Mossberg, V. Buchner, J. Rishpon, Electroanal, 19 (2007) 2015-2028.
[3] A. Cavalcanti, B. Shirinzadeh, M. Zhang, L. Kretly, Sensors, 8 (2008) 2932-2958.
[4] K.E. Sapsford, M.M. Ngundi, M.H. Moore, M.E. Lassman, L.C. Shriver-Lake, C.R. Taitt,
F.S. Ligler, Sensor Actuat B-Chem, 113 (2006) 599-607.
[5] M. Seidel, R. Niessner, Analytical and Bioanalytical Chemistry, 391 (2008) 1521-1544.
[6] F.S. Ligler, K.E. Sapsford, J.P. Golden, L.C. Shriver-Lake, C.R. Taitt, M.A. Dyer, S. Barone,
C.J. Myatt, Anal Sci, 23 (2007) 5-10.
Environmental Monitoring
386
[7] J. Zhai, H. Cui, R. Yang, Biotechnology Advances, 15 (1997) 43-58.
[8] A. Sassolas, B.D. Leca-Bouvier, L.J. Blum, Chemical Reviews, 108 (2007) 109-139.
[9] Y C. Cao, Z L. Huang, T C. Liu, H Q. Wang, X X. Zhu, Z. Wang, Y D. Zhao, M X.
Liu, Q M. Luo, Anal Biochem, 351 (2006) 193-200.
[10] J. Wang, G. Liu, A. Merkoçi, J Am Chem Soc, 125 (2003) 3214-3215.
[11] H. Li, Z. Sun, W. Zhong, N. Hao, D. Xu, H Y. Chen, Analytical Chemistry, 82 (2010)
5477-5483.
[12] D.D. Zhang, Y.G. Peng, H.L. Qi, Q. Gao, C.X. Zhang, Biosens Bioelectron, 25 (2010)
1088-1094.
[13] E. Komarova, K. Reber, M. Aldissi, A. Bogomolova, Biosensors and Bioelectronics, 25
(2010) 1389-1394.
[14] H. Xia, F. Wang, Q. Huang, J.F. Huang, M. Chen, J. Wang, C.Y. Yao, Q.H. Chen, G.R.
Cai, W.L. Fu, Sensors, 8 (2008) 6453-6470.
[15] R.A. Doong, H.M. Shih, S.H. Lee, Sensor Actuat B-Chem, 111 (2005) 323-330.
[16] N.J. Ronkainen, H.B. Halsall, W.R. Heineman, Chem Soc Rev, 39 (2010) 1747-1763.
[17] K.R. Rogers, Analytica Chimica Acta, 568 (2006) 222-231.
[18] W. Lian, D. Wu, D.V. Lim, S. Jin, Anal Biochem, 401 (2010) 271-279.
[19] K. Kloth, R. Niessner, M. Seidel, Biosensors and Bioelectronics, 24 (2009) 2106-2112.
[20] K. Kloth, M. Rye-Johnsen, A. Didier, R. Dietrich, E. Martlbauer, R. Niessner, M. Seidel,
Analyst, 134 (2009) 1433-1439.
[21] M. Varshney, Y.B. Li, Biosens Bioelectron, 22 (2007) 2408-2414.
[22] K.E. Sapsford, C.R. Taitt, S. Fertig, M.H. Moore, M.E. Lassman, C.A. Maragos, L.C.
Shriver-Lake, Biosens Bioelectron, 21 (2006) 2298-2305.
[23] M.M. Ngundi, S.A. Qadri, E.V. Wallace, M.H. Moore, M.E. Lassman, L.C. Shriver-Lake,
F.S. Ligler, C.R. Taitt, Environmental Science & Technology, 40 (2006) 2352-2356.
[24] P. Fernández-Calvo, C. Näke, L.A. Rivas, M. García-Villadangos, J. Gómez-Elvira, V.
Parro, Planet Space Sci, 54 (2006) 1612-1621.
[25] L.C. Shriver-Lake, F.S. Ligler, Ieee Sens J, 5 (2005) 751-756.
[26] M.M. Ngundi, L.C. Shriver-Lake, M.H. Moore, M.E. Lassman, F.S. Ligler, C.R. Taitt,
Analytical Chemistry, 77 (2005) 148-154.
[27] J. Golden, L. Shriver-Lake, K. Sapsford, F. Ligler, Methods, 37 (2005) 65-72.
[28] I.M. Ciumasu, P.M. Krämer, C.M. Weber, G. Kolb, D. Tiemann, S. Windisch, I. Frese,
A.A. Kettrup, Biosensors and Bioelectronics, 21 (2005) 354-364.
[29] C.R. Taitt, Y.S. Shubin, R. Angel, F.S. Ligler, Appl. Environ. Microbiol., 70 (2004) 152-
158.
[30] K.E. Sapsford, A. Rasooly, C.R. Taitt, F.S. Ligler, Analytical Chemistry, 76 (2004) 433-
440.
[31] F. Ligler, C. Taitt, L. Shriver-Lake, K. Sapsford, Y. Shubin, J. Golden, Analytical and
Bioanalytical Chemistry, 377 (2003) 469-477.
[32] K. Sefah, J.A. Phillips, X. Xiong, L. Meng, D. Van Simaeys, H. Chen, J. Martin, W. Tan,
Analyst, 134 (2009) 1765-1775.
[33] S. Song, L. Wang, J. Li, C. Fan, J. Zhao, TrAC Trends in Analytical Chemistry, 27 (2008)
108-117.
[34] B. Strehlitz, N. Nikolaus, R. Stoltenburg, Sensors, 8 (2008) 4296-4307.
[35] D. Xu, D. Xu, X. Yu, Z. Liu, W. He, Z. Ma, Analytical Chemistry, 77 (2005) 5107-5113.
Biosensor Arrays for Environmental Monitoring
387
[36] M.D. Schlensog, T.M.A. Gronewold, M. Tewes, M. Famulok, E. Quandt, Sensors and
Actuators B: Chemical, 101 (2004) 308-315.
[37] S. Tombelli, M. Minunni, M. Mascini, Biomol Eng, 24 (2007) 191-200.
[38] J.G. Bruno, Biochemical and Biophysical Research Communications, 234 (1997) 117-120.
[39] U. Brockstedt, A. Uzarowska, A. Montpetit, W. Pfau, D. Labuda, Biochemical and
Biophysical Research Communications, 313 (2004) 1004-1008.
[40] R. Kirby, E.J. Cho, B. Gehrke, T. Bayer, Y.S. Park, D.P. Neikirk, J.T. McDevitt, A.D.
Ellington, Analytical Chemistry, 76 (2004) 4066-4075.
[41] J.J. Pancrazio, J.P. Whelan, D.A. Borkholder, W. Ma, D.A. Stenger, Ann Biomed Eng, 27
(1999) 697-711.
[42] S. Rodriguez-Mozaz, M. Lopez de Alda, D. Barceló, Analytical and Bioanalytical
Chemistry, 386 (2006) 1025-1041.
[43] A.L. Kukla, N.I. Kanjuk, N.F. Starodub, Y.M. Shirshov, Sensors and Actuators B:
Chemical, 57 (1999) 213-218.
[44] A. Crew, D. Lonsdale, N. Byrd, R. Pittson, J.P. Hart, Biosens Bioelectron, 26 (2011) 2847-
2851.
[45] M. Cortina, M. del Valle, J L. Marty, Electroanal, 20 (2008) 54-60.
[46] M. Ramanathan, A.L. Simonian, Biosens Bioelectron, 22 (2007) 3001-3007.
[47] H c. Tsai, R a. Doong, Biosensors and Bioelectronics, 20 (2005) 1796-1804.
[48] R. Solná, S. Sapelnikova, P. Skládal, M. Winther-Nielsen, C. Carlsson, J. Emnéus, T.
Ruzgas, Talanta, 65 (2005) 349-357.
[49] R. Solná, E. Dock, A. Christenson, M. Winther-Nielsen, C. Carlsson, J. Emnéus, T.
Ruzgas, P. Skládal, Analytica Chimica Acta, 528 (2005) 9-19.
[50] S. Sapelnikova, E. Dock, R. Solná, P. Skládal, T. Ruzgas, J. Emnéus, Analytical &
Bioanalytical Chemistry, 376 (2003) 1098-1103.
[51] J.J. Pancrazio, S.A. Gray, Y.S. Shubin, N. Kulagina, D.S. Cuttino, K.M. Shaffer, K.
Eisemann, A. Curran, B. Zim, G.W. Gross, T.J. O'Shaughnessy, Biosensors and
Bioelectronics, 18 (2003) 1339-1347.
[52] S.J. Young, J.P. Hart, A.A. Dowman, D.C. Cowell, Biosensors and Bioelectronics, 16
(2001) 887-894.
[53] S. Sapelnikova, E. Dock, T. Ruzgas, J. Emnéus, Talanta, 61 (2003) 473-483.
[54] L. Su, W. Jia, C. Hou, Y. Lei, Biosensors and Bioelectronics, 26 (2011) 1788-1799.
[55] Y. Lei, W. Chen, A. Mulchandani, Anal Chim Acta, 568 (2006) 200-210.
[56] F. Lagarde, N. Jaffrezic-Renault, Anal Bioanal Chem, 400 (2011) 947-964.
[57] P. Ertl, M. Wagner, E. Corton, S.R. Mikkelsen, Biosens Bioelectron, 18 (2003) 907-916.
[58] S. Melamed, L. Ceriotti, W. Weigel, F. Rossi, P. Colpo, S. Belkin, Lab Chip, 11 (2011) 139-
146.
[59] M. Varshney, Y.B. Li, Talanta, 74 (2008) 518-525.
[60] B. Podola, M. Melkonian, J Appl Phycol, 17 (2005) 261-271.
[61] J.H. Lee, R.J. Mitchell, B.C. Kim, D.C. Cullen, M.B. Gu, Biosens Bioelectron, 21 (2005)
500-507.
[62] Y. Kuang, I. Biran, D.R. Walt, Analytical Chemistry, 76 (2004) 2902-2909.
[63] I. Biran, D.M. Rissin, E.Z. Ron, D.R. Walt, Anal Biochem, 315 (2003) 106-113.
[64] M.T. Giardi, L. Guzzella, P. Euzet, R. Rouillon, D. Esposito, Environmental Science &
Technology, 39 (2005) 5378-5384.
[65] W.Y. Liao, C.H. Weng, G.B. Lee, T.C. Chou, Lab Chip, 6 (2006) 1362-1368.
Environmental Monitoring
388
[66] P. Ertl, S.R. Mikkelsen, Analytical Chemistry, 73 (2001) 4241-4248.
[67] N. Sanvicens, N. Pascual, M. Fernández-Argüelles, J. Adrián, J. Costa-Fernández, F.
Sánchez-Baeza, A. Sanz-Medel, M.P. Marco, Analytical and Bioanalytical
Chemistry, 399 (2011) 2755-2762.
[68] C.A. Rowe-Taitt, J.W. Hazzard, K.E. Hoffman, J.J. Cras, J.P. Golden, F.S. Ligler,
Biosensors and Bioelectronics, 15 (2000) 579-589.
[69] K.E. Sapsford, C.R. Taitt, S. Fertig, M.H. Moore, M.E. Lassman, C.M. Maragos, L.C.
Shriver-Lake, Biosensors and Bioelectronics, 21 (2006) 2298-2305.
[70] M.M. Ngundi, L.C. Shriver-Lake, M.H. Moore, M.E. Lassman, F.S. Ligler, C.R. Taitt,
Analytical Chemistry, 77 (2004) 148-154.
[71] N.A. Rakow, K.S. Suslick, Nature, 406 (2006) 710-713.
[72] N.V. Kulagina, M.E. Lassman, F.S. Ligler, C.R. Taitt, Analytical Chemistry, 77 (2005)
6504-6508.
[73] C.A. Rowe, S.B. Scruggs, M.J. Feldstein, J.P. Golden, F.S. Ligler, Analytical Chemistry,
71 (1998) 433-439.
[74] C.A. Rowe, L.M. Tender, M.J. Feldstein, J.P. Golden, S.B. Scruggs, B.D. MacCraith, J.J.
Cras, F.S. Ligler, Analytical Chemistry, 71 (1999) 3846-3852.
[75] K.E. Sapsford, A. Rasooly, C.R. Taitt, F.S. Ligler, Analytical Chemistry, 76 (2003) 433-
440.
0
Environmental Monitoring Supported by the
Regional Network Infrastructures
Elisa Benetti, Chiara Taddia and Gianluca Mazzini
Lepida SpA, Viale A. Moro 64, 40127 Bologna
Italy
1. Introduction
The aim of this chapter is the presentation of studies and research results concerning
environmental monitoring techniques promoted by Lepida SpA across a wide area, the Italian
Emilia-Romagna Region.
Lepida SpA Lepida SpA (2011) is an in house providing company established by a Regional
Law (11/2004, “Regional Development of the Information Society”) of Emilia-Romagna
region, which consolidates a common vision and a collaborative approach with the local
Public Administrations.
Lepida SpA was created in the end of 2007 by the Emilia-Romagna Regional Government,
as unique shareholder and founder. Currently has 395 Public Administrations and Public
Entities as shareholders. Lepida SpA is involved in the governance of the Regional ICT Plan
which defines the regional ICT strategies and policies within the regional territory, acting as
innovation facilitator among its partners.
The core business of Lepida SpA is represented by the regional ICT infrastructure but
its operations range between telecommunication networks, digital divide and broadband
networks strategies and ICT applications and services. Among the main activities
and experiences pursued by Lepida SpA we can mention: the planning, development,
management and monitoring of the telecommunications networks (fixed and mobile) of the
P.A., including the deployment of new broadband networks (wired and wireless) within
the region; the definition and implementation of suitable solutions for the Digital Divide
topics and for the Next Generation Access Networks in order to ensure high speed internet
for the citizens and businesses; the realization of ICT platforms and services for the Public
Adminitrations (federation of authentication, payments, ) that enable a large number of
on-line services in favor of citizens and Enterprises; the realization of on-line services for
e-Governement purposes and interaction between the P.A. and the Enterprises and citizens.
The infrastructure provided by Lepida and owned by the Public Administrations partners
of Lepida spA, is an heterogeneous interconnected network covering the whole regional
territory (more than twentytwo thousand square kilometers of area). It includes a regional
area network (Optical Fiber) called Lepida, wireless networks (Hyperlan) that are extensions
of Lepida which allow to solve Digital Divide in some mountain territories, and a regional
emergency digital radio network (TETRA) called ERretre. A map of the Optical Fiber and
Hiperlan link is illustrated in Figure 1.
22
2 Will-be-set-by-IN-TECH
The availability of this powerful infrastructure offers many opportunities for the P.A. to
deploy and provide useful and interesting services to the citizens. Furthermore it represents
a unique great regional test bed for the development and testing of new applications and
services exploiting the potential of the ICT infrastructures.
Fig. 1. Optical Fiber and Hiperlan link
In particular, this chapter will present efficient sensor network applications promoted by
Lepida SpA and based on the regional hybrid access network, with the aim to realize
environmental monitoring through an efficient usage of the territorial assets, by reaching
therefore the important goal of public resources savings. The effort of Lepida SpA has
been directed towards two primary directions: the first one is the exploitation of the Lepida
SpA networks as a communication infrastructure that enables the messages exchanged by
the softwares of data management that the Public Administrations already owns and uses
for their environmental monitoring activities; the second one, besides the exploitation of
the Lepida SpA networks like described in the first model, also proposes the usage by the
Public Administrations partners of a proper software and/or hardware platform of data
management, planned, tested and promoted by Lepida SpA.
In order to achieve this aim Lepida SpA has adopted a research method based on the following
steps: 1) census of the sensor networks and communication networks used for environmental
monitoring purpose, existent and operating across the whole regional territory 2) proposal of
architectural, infrastructural and application service solutions 3) realization of experimental
test-beds 4) adaptation and tuning of the solutions proposed during the second step in view
of the results obtained during the third step 5) realization of a full service.
The census activity has been performed all over the Emilia-Romagna territory, by taking into
consideration all the Public Organizations. This investigation has highlighted the presence of
a huge amount of small sensor networks deployed all over the regional territory, consisting
of spatially distributed devices for the monitoring of environmental conditions, such as
temperature, sounds, pollutant, traffic, river and basin and also a lot of cameras for the video
surveillance and video environmental monitoring. Typically they have been realized in the
390
Environmental Monitoring
Environmental Monitoring Supported by the Regional Network Infrastructures 3
past as independent and autonomous systems, each one by using its own communication
network to transport the collected data, each one by using its own sink to elaborate the data
and each one belonging to a specific local Public Administration.
This scenario often brings the local Public Administrations to inefficient and expensive
managements and maintenance of the data transmission, collection and elaboration. In such
a scenario, the two working directions followed by Lepida SpA and mentioned above, can
represent an effective way for the Public Administrations to pursue environmental monitoring
activities while saving as much as possible resources and while following economies of scale.
In particular Lepida SpA has defined a centralized architecture Taddia et al. (2009) based
on a centre of collection, elaboration, management and diffusion of the sensor data that,
by exploiting the hybrid access regional network, beside solving the inefficiencies can also
provide further benefits that would be impossible to realize with independent and separate
management systems. Let us mention just a few of the possible benefits enabled by the
architecture promoted by Lepida SpA: data sharing among different Public Administration
by saving the data property thanks to authentication and profilation solutions; correlation
of data belonging to different Administrations. Lepida SpA has tested this architecture with
some Public Administrations Taddia et al. (2010).
This chapter starts with a description of the adopted research method, by giving a
comprehensive description of the first step of this research, the census of the resources
available inside the Emilia-Romagna region. The rest of the chapter will describe more
in detail how the aforementioned research method has been applied to three scenarios,
by presenting three test bed actived by Lepida SpA in collaboration with three Public
corporations: River Basin Consortium of the River Po affluents, Drainage Consortium of the
western Romagna, River Monitoring for the Civil Protection of the Emilia Romagna Region.
The three cases all exploit different network technologies among the ones offered by the the
hybrid regional infrastructure, depending on factors such as the geographical position of the
monitoring systems and the amount of data exchanged during the monitoring process.
2. Research methods
The method adopted by Lepida has performed, as a first step, an exhaustive census of all
the automatic sensor networks deployed in the regional territory, not already integrated with
regional sensor networks (sensor networks owned and managed by a regional Entity called
ARPA ARPA (2011), Regional Agency Prevention and Environment for the Emilia-Romagna
region). The Public Administrations in fact, may acquire and use their own networks in
order to meet local needs that are within their competence. In order to carry out the census,
all municipalities, provinces, the River Basin Consortium of all the provinces and the civil
protection have been contacted. For each network, the following items have been surveyed:
type of measured data, number of sensors used, number of data loggers used, transmission
media and the Administration involved. Offices for environment and mobility, farming,
civil protection and provincial police, have been consulted in main cities of each province.
Received responses have been inserted in a database containing the following information:
the owner Administration, the service manager, the operator, type of monitoring, number of
stations installed, number and type of sensor used and the transmission media. Subsequently
an analysis of these responses has highlighted different trends and consolidated needs,
depending on the responsible Administration and its skills and jurisdiction. Various types
of networks, used by different Administrations, that have been found thanks to the census,
are shown in Figure 2.
391
Environmental Monitoring Supported by the Regional Network Infrastructures
4 Will-be-set-by-IN-TECH
Fig. 2. Types of monitoring systems related to different entities
Fig. 3. Models of integration.
Afterwards, for each type of monitoring system, the type and number of sensors used have
been mapped, so that their spread could be better understood. As a result was noted that
the most common sensors are: the inductive coil (its low cost and its simplicity of use have
made it the leader in sensor networks for traffic monitoring); the camera (used by local Public
Administrations in response to a need of an improved security for citizens, furthermore the
wealth of information intrinsic in its data detected, that is a stream of images, makes this
sensor suitable also for other applications such as traffic monitoring or rivers flow control);
the inclinometer (its purpose is related to applications for landslides monitoring).
392
Environmental Monitoring
Environmental Monitoring Supported by the Regional Network Infrastructures 5
A further analysis about possible efficient architectures that could be proposed to shareholders
Administrations, pointed out that is desirable to integrate all existing networks, both for
surveillance systems, which are increasingly spreading throughout the territory, and for
landslides monitoring, currently managed in a summary way. The presence of a unique wide
regional network on the territory, composed by Lepida and ERretre, makes this integration
possible and it represents also the opportunity to have a uniform and guaranteed transmission
of data gathered by all sensor networks. Three different models of integration with Lepida
network have been proposed, as shown in Figure 3. Two of them exploit a small hardware and
software module programmed by Lepida SpA and called BlackBox, which is mainly devoted
to the integration between the communication infrastructure and the sensors.
(a) IP and TETRA driver: a monitoring station, provided by third-parties, on one hand
interfaces to sensors and on the other hand to the most suitable telematic infrastructure,
chosen between Lepida and ERretre, through suitable management drivers;
(b) Gateway: a control board interfaces to the monitoring station provided by third-parties
through a proprietary protocol or through the standard protocol Modbus. The BlackBox,
on the transport network side, provides the most suitable driver depending on the
transmission media that will be chosen;
(c) Direct interface: the BlackBox could directly interface to sensors and at the network side
performs the gateway functionalities as described in step (b).
The results obtained by the census activities have given the room of defining a suitable
architecture able to face the problematic arisen, both in terms of data management system and
in terms of communication technologies and infrastructures. Starting from this architectural
solutions, some test-beds have been activated nad they will be described in detail on the
following Sections.
3. River basin consortium
The subject involved in this testing is the River Basin Consortium of the “Po” River, an agency
that deals with the emergency activities related to the water channels and seismic events of
“Piacenza”, “Parma”, “Reggio-Emilia” and “Modena” territories.
The current sensor network that the River Basin Consortium owns and uses presents a lot
of problematic aspects: these are particularly correlated to the communication networks
currently used, and to the management and storage of data. The data management and
storage are fully delegated to private companies that do not offer a system able to ensure
the necessary levels of availability and persistence of data. Furthermore, data are distributed
on different servers that differ in technology and data representation: there is not a single
centralized system that could gather all available information in a standardized format.
Lepida SpA in this case has proposed to the River Basin Consortium of the “Po” River a
test-bed activity based both on an interface to the communication infrastructure provided by
the ERretre network, and on a prototype of a data management center that could satisfy all the
needs requested by a full monitoring system.
3.1 BlackBox
The BlackBox prototype has been realized through a control board based on ARM Linux.
As shown in the second model of Figure 2 it could be connected transparently to
all proprietary tracking stations which export the Modbus interface. This is an open
serial communication protocol, master-slave or master-multislave, developed to transmit
393
Environmental Monitoring Supported by the Regional Network Infrastructures
6 Will-be-set-by-IN-TECH
information between several PLCs (Programmable Logic Controllers) through a network
connection and has become, over the years, a de facto standard communication protocol for
the industry. Otherwise, in the third model schematized in Figure 2, the BlackBox provides the
management of three different types of sensors: digital sensors, that could also be connected
in a multiple modality through a multi-master and multi-slave communication bus; a single
generic alarm button; a single serial sensor.
In order to properly handle these three types of sensors, for each one of them a dedicated
parallel task has been implemented in the BlackBox: this ensures the management of any
kind of warning, even asynchronous, from sensors. Furthermore, the BlackBox interfaces
to the network both to transmit data and receive commands, through two different ways:
either using the Ethernet connection for communication via IP or the serial connection for
communication via Tetra terminal, in this case by SDS. The software is based on a task that
periodically requests a measure to all the sensors connected and sends them to the data
collection center, also managing the reception of any command configuration parameter, such
as changing the sampling rate or actuating connected devices, for example an acoustic or light
signal. A software unit receives as input the messages sent by the BlackBox, interpreting and
storing them properly. The server where this unit resides, is interfaced both to the IP network
and ERretre through a modem connected to a ttyUSB port. In particular, when a message
is received the unit, according to the opcode message and to the sender sensor typology,
properly extracts the information and stores them in a table or in another textual file available
in the system and used by the entity, considering them as a single sensor in a unique instant
of sampling. A single message, in fact, could also contain several measures of a unique sensor
but related to subsequent sampling instants, or measures sent by different sensors but related
to the same sampling instant.
The experimentation with the River Basin Consortium is based on the second model of
integration and, due to the isolated location of the test-bed site which does not allow an
ethernet connection to the Lepida Network, the communication is done via SDS.
3.2 Landslides monitoring
The test-bed organized by Lepida SpA was installed on the 16th of July, 2010, at the landslide
by Fosso Moranda, in the Polinago municipality, province of Modena. It consists of a
proprietary survey station (Datalogger) with two biaxial inclinometers at different depths,
which perform accurate measures related to millimetric movements of the ground, and
a piezometer, which measures the hydrostatic pressure, attached to it. The BlackBox is
connected to a Tetra modem for the transmission of data, according to the configuration where
the detection station acts as a slave and the BlackBox is both the master and the gateway
towards the Tetra transmission network, as shown in Figure 4. The system is powered by
a photovoltaic panel and is normally turned off. At a scheduled sampling rate, typically
every hour, the monitoring station will “wake up” and control the power supply of the entire
system: both Tetra modem and Blackbox. The BlackBox requests to the station data from
sensors, then sends the response message to the data management center and commands
the proprietary station, that supervises the power control, to shut down the system. The
communications between the proprietary station and the BlackBox physically occur through
a serial connection and logically exporting at both sides the standard interface Modbus,
as previously explained. In addiction to specific parameters the system also includes the
monitoring of the backup battery level, which is useful in checking the functioning of the
whole automated measurement system. All processed data have a low weight, that is about
394
Environmental Monitoring
Environmental Monitoring Supported by the Regional Network Infrastructures 7
Fig. 4. Cabinet and installation site
20 bytes for each transmission. However the test-bed is highly significant because it is related
to a real installation site characterized by particularly hostile conditions, located in an isolated
area without any continuous electrical power available. The activation of the whole system
has been made possible thanks to a survey about Tetra modems on the market and the
identification of which one of them are compatible with the regional network. These could
be, unlike ordinary terminals, turned on and off through a simple contact, providing less
current absorption and having a lower price.
As a consequence of the good results achieved, the River Basin Consortium and Lepida Spa
has arranged a second experimentation phase that should include three new installations
connected to multiple sensors and an extension of the BlackBox features, such as remote log
retrieval, remote change of the frequency sampling.
3.3 LabICT and Data Management Center
In a previous research phase, a prototype of a unified Data Management Center (DMC) was
internally carried out at Lepida SpA R&D Laboratory, in order to receive data, normalize
and validate them depending on operation thresholds according to their type and brand. A
further analysis of data also allowed a cross-checking of different sensors to trigger alarms for
values exceeding from defined thresholds, or for failures. An initial authentication foresaw
a base profiling that determined primarily two types of users: basic and operator. for the
basic one, thanks to a web interface, a real-time graph with the last samples gathered could
be visualized, an historic archive including all measurement done could be consulted and
these values could be sent, in a graphic format or through a pdf table, to an e-mail address.
Moreover a map showed the location of the stations and the BlackBoxes installed all over the
regional territory; for the operator one, in addition to the basic features, this type of user could
395
Environmental Monitoring Supported by the Regional Network Infrastructures
8 Will-be-set-by-IN-TECH
insert new units and sensors pertaining to his entity or his partners. Finally he could define
new alarm thresholds.
Although this system was quite complete, it had been implemented with the aim to show
its potential in environmental monitoring and some features were in an embryonic stage
of development. As a result of an increasing interest and a great satisfaction showed by
the entities, at the end of the experimental phase, starting from this previous experience
the prototype is evolved into a more complex and efficient solution taking advantage
of the LabICT-PA (Laboratory for Information and Communication Technology for Public
Administration). The LabICT-PA, created in 2007 by the Emilia Romagna region, is part
of the Regional High Technology Network and aims to accelerate innovation in public
administration. Since 2011 LabICT-PA is also a member of Europeean Network of Living Labs
ENoLL (2011). The organizational model of LabICT-PA is based on the living labs, where the
functional requirements and specifications are defined by and with the users, that is Public
Administrations. Design and testing phases will be also carried out through a continuous
dialogue with end users. The main partners and their roles in this living lab are: the Emilia
Romagna Regional Government that determines the police through the ICT plan; Lepida SpA
that, as in house providing company established by a regional law, coordinates activities
and provides technical competences and effort; almost 400 public shareholders of Lepida
SpA that represent end users; almost 100 business partners, called the club of stakeholders
Lepida, that are the think tanks that create added value for PA and for the market; finally
universities and research institutes serve as research partners for the laboratory. In this sensor
networks context, LabICt-PA has created a fully working prototype, non-engineered, of data
management center for sensor networks.
3.3.1 Architecture
Fig. 5. Data Management Center Architecture
This project aims to integrate all sensor networks deployed in the region through the
implementation of a shared platform that could uniformly handle all kinds of environmental
data. Firstly, the database of the previous prototype was completely revised to improve the
management of the data, intended as a single measure detected by the sensor, making it the
most generalized as possible. In fact, the main architectural features are:
396
Environmental Monitoring
Environmental Monitoring Supported by the Regional Network Infrastructures 9
• Modularity: each block is independent and communicates through the exchange of XML
files;
• Scalability: each module can be implemented on different physical machines;
• Configurability: main operating parameters could be defined in a database, including the
definition of new types of sensors, thresholds, alarms, and so on.
All sensors have been schematized in a hierarchical way so that multiple sensors may depend,
whether or not, on a BlackBox, which can be connected to another unit, too, for example
proprietary stations. Each one of these elements is categorized as a sensor, this is because they
are all able to send and receive signals, moreover each sensor can perform different types of
measurement with different timing for the acquisition. Finally, measures may be punctual,
aggregated or their avarage is calculated, depending on various time intervals. In addition
to the tables dedicated to sensors management, the database also includes additional tables
necessary to provide addresses, ticketing, alarms, profiling, logging. The Middleware, the
Control Center and the Monitoring Center consist of opensource units (Figure 5): each one
has its own characteristics, in order to satisfy all the features proposed and also maintain
a huge flexibility, in fact each unit inside t he project is independent from the others. The
whole managing of data within the Data Management Centre can be divided into three main
phases, acquisition, processing, viewing, and this allows to describe each single functional
unit. Heterogeneous data sources will be homogenized by the first standardizing unit and
then the measures will be evaluated by the analysis unit that will validate them and will
check all alarm thresholds. The alarm and diagnostic unit will be contacted by both units and
manages and logs the events. Finally, the validated data will be displayed by the visualization
unit through a web interface. Communications between two different units are done by using
Web Services.
3.3.2 Data standardization unit
This module is the interconnection and standardization middleware between the data and the
central unit, therefore plays the role of collector and uniforms data sent from different sources
storing them in the database of the DMC. It is based on the following elements:
• Atomic modules for data retrieval: are used to retrieve the data, both automatically at a
preset timeslot and on-demand, gathering data from various sources or databases. Inside
each atomic unit the access procedure and the detailed commands used to retrieve data
from a specific source are specified.
• Atomic units manager: is always active and coordinates the required units. It also serves as
a collector for messages sent by the individual atomic modules and redirects them through
the units of communication, alarming, diagnostics and data analysis.
• Communication unit: it allows the manager to communicate with other modules inside
the platform, on one hand by collecting the total number of messages and errors from the
manager, on the other hand receiving as input all requests sent by the DMC and directed
to the manager.
Output messages produced by this unit are: the standardized data subsequently stored on
a centralized database, the notification messages that new data has been inserted in the
database so that the proper unit could start to analyze them, errors and log messages that
are transmitted to the diagnostic unit.
397
Environmental Monitoring Supported by the Regional Network Infrastructures
10 Will-be-set-by-IN-TECH
3.3.3 Data analysis unit
Its purpose is to control the last data processed by the unit of standardization and to do
periodic monitoring on the centralized database in order to trigger the following types of
alarms:
• Failures: they occur in two cases, when the unit detects that a certain sensor does not send
values in a timeslot that is longer than the sampling rate specified for that sensor, or when
the measure is not performed correctly in respect to the working range of the sensor.
• Alerts: several alert situations can be assigned to a unique measure and they may depend
on the overcoming of a minimum or maximum threshold, or on an excessive increase or
decrease of the measure compared to the previous value stored. The amount of subsequent
occurrences of the same state of alert, that must be verified before triggering the proper
signaling to the unit of alarms and diagnostics, could be also specified.
• Simplex: this event is triggered as a result of the simultaneous testing of multiple alarm
conditions. In a unique simplex both alerts and failures could be associated, linked
together by logical operators (and, or, not) so that an event could be characterized by
critical conditions based on multiple sensors in very complex relationships.
When one of these alarms occurs, it is communicated to the alarm and diagnostic unit
specifying which sensor has triggered the alarm event, the type of event and which alert
message has been associated to the event, so that all information needed are forwarded to
the dedicated unit, due to simplify and speed up its alarm procedures.
3.3.4 Alarm and diagnostic unit
In addition to alarms generated by the analysis unit, all units part of the system architecture
could send error messages in case there is a generic malfunctioning in the DMC such as
database connection errors, query failed, units that are not working and so on. The diagnostic
unit is implemented using a web service SOAP and handles all the incoming XML requests
storing and logging them properly. If they are associated with one or more alarm procedures
the unit sends the warning message to one or more users by an email, an SMS or an SDS on
a Tetra terminal. Finally, the unit manages generic events that could be scheduled at certain
timeslots and which may be linked to the linear chart of a sensor so that when a value exceeds
from its alarm, an e-mail should be sent not only including a warning message but also with
the graph related to the sensor involved as attachment, due to have a visual feedback of the
current situation.
3.3.5 Data visualization unit
This unit is based on a web site consisting of several forms that allow the user to query and
monitor the various data structures included into the DMC. All the forms have been integrated
into a single portal and are made up of different tabs, available on the main screen of the
site. A tree view in the left side of the web site represents all the system control stations and
sensors connected to them, then each sensor will match one or more type of measures. This
tree is generated according to the initial login: in fact an association is possible between a
profile and a user, that specifies which sensors he could visualize. The icons of the tree have
different colours to provide visual indications about the status of each sensor: green if the
sensor works correctly, red in case of alert, yellow in case of failure and gray if is disabled. The
tree view allows the selection of multiple components. A geo-referenced map of the region
is also provided in the homepage and the markers shown on it indicate the stations installed
398
Environmental Monitoring
Environmental Monitoring Supported by the Regional Network Infrastructures 11
Fig. 6. Data Management Center homepage
using colors in agreement with those defined for the tree view icons. Clicking on a marker
a description of the unit and a description of the sensors connected to it are shown. The
additional tabs are:
• Real-time monitoring: it provides a graphical and tabular representation of the last data
sent by the sensors. The measures to be displayed can be selected through the tree view.
The chart adapts its time scale according to a selection done in a drop down menu and then
automatically updates itself every 5 seconds. In Figure 6, for example, a multiple real-time
chart related to one inclinometer, the piezometer and one ARPA pluviometer is shown.
• Analysis of historical data: in this tab, data could be analyzed with an historical depth that
is greater than the one on the real time tab, selecting a start date and a period to display. It
’can be downloaded locally both in a graphic and a tabular format.
• Logs viewing: provides a list in chronological order of all the significant events detected in
relation to sensors failures (started or stopped), alerts (started or stopped), invalid values,
and so on.
• Platform management: supplies some statistics about the current state of the system, for
example the status of the various units involved and an overview of all detected events.
4. Drainage consortium of western Romagna
A Drainage Consortium is a public corporation that coordinates both public actions and
private activites concerning the drainage of its territory of scope. For example, hydraulic
399
Environmental Monitoring Supported by the Regional Network Infrastructures
12 Will-be-set-by-IN-TECH
Fig. 7. Drainage Consortiums in Emilia-Romagna region
security, management of the waters intended to the irrigation, involvement into urban
planning, environmental and agricultural heritage protection can be considered typical
activites and actions covered by a Drainage Consortium.
In Emilia-Romagna region eight Drainage Consortiums exist, subdivided depending on their
area of scope, as illustrated in Figure 7. All of them are partners of Lepida SpA, therefore
Lepida SpA is legitimized to be involved for the support of their activities, by favouring
economies of scale.
Currently each Consortium manages a suitable small sensor network, consisting of a set of
data logger, devoted to hydrographical detection and remote control functions, thanks to the
use of Programmable Logic Controllers (PLCs) and sensors connected to the data loggers.
Furthermore each Consortium has got a suitable monitoring system (typically a server hosting
a software system of data management) devoted to the collection of all the gathered data.
Data are exchanged between data logger and server and among the data loggers (often there
is the need to spread some specific control command from a data logger to other data loggers,
by following as a sort of tree communication path) by using analog or GSM technologies
(generally GSM is used to send alarm messages to people that need to be activated in case
of danger or alarm situations while analog communication channels are used for the data
collected by the sensors). Economies of scale could be found in such a scenario, by exploiting
the network infrastructures owned by Lepida SpA.
For this purpose Lepida SpA will support the Consortiums, by starting from the Drainage
Consortium of the Western Romagna Lugo (2011), which has been involved in a test-bed stage.
The condition of the equipement managed by the Drainage Consortium of the Western
Romagna, before the mentioned test bed stage, can be summerized as follows. It is composed
by fifteen data loggers, each one including a PLC with some sensors for the hydraulic
data collection and an analog communication module. Each module communicates the
monitored data trough UHF channel while the alarm signals are sent through GSM network,
by means of Short Message Service (SMS). The monitoring activity is mainly performed by
following a polling communication protocol: a central server, devoted to the data collection
and elaboration, polls each data logger every thirty minutes, by receiving the data that the
sensors connected to the data logger have recorded at a one minute frequency during the last
400
Environmental Monitoring