Báo cáo hóa học: " Automatic identification of gait events using an instrumented sock" docx
Bạn đang xem bản rút gọn của tài liệu. Xem và tải ngay bản đầy đủ của tài liệu tại đây (4.2 MB, 10 trang )
RESEARCH Open Access
Automatic identification of gait events using an
instrumented sock
Stephen J Preece
1*
, Laurence PJ Kenney
1
, Matthew J Major
1
, Tilak Dias
2
, Edward Lay
3
and Bosco T Fernandes
4
Abstract
Background: Textile-based transducers are an emerging technology in which piezo-resistive properties of materials
are used to measure an applied strain. By incorporating these sensors into a sock, this technology offers the
potential to detect critical events during the stance phase of the gait cycle. This could prove useful in several
applications, such as functional electrical stimulation (FES) systems to assist gait.
Methods: We investigated the output of a knitted resistive strain sensor during walking and sought to determine
the degree of similarity between the sensor output and the ankle angle in the sagittal plane. In addition, we
investigated whether it would be possible to predict three key gait events, heel strike, heel lift and toe off, with a
relatively straight-forward algorithm. This worked by predicting gait events to occur at fixed time off sets from
specific peaks in the sensor signal.
Results: Our results showed that, for all subjects, the sensor output exhibited the same general characteristics as
the ankle joint angle. However, there were large between-subjects differences in the degree of similarity between
the two curves. Despite this variability, it was possible to accurately predict gait events using a simple algorithm.
This algorithm displayed high levels of trial-to-trial repeatability.
Conclusions: This study demonstrates the potential of using textile-based transducers in future devices that
provide active gait assistance.
Background
Foot drop is currently estimated to affect approximately
20% of stroke survivors [1]. With this condition, patients
are unable to dorsiflex their ankle due to weak dorsi-
flexor muscles, often accompanied by shortening, con-
tracture and/or spasticity of the plantarflexors [2]. In the
absence of compensatory movements, such as hip cir-
cumduction, the foot can fail to clear the ground during
the swing phase of gait and can often land in an inap-
propriate orientation [3]. As a result, foot drop gait is
slow and energy inefficient and likely associated with an
increased fall risk [4-6].
There are a number of assistive devices which are
designed to minimise the effect of foot drop by main-
taining the foot in appropriate orientation during gait.
These approaches can be considered as either passive
devices, such as ankle foot orthoses, or active devices,
such as functional electrical stimulation (FES) [7] or
intelligent orthoses [8,9]. FES for foot drop conventio n-
ally involves stimulation of the peroneal nerve during
gait to dorsiflex the foot and is now supported by a sub-
stantial body of evidence [10-12]. However, in order to
stimulate muscular contraction during the appropriate
period of gait, FES and other active systems require pre-
cise information on gait phase.
Most current FES systems obtain gait phase informa-
tion from a footswitch located in the heel region of the
shoe. Although, with appropriate signal conditioning,
accurate detection of heel strike and heel lift is possible,
footswitches can be time consuming to set up, are
prone to false event detections when the user weight
shifts and reports have suggest that users dislike them
[13]. Further, recent studies have demonstrated the ben-
efits of additionally stimulating the plantarflexor muscles
during the terminal double-support phase of gait,
requiring the use of 2 footswitches in each shoe [14]. In
some systems a connecting wire is required from the
shoe to the stimulator which can be cumbersome to
* Correspondence:
1
Centre for Health, Sport and Rehabilitation Sciences Research, Blatchford
Building, University of Salford, Manchester, M6 6PU, UK
Full list of author information is available at the end of the article
Preece et al. Journal of NeuroEngineering and Rehabilitation 2011, 8:32
/>JNER
JOURNAL OF NEUROENGINEERING
AND REHABILITATION
© 2011 Preece et al; licensee BioMed Central Ltd. This is an Open Access article distributed under the terms of the Creative Commons
Attribution License (http://creativecommons.o rg/licenses/by/2.0), which permits unrestricted use, distribution, and reproduction in
any medium, provided the original work is properly cited.
users. Furthermore, as the footswitch must be consis-
tently located relative to the foot, shoes must be worn
and so this approach is not well suited to indoor use.
Inertial sensors have been suggested as an alterative to
footswitches for detecting gait phase [15,16]. However,
this approach, which typically relies on inferring gait
events from motion of the shank, can be problematic
for users with particularly poor gait. Furthermore,
neither footswitches nor inertial sensors provide a direct
measurement of ankle joint motion.
Anecdotal reports suggest that, despite training, a
number of users of conventional FES devices locate
their electrodes i ncorrectly, resulting in a poor foot
response during gait. With the advent of electrode
array-based stimulation systems [17,18] that allow for
the software control of both the location and intensity
of stimulation, there is the potential t o automate both
the set up process and cycle-cycle control of stimula-
tion. Such an approach would require a method of mon-
itoringofgaitphaseandfootorientation,notavailable
from footswitch data.
An alternative to either footswitches or inertial sensors
is to derive information on gait phase from a sock
incorporating a textile-based transducer. This approach
offers a number of advantages. Firstly, it would be possi-
ble to i ntegrate the stimulation unit into the sock and
therefore eliminate the need for connecting wires and
increase the ease of use to the patient. Secondly, the sys-
tem would work without footwear and so would be
more suited to indoor use. Finally, as the sensor mea-
sures the joint motion itself, rather than inferring events
from foot loading or shank motion, it may be possible
to obtain more detailed information on gait.
Textile-based transducers consist of either yarns made
from conductive elastic fibers or conductive coatings
applie d to elastic base materials. Both approaches utilise
piezo-resistive properties to sense strain. Most previous
work in this area has focused on either knitted fibre
transducers [19] or smeared conduct ive elastomers
[20-24]. With the first approach, conductive fibers are
knitted within a non-conducting base material, whereas
with the latter approach a mixture of conductor and
flexible material is smeared onto a fle xible substrate. To
date, textile-based transducers have been successfully
utilised for hand posture recognition [20], classification
of upper limb gestures [21] and postures [23,24], moni-
toring respiratory rate [19,25] and detecting events in a
knee flexion trajectory during a landing movement [26].
However, there h as been no previous work attempting
to derive information on gait phase from a sensor posi-
tioned at the ankle.
Textile-based transducers exhibit a high degree of
non-linearity in the relationship between resistance and
deformation. One of the primary causes of this non-
linearity is the vi scoelatic properties of the textiles
which results in a number of phenomena, such as velo-
city dependent r esistance peaks, delayed recovery after
rapid stretching and hysteresis. In previous applicat ions,
these effects have been overcome using either complex
mathematical models [21] or machine learning algo-
rithms [23]. However, in walking, gait phase information
can be obtained from ankle motion in the sagittal plane,
which undergoes periods of rapid movement followed
by periods of relatively slo w change. Given the nature of
this movement, we wanted to investigate whether it
would be possible to extract the salient features of ankle
motion, and therefore derive information on gait phase,
without using a complex modelling approach. This
would clearly be advantageous in any embedded system
desi gned to trigger FES system during walking. In order
to address our research objective, we sought to answer
two questions. Firstly, we aimed to investigate the
degree to which the output of the instrumented sock
matched the ankle joint angle for a range of individuals,
under sock-only and shod conditions. Secondly, we
aimed to establish whether it would be possible to iden-
tify the three key gait events, heel lift (HL), toe off (TO)
and heel strike (HS) using a relatively straight-forward
prediction algorithm. It was felt that this proof of con-
cept study was necessary to assess the suitability of a
textile-based transducer for use with FES systems and
other future active gait assistive devices.
Methods
A Wearable Sensor Technology
The textile-based transducer investigated in this study
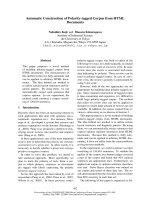
was a knitted resistive strain sensor . Knitted structures
consist of stitches which are arranged in rows and col-
umns and which are bound to the stitches above and
below as shown in Figure 1. The sensor under investiga-
tion is knitted from a non-conductive elastomeric base
material with a low modulus of elasticity. Within this
base structure, a predetermined segment of one row of
stitches is knitted from a n electroconductive yarn (Fig-
ure 1). This yarn consisted of Nylon 6.6 filaments,
coated with a nano layer of silver. During the knitting
process the textile structure is subjected to a high
degr ee of stretch, after which the base structure relaxes,
drawing the stitches together. This creates contact
between adjacent parts of the electroconductive yarn in
the regions where the electroconductive yarn forms the
two limbs of a stitch ( Figure 1). This contact reduces
the effective conductive length of the yarn, lowering the
electrical resistivity. However, stretching the knitted
structure widthways has the effect of breaking the con-
tact between adjacent stitch limbs and therefore increas-
ing electrical resistivity. This resistive strain sensor
technology is patented by SmartLife Technologies Ltd
Preece et al. Journal of NeuroEngineering and Rehabilitation 2011, 8:32
/>Page 2 of 10
and was incorporated into a knitted sock by the knitting
research group at the University of Manche ster. For the
sock, the electroconductive yarn was knitted into two
parallel rows of stitches, connected at the toe end of the
sock. With this design electrical connectors where
placed at the other end of the sock.
In order to understand how the resistance of the
knitted sensor changed in response to an applied strain,
we measured the resistance of a sample undergoing
repeated stretching and relaxing. Figure 2 shows how
theresistancevariesovertimewhenthesampleis
repeatedly stretched and relaxed at 9 mm per second.
From this plot it is clear that the baseline resistance of
the sample gradually decreases over time, however
further analysis showed that this drift could largely be
eliminated by high pass filtering the data at 0.3 Hz. Fig-
ure 3 shows a plot of resistance against strain before
and after high pass filtering. Although there is some
degree of hysteresis, most likely due to the visco-elastic
properties of the textile structure, removal of the base-
line drift produces an approximately linear relationship
between strain and resistance.
Figure 1 Structure of the resistive strain sensor. The individual stitches which make up the knitted resistive strain se nsor. The
electroconductive yarn is shown in white and arrows mark the regions where electrical contact is made as the base structure relaxes after
stretching.
Figure 2 Resistive properties of the instrument sock.Plotof
resistance (solid line) against time showing how the knitted sensor
responds to a periodically applied strain (dotted line). This data
shows a gradual drift in the baseline resistance after several
successive stretches.
Preece et al. Journal of NeuroEngineering and Rehabilitation 2011, 8:32
/>Page 3 of 10
B Data collection
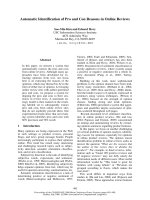
For the main experimental work each subject wore an
instrumented sock on their left leg (Figure 4). To ensure
that a similar fit was obtained for all subjects we
selected between five different sizes of sock depending
on the length and maximum circumference of each sub-
ject’s shank. The sock was secured at the proximal end
with an overwrapped bandage and the sensor connected
to a constant current source power supply. The output
of this set up (which was proportional to the sensor
resistance) was then fed into a Noraxon Telemyo 2400
T G2 data transmission unit. This unit digitised the
input voltage, which typically ranged from 0.2-0.4 V
peak-to-peak, at a sampling frequency of 1500 Hz. The
digitised data was then transmitted to a laptop for visual
checking and storage.
In order to derive kinematic signals during walking,
3D data from a number of reflective markers (Figure 4)
were collected using a ten-camera Qualisys Pro Reflex
system operating at 100 Hz. Calibration markers were
placed on the femoral epicondyles, the ankle malleoli
and the 1
st
and 5
th
metatarsal heads. In addition, track-
ing markers were placed on the lateral aspect of the
shank, calcaneous and dorsal aspect of the midfoot.
Although previous studies have recommended using a
shank marker plate with und erwrapped bandage [27],
pilot work showed us that a bandage could interfere
with the sock output signal. Therefore markers were
fixed directly to the sock with adhesive tape. A static
calibration trial was collected for e ach condition (sock-
only and shod) after which the calibration marker s
where removed for the main walking trials.
Twenty subjects (eight female) were recruited into the
study. The mean (SD) age of the subjects was 43 (18),
mean (SD) height 171 (8) cm and mean (SD) weight 72
(12) Kg. Each subject provided written consent to parti-
cipate and ethical approval was granted by the institu-
tional ethics commit tee. Each subject performed ten
walking trials, at their s elf selected walking speed, in
both a sock-only condition and in a shod condition.
Each trial consisted of approximately 15 steps, with
trials being separated by approximat ely 40 seconds. The
sock was not removed between the different trials and
for the shod condition subjects wore their normal shoes.
Synchronise d kinematic and digitised sock voltage data
was collected for each set of ten trials. Although gait
event timings from consecutive gait cycles can be col-
lected using footswitches, they can only be used during
shod gait. For this study we wanted to investigate sensor
output in both a sock-only and shod condition. There-
fore force-plate data from two AMTI force platforms
was used to collect kinetic data, allowing for identifica-
tion of a single gait cycle for each trial.
Figure 3 Resistive properties of the instrument sock.Plotof
resistance against length change over several stretch-relaxation
cycles (dotted line) and the same data after high pass filtering of
the resistance data (solid line).
Figure 4 Experimental set up. Image of the instrumented sock
with the kinematic markers used for data collection during the
sock-only walking trials.
Preece et al. Journal of NeuroEngineering and Rehabilitation 2011, 8:32
/>Page 4 of 10
C Data Processing
Kinematicdatawasprocessedbyusingthestaticcali-
bration to calculate ankle joint centre and defin e seg-
mental coordinate systems for the shank and foot. The
3D coordinate data for each trial was then used to cal-
culate using Cardan angles. All kinematic calculations
were implemented using Visual3D (C-Motion Inc) and
the data for both sets of trials for all twenty subjects
exported to Matlab for further processing.
In order to compare the kinematic data with the sen-
sor data, the kinematic data was upsampled to 1500
Hz, matching the collection frequency of the sensor
data. Two consecutive heel strikes were then identified
from the two force platforms as the point at which the
vertical component of the ground reaction force
exceeded 5N. These points were then used to define
the gait cycle data for both the kinematic and the sen-
sor signal. HL was t hen identified as the minimum in
the kinematic signal occurring just before toe off. In
order to locate this minimum, the raw 3D coordinate
data was low pass filtered at 6 Hz (zero lag 4
th
order
Butterworth filter) to remove measurement noise. The
minimum in the kinematic signal corresponds to the
point at which the ankle begins to plantarflex in pre-
paration for toe off.
As discussed earlier, high pass filtering of the sensor
signal at 0.3 Hz was required to remove the baseline
drift in the sensor output. This frequency was chosen as
the best compromise to remove the baseline drift in the
sensor signal, yet still retain the low-frequency compo-
nent of human walking. Pilot investigation showed that
optimal gait event recognition could be obtained when
the sensor signal was low pass filtered at 4 Hz. There-
fore, band pass filtering (0.3-4 Hz) was applied to both
the sensor a nd the kinematic signal using a FFT filter.
This allowed the variation between the two signals to be
compared, irrespective of the signal means. Finally, to
remove the effects of signal amplitude, the filtered sen-
sor signal was scaled so that the peak-to-peak range
matched that of the filtered kinematic signal. Example
plots for two sock-only and two shod trials are shown
in Figures 5, 6, 7 & 8.
In order to address our first research question, which
was aimed at understanding the match between the
kinematic and sensor signal, we used two separ ate mea-
sures to quantify signal similarity. These measures have
been used previously to evaluate the accuracy of wear-
able sensors in the predicti on of lower limb kinematics
[28] and are given as:
1. Pearson’s correlation coefficient, r.
2. The normalised mean absolute deviation,
nMAD =
n
i=1
v
i
− ϑ
i
,where
ϑ
i
and
v
i
are the ith
angle and ithvoltagedatapointsinthekinematic
and sensor curves after both have been scaled to
have a peak-to-peak range of unity. The number of
data points across the whole gait cycle is given as n.
Separate measures of signal similarity were obtained
for the sock-only and shod conditions by averaging
across the ten gait cycles (one from each walking trial).
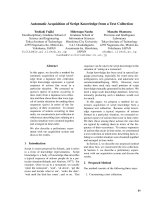
Figure 5 Sensor output (sock-only condition) for subject 1. Plot
of sensor output (solid line) and scaled kinematic signal (dashed
line) against time for a single walking trial from subject 1 (sock-only
condition). The three sets of triangles show the estimated times of
heel lift, toe off and heel strike with the vertical dashed lines
showing the true values.
Figure 6 Sensor o utput (sock-only condition) for subject 20.
Plot of sensor output (solid line) and scaled kinematic signal
(dashed line) against time for a single walking trial from subject 20
(sock-only condition). The three sets of triangles show the estimated
times of heel lift, toe off and heel strike with the vertical dashed
lines showing the true values.
Preece et al. Journal of NeuroEngineering and Rehabilitation 2011, 8:32
/>Page 5 of 10
For this proof of concept study we aimed to investi-
gate whether a relatively simple algorithm could be used
to identify the three gait events from the sensor signal.
Although sensor data from each subject displayed simi-
lar features, these features occurred at different points
in the gait cycle. It was therefore necessary to adjust the
algorithm parameters separately for each individual sub-
ject. Our data showed that sensor output could
sometimes be modified when shoes were worn. There-
fore, algorithm parameters were adjusted separately for
the sock-only and the shod conditions. As our dataset
consisted of a single gait cycle for each trial, the algo-
rithm was implemented as a forward search, staring
from t=0(the first HS), to determine the time of HL,
TO and the second HS. Although this was tested on the
ten separate trials, it could potentially be implemented
on a continuous sensor signal to identify consecutive
gait events.
The final algorithm operated using the stages outlined
below and required adjustment of five parameters (a
1
-
a
5
). Each of these parameters is depicted in Figure 9.
Note that this plot has the units of voltage on the y-axis
as it operated on the raw data from the sensor signal.
The three gait events were identified from the sensor
signal as follows:
1. Identify the first point (P
1
) where the sensor signal
is increasing and excee ds a preset threshold (a
1
). HL
was then identified to be a fixed time offset (a
2
)
from this point.
2. Find the first maxima after P
1
. TO was then iden-
tified to be a fixed time offset (a
3
) from this maxima.
3.Advancebyafixedtime(a
4
)thenfindthenext
maxima. HS was then identified to be a fixed time
offset (a
5
) from this maxima.
The five parameters (a
1
-a
5
). were obtained from the
first five trials of each subject/condition using an auto-
mated search algorithm. This analysed the maximal
values of the signal over the initial stages of the gait
cycle in order to determine the threshold a
1
. It then cal-
culated the mean values of a
2
-a
5
required to accurately
identify the three gait events. To ensure that the
Figure 7 Sensor output (shod conditio n) for subject 8.Plotof
sensor output (solid line) and scaled kinematic signal (dashed line)
against time for a single walking trial from subject 8 (shod
condition). The three sets of triangles show the estimated times of
heel lift, toe off and heel strike with the vertical dashed lines
showing the true values.
Figure 8 Sensor output (shod conditio n) for subject 9.Plotof
sensor output (solid line) and scaled kinematic signal (dashed line)
against time for a single walking trial from subject 9 (sock-only
condition). The three sets of triangles show the estimated times of
heel lift, toe off and heel strike with the vertical dashed lines
showing the true values.
Figure 9 The event detection algorithm. Plot to illustrate the five
parameters used in the event detection algorithm.
Preece et al. Journal of NeuroEngineering and Rehabilitation 2011, 8:32
/>Page 6 of 10
algorithm would work effectively with a raw voltage sig-
nal the four time offse ts (a
2
-a
5
) were f ixed in seconds,
rather that gait cycle time. Once the values for the five
parameters had been set using data from the first five
trials, they were used to predict the three gait events for
the final five trials. Algorithm accuracy was then calcu-
lated as the mean absolute deviation (in %gait cycle)
between the predicted time and true time across the five
trials. In addition, the standard deviation of the differ-
ence between the true and predicted time (%gait cycle)
was used to capture the trial-to-trial repeatability in
event prediction.
Results
Visual inspection of the sensor curves showed that they
displayed the same general characteristics as the kine-
matic signals for both the sock-only and shod conditions
(Figures 5, 6, 7 &8). Specific characteristics included
maxima around HS and TO and minima around HL
and between TO and HS. However, although data for
some subjects showed a close match between the two
conditions, high correlations and low mean absolute dif-
ferences (nMAD), d ata from other subjects w as mark-
edly different (Table 1). To illustrate these differences,
kinematic and sensor signals for a sing le trial have been
plotted for subjects 1 and 20 who showed the best and
the worst match respectively for the sock-only condition
(Figures 5 and 6). Similar data has been shown for the
shod conditions for subject 8 (best match) and 9 (worst
match) in Figures 7 and 8.
The algorithm developed to pr edict gait events was
found to be accurate for HL and TO for both sock-only
and shod conditions with mean errors across subjects
ranging from 1-1.6% gait cycle (Tables 2 and 3). Errors
for HS were slightly higher for both conditions (means
2.6 & 3.3% gait cycle) but still within an acceptable
accuracy (Tables 2 and 3). Standard deviations for each
of the three gait events were comparable with the mean
errors for both the sock-only (Table 2) and shod condi-
tion (Table 3), demonstrating good trial-to-trial repeat-
ability in event prediction. On Figures 5, 6, 7 &8 we
have illustrated the true and predicted gait events for a
number of different signals. These plots show that, even
when there was a mismatch between the kinematic and
sensor signal, the algorithm was still able to predict gait
events to a high level of accuracy. Although it was pos-
sible to implement the prediction algorithm succes sfully
for all subjects in the sock-only condition, it could not
be applied to one subject in the shod condition. This
was due to a peak at approximately 30% gait cycle
which was similar in magnitude to the peak at TO and
which often exceeded the preset threshold (a
1
). For
these data a more complex algorithm would be
required.
Discussion
This study was designed to establish the possibility of
using a textile-based transducer to extract the salient
features of ankle joint motion and derive information on
gait phase during walking. The results demonstrated
that the output of the sensor displayed the same fea-
tures as the ankle joint kinematic signal. However, the
exact match between these two signals varied consider-
ably between individuals. Despite this variability, it was
possible to accurately predict gait events using a simple
algorithm which also showed good levels of trial-to-trial
repeatability.
The textile-based transducer examined in this study
exhibited a number o f n onlinear characteri stics.
Although it was possible to remove the effect of baseline
drift using high pass filtering, preliminary characterisa-
tion demonstrated hysteresis in the relationship between
resistance and strain. Despite this non-linearity, data
from some subjects demonstrated a very close match
between sensor output and the ankle joint kinematic
signal (Figures 5 &7). However, in o ther subjects there
were large discrepancies between the two signals
Table 1 Comparison between the kinematic and sensor
signals
Sock-only Shod
Subject r nMAD r nMAD
1 0.91 0.09 0.59 0.23
2 0.77 0.16 0.56 0.22
3 0.84 0.13 0.7 0.18
4 0.91 0.1 0.84 0.12
5 0.79 0.16 0.39 0.27
6 0.92 0.1 0.87 0.12
7 0.85 0.14 0.83 0.13
8 0.92 0.09 0.8 0.15
9 0.65 0.16 0.05 0.29
10 0.83 0.14 0.7 0.17
11 0.75 0.17 0.4 0.26
12 0.74 0.17 0.5 0.25
13 0.91 0.1 0.71 0.19
14 0.8 0.16 0.56 0.23
15 0.76 0.16 0.82 0.13
16 0.86 0.13 0.5 0.23
17 0.66 0.2 0.53 0.23
18 0.71 0.19 0.18 0.28
19 0.76 0.16 0.46 0.23
20 0.28 0.26 0.22 0.26
Mean 0.78 0.15 0.56 0.21
Two measures of similarity between the filtered sensor signal and the filtered
and scaled kinematic signal for the sock-only and the shod condition. The
measures are the correlation coefficient (r) and the normalised mean absolute
difference (nMAD).
Preece et al. Journal of NeuroEngineering and Rehabilitation 2011, 8:32
/>Page 7 of 10
(Figures 6 & 8). It is possible that these between-subject
differences were the result of differences in the fit of the
sock which could have resulted in the knitted structure
operating around a different point in the resistance-
strain curve. A possible future approach to overcoming
this problem would be to produce a b espoke sock for
each subject to ensure that the amount of str ain experi-
enced by the sensor does not differ greatly between sub-
jects. Alternatively, it may be possible to use a more
complex modelling approach to predict the response of
the sensor across different individuals. However,
although modelling approaches have been used before
in studies of textile-based transducers [21], they may
not be a viable option for an embedded FES controlled
which must work in real-time.
To investigate the possibility of using a textile-based
transducer in future FES applications, we developed an
algorithm for gait event detection which was based
aroundtwospecificsignalfeatures.Thesewerearapid
incr ease and peak around TO and a subsequent peak at
the end of the gait cycle. The first of these two features
corresponds to the rapid ankle plantarflexion which
occurs just prior to TO. Our analysis showed that this
feat ure exhibited high levels of ste p-to-step repeatability
as demonstrated by the l ow standard deviations in the
prediction accuracy of HL and TO. However, the larger
standard deviations found for HS showed that the sec-
ond feature, the peak at the end of the gait cycle, exhib-
ited slightly lower levels of step-to-step repeatability.
Previous studies have investigated the accuracy of
using footswitches, accelerometers, gyroscopes and even
neural sensors [29] to predict gait events. Footswitches
are used in most commercial FES applications and have
been shown to predict gait events to within 0.5-2% gait
cycle [30,31], slightly better than the accuracies reported
in this study. In a recent study, Lau and Tong [16]
investigated the potential of using accelerometers and
gyroscopes to identify gait events in both healthy sub-
jects and subjects with foot drop. Using an approach
similar to that presented in this paper, they investigated
the step-to-step variability in timing of maxima and
minima in the sensor signals, suggesting these points
could be used as the basis of a gait event prediction
algorithm. Their results showed that, in healthy subjects,
peaks in accelerometer signals mounted on the foot or
shank, showed a mean variability of approximately 2%
gait cycle, similar to the accuracies reported in this
paper. Mansfield and Lyons [32] investigated the possi-
bility of using a trunk-mounted accelerometer to id en-
tify heel contact of both limbs. Their study showed that
Table 2 Gait prediction error for the sock-only condition
Subject Mean HL Std HL Mean TO Std TO Mean HS Std HS
1 0.6 0.2 0.4 0.5 0.9 1.2
2 0.6 0.6 0.3 0.2 0.8 0.5
3 0.6 0.8 0.7 0.7 2.6 0.7
4 1.6 0.8 0.8 0.2 2.8 3.1
5 2.1 1.7 0.5 0.5 1.8 1.9
6 0.2 0.3 0.5 0.2 2.1 1.9
7 1.6 0.8 0.9 1.4 4.5 3
8 0.6 0.6 0.7 0.7 2.6 0.6
9 1.8 0.8 1.8 2 1.3 1.3
10 1.6 2 2.3 2.5 3.5 6.4
11 0.7 0.8 1.1 0.9 3.8 1
12 1.4 1.9 1.8 2.8 5.1 7.7
13 0.5 0.6 0.3 0.4 3.3 1.9
14 0.9 0.4 0.3 0.4 2.4 1.5
15 2.2 1.6 0.9 1.1 2 2.3
16 1.9 1.7 1.6 2.5 2.6 3.6
17 2.3 2.2 1.5 1.6 1.2 1.4
18 1.9 2.4 1.5 1.8 3.6 5.2
19 1.2 1 0.6 0.7 4 2.3
20 1.3 1.2 1.5 1.5 0.9 1
Average 1.3 1.1 1 1.1 2.6 2.4
Mean and standard deviation of the error in the prediction of the three gait
events, HL (heel lift), TO (toe off) and HS (heel strike), expressed as %Gait
cycle for sock-only condition.
Table 3 Gait prediction error for the shod condition
Subject Mean HL Std HL Mean TO Std TO Mean HS Std HS
1
2 0.5 0.4 0.6 0.7 0.8 1
3 0.8 0.9 0.6 0.6 2.1 2.5
4 0.7 1 0.4 0.4 4 3.8
5 3.7 3.6 8.6 7.2 15.2 17.1
6 0.8 1 0.3 0.3 5.7 6.5
7 1.6 1.1 1.1 1.5 1.7 1.7
8 1 1 1.8 1.2 0.4 0.5
9 1.2 1.5 0.9 0.9 3.1 2.3
10 0.8 0.7 1.1 1.1 1.4 1.5
11 1.3 1.2 0.8 0.7 1.7 1.6
12 4.5 4.4 1.8 2.7 6.1 9.8
13 3 2.4 1.2 0.4 1 0.9
14 1 0.8 0.7 0.8 1.2 1.4
15 0.8 1.1 0.8 0.8 2.7 1
16 3.3 2 2.4 3.3 4.1 3.5
17 1.2 1.7 0.4 0.4 0.3 0.4
18 2.3 2.4 2.9 4.6 4.3 7.2
19 1 1.4 0.8 0.9 5.9 7
20 1.2 2 1 0.9 0.8 0.8
Average 1.6 1.6 1.5 1.6 3.3 3.7
Mean and standard deviation of the error in the prediction of the three gait
events, HL (heel lift), TO (toe off) and HS (heel strike), expressed as %Gait
cycle for the shod condition.
Preece et al. Journal of NeuroEngineering and Rehabilitation 2011, 8:32
/>Page 8 of 10
there was an observable delay between heel contac t and
a negative-positive change in acceleration. However,
most subjects demonst rated a relatively large standard
deviation in this delay which equated to approximately
2-8% gait cycle. Sinkjaer et al [33] reviewed the small
number of studies reporting on the use of neural sensor
signals for detecting h eel strike and foot lift off. When
used in conjunction with a machine learning algorithm
in a subject with foot drop, these signals were shown to
provide detection of heel strike within 50 ms. However,
detection of TO tended to be less accurate with errors
up to 220 ms, equating to more than 10% of the gait
cycle.
There are a number of limitations to the current proof
of concept which will need to be addressed if systems
using textile-based transducers are to be used in future
FES or other active gait assist devices. Firstly, the pro-
posed algorithm locates HL and TO at specific times
behind the occurrence of events in the sensor signal.
This means that, although the algorithm works well for
off-line processing, it would not be effective in a real-
time system. Furthermore, the proposed algorithm
requires a number of individual-specific thresholds to be
set. Future work must now f ocus on algorithms which
can automatically adapt to individual differences in sen-
sor output and predict gait events from signal character-
ist ics which occur before the required gait events. With
more advanced approaches it should be possible to
eliminate the need for manual adjustment of thresholds
whilst still maintaining a level of computational com-
plexity which could be implemented within an
embedded controller. Another limitation of the study
wasthatitwasperformedonindividualswithnormal
gait patterns in a controlled laboratory environment.
Clearly, future work must focus on patients with drop
foot and establish the feasibility of using an instrumen-
ted sock in a real-world setting.
Conclusions
In summary, our data showed considerable inter-subject
variability in the match between the signal from an
instrumented sock and ankle motion in the sagittal
plane during normal walking. However, using a rela-
tively straight-forward algorithm, we were able to pre-
dict three gait events to a high degree of accuracy with
good trial-to-trial repeatability. Although more complex
algorithms would be required, our r esults demonstrate
the potential of using a textile-based transducers in
future FES applications.
Acknowledgements
The authors gratefully acknowledge the funding from the UK National
Institute of Health Research (project NEAT FSE010).
Author details
1
Centre for Health, Sport and Rehabilitation Sciences Research, Blatchford
Building, University of Salford, Manchester, M6 6PU, UK.
2
School of Art and
Design, Nottingham Trent University, Burton Street, Nottingham,
Nottinghamshire, NG1 4BU, UK.
3
School of Materials, The University of
Manchester, Manchester, M13 9PL, UK.
4
School of Electrical and Electronic
Engineering, The University of Manchester, Manchester, M13 9PL, UK.
Authors’ contributions
SJP was involved in the design of the study, data collection and writing of
the manuscript. LPJK and TD conceived the original idea, contributed to the
study design and helped to draft the manuscript. MJM was involved in data
collection, processing and in some aspects of the experimental design and
EL and BF were involved in the development of the experimental set up
including the design and manufacture of the instrumented socks All authors
read and approved the final manuscript.
Competing interests
The authors declare that they have no competing interests.
Received: 28 September 2010 Accepted: 27 May 2011
Published: 27 May 2011
References
1. JH Burridge, PN Taylor, SA Hagan, DE Wood, ID Swain, The effects of
common peroneal stimulation on the effort and speed of walking: a
randomized controlled trial with chronic hemiplegic patients. Clin Rehabil.
11, 201–210 (1997). doi:10.1177/026921559701100303
2. JH Burridge, DL McLellan, Relation between abnormal patterns of muscle
activation and response to common peroneal nerve stimulation in
hemiplegia. J NeurolNeurosurgPsychiatry. 69, 353–361 (2000)
3. R van Swigchem, V Weerdesteyn, HJ van Duijnhoven, J den Boer, T Beems,
AC Geurts, Near-normal gait pattern with peroneal electrical stimulation as
a neuroprosthesis in the chronic phase of stroke: a case report. Arch Phys
Med Rehabil.92, 320–324
4. G Gillen, A Burkhardt, Stroke Rehabilitation: a Function-Based Approach. (St.
Louis, USA: Mosby-Year Book, Inc., 1998)
5. L Jorgensen, T Engstad, BK Jacobsen, Higher incidence of falls in long-term
stroke survivors than in population controls: depressive symptoms predict
falls after stroke. Stroke. 33, 542–547 (2002). doi:10.1161/hs0202.102375
6. V Weerdesteyn, M de Niet, HJ van Duijnhoven, AC Geurts, Falls in
individuals with stroke. J Rehabil Res Dev. 45, 1195–1213 (2008).
doi:10.1682/JRRD.2007.09.0145
7. GM Lyons, T Sinkjaer, JH Burridge, DJ Wilcox, A review of portable FES-
based neural orthoses for the correction of drop foot. IEEE Trans Neural
Syst Rehabil Eng. 10, 260–279 (2002). doi:10.1109/TNSRE.2002.806832
8. JA Blaya, H Herr, Adaptive control of a variable-impedance ankle-foot
orthosis to assist drop-foot gait. IEEE Trans Neural Syst Rehabil Eng. 12,
24–31 (2004). doi:10.1109/TNSRE.2003.823266
9. PC Kao, DP Ferris, Motor adaptation during dorsiflexion-assisted walking
with a powered orthosis. Gait Posture. 29, 230–236 (2009). doi:10.1016/j.
gaitpost.2008.08.014
10. AI Kottink, LJ Oostendorp, JH Buurke, AV Nene, HJ Hermens, IJ MJ, The
orthotic effect of functional electrical stimulation on the improvement of
walking in stroke patients with a dropped foot: a systematic review. Artif
Organs. 28, 577–586 (2004). doi:10.1111/j.1525-1594.2004.07310.x
11. AI Kottink, HJ Hermens, AV Nene, MJ Tenniglo, HE van der Aa, HP
Buschman, MJ Ijzerman, A randomized controlled trial of an implantable 2-
channel peroneal nerve stimulator on walking speed and activity in
poststroke hemiplegia. Arch Phys Med Rehabil. 88, 971–978 (2007).
doi:10.1016/j.apmr.2007.05.002
12. JH Burridge, M Haugland, B Larsen, RM Pickering, N Svaneborg, HK Iversen,
PB Christensen, J Haase, J Brennum, T Sinkjaer, Phase II trial to evaluate the
ActiGait implanted drop-foot stimulator in established hemiplegia. J Rehabil
Med. 39, 212–218 (2007). doi:10.2340/16501977-0039
13. PN Taylor, JH Burridge, AL Dunkerley, A Lamb, DE Wood, JA Norton, ID
Swain, Patients’ perceptions of the Odstock Dropped Foot Stimulator
(ODFS). ClinRehabil. 13, 439–446 (1999)
14. TM Kesar, R Perumal, DS Reisman, A Jancosko, KS Rudolph, JS Higginson, SA
Binder-Macleod, Functional electrical stimulation of ankle plantarflexor and
Preece et al. Journal of NeuroEngineering and Rehabilitation 2011, 8:32
/>Page 9 of 10
dorsiflexor muscles: effects on poststroke gait. Stroke. 40, 3821–3827 (2009).
doi:10.1161/STROKEAHA.109.560375
15. R Dai, RB Stein, BJ Andrews, KB James, M Wieler, Application of tilt sensors
in functional electrical stimulation. IEEE Trans Rehabil Eng. 4,63–72 (1996).
doi:10.1109/86.506403
16. H Lau, K Tong, The reliability of using accelerometer and gyroscope for gait
event identification on persons with dropped foot. Gait Posture. 27,
248–257 (2008). doi:10.1016/j.gaitpost.2007.03.018
17. N Sha, A surface electrode array-based system for functional electrical
stimulation. PhD Thesis. (University of Salford, 2009)
18. M Reeves, BW Heller, T Good, TJ Healey, J van der Meulen, A Clarke, E Pratt,
KPS Nair, AT Barker, SHEFSTIM: A clinical trial of self-tuning array stimulation
for foot-drop. in 1st Annual Conference of the UK and Republic of Ireland
Chapter of the International Functional Electrical Stimulation Society; University
of Salford, UK, ed. by Kenney LPJ, Cooper G (2010)
19. CT Huang, CL Shen, CF Tang, SH Chang, A wearable yarn-based piezo-
resistive sensor. Sensors and Actuators a-Physical. 141, 396–403 (2008).
doi:10.1016/j.sna.2007.10.069
20. A Tognetti, R Bartalesi, F Lorussi, D De Rossi, Body segment position
reconstruction and posture classification by smart textiles. Transactions of
the Institute of Measurement and Control. 29, 215–253 (2007). doi:10.1177/
0142331207069487
21. A Tognetti, F Lorussi, R Bartalesi, S Quaglini, M Tesconi, G Zupone, D De
Rossi, Wearable kinesthetic system for capturing and classifying upper limb
gesture in post-stroke rehabilitation. J Neuroeng Rehabil. 2, 8 (2005).
doi:10.1186/1743-0003-2-8
22. F Lorussi, S Galatolo, DE De Rossi, Textile-Based Electrogoniometers for
Wearable Posture and Gesture Capture Systems. IEEE Sensors Journal. 9,
1014–1024 (2009)
23. T Giorgino, P Tormene, F Lorussi, D De Rossi, S Quaglini, Sensor Evaluation
for Wearable Strain Gauges in Neurological Rehabilitation. IEEE Transactions
on Neural Systems and Rehabilitation Engineering. 17, 409–415 (2009)
24. F Lorussi, W Rocchia, EP Scilingo, A Tognetti, D De Rossi, Wearable,
redundant fabric-based sensor arrays for reconstruction of body segment
posture. IEEE Sensors Journal. 4, 807–818 (2004). doi:10.1109/
JSEN.2004.837498
25. EP Scilingo, A Gemignani, R Paradiso, N Taccini, B Ghelarducci, D De Rossi,
Performance evaluation of sensing fabrics for monitoring physiological and
biomechanical variables. IEEE Transactions on Information Technology in
Biomedicine. 9, 345–352 (2005). doi:10.1109/TITB.2005.854506
26. BJ Munro, TE Campbell, GG Wallace, JR Steele, The intelligent knee sleeve:
A wearable biofeedback device. Sensors and Actuators B-Chemical. 131,
541–547 (2008). doi:10.1016/j.snb.2007.12.041
27. K Manal, I McClay, S Stanhope, J Richardson, B Galinat, Comparison of
surface mounted markers and attachment methods in estimating tibial
rotations during walking: an in vivo study. Gait Posture. 11,38–45 (2000).
doi:10.1016/S0966-6362(99)00042-9
28. A Findlow, JY Goulermas, C Nester, D Howard, LP Kenney, Predicting lower
limb joint kinematics using wearable motion sensors. Gait Posture. 28,
120–126 (2008). doi:10.1016/j.gaitpost.2007.11.001
29. M Hansen, MK Haugland, T Sinkjaer, Evaluating robustness of gait event
detection based on machine learning and natural sensors. IEEE Trans Neural
Syst Rehabil Eng. 12,81–88 (2004). doi:10.1109/TNSRE.2003.819890
30. PM Mills, RS Barrett, S Morrison, Agreement between footswitch and
ground reaction force techniques for identifying gait events: inter-session
repeatability and the effect of walking speed. Gait Posture. 26, 323–326
(2007). doi:10.1016/j.gaitpost.2006.09.077
31. JM Hausdorff, Z Ladin, JY Wei, Footswitch system for measurement of the
temporal parameters of gait. J Biomech. 28, 347–351 (1995). doi:10.1016/
0021-9290(94)00074-E
32. A Mansfield, GM Lyons, The use of accelerometry to detect heel contact
events for use as a sensor in FES assisted walking. Med Eng Phys. 25,
879–885 (2003). doi:10.1016/S1350-4533(03)00116-4
33. T Sinkjaer, M Haugland, A Inmann, M Hansen, KD Nielsen, Biopotentials as
command and feedback signals in functional electrical stimulation systems.
Med Eng Phys. 25,29–40 (2003). doi:10.1016/S1350-4533(02)00178-9
doi:10.1186/1743-0003-8-32
Cite this article as: Preece et al.: Automatic identification of gait events
using an instrumented sock. Journal of NeuroEngineering and
Rehabilitation 2011 8:32.
Submit your next manuscript to BioMed Central
and take full advantage of:
• Convenient online submission
• Thorough peer review
• No space constraints or color figure charges
• Immediate publication on acceptance
• Inclusion in PubMed, CAS, Scopus and Google Scholar
• Research which is freely available for redistribution
Submit your manuscript at
www.biomedcentral.com/submit
Preece et al. Journal of NeuroEngineering and Rehabilitation 2011, 8:32
/>Page 10 of 10