TREATMENT WETLANDS - CHAPTER 9 potx
Bạn đang xem bản rút gọn của tài liệu. Xem và tải ngay bản đầy đủ của tài liệu tại đây (3.22 MB, 82 trang )
267
9
Nitrogen
Nitrogen compounds are among the principal constituents of
concern in wastewater because of their role in eutrophication,
their effect on the oxygen content of receiving waters, and
their toxicity to aquatic invertebrate and vertebrate species.
These compounds also augment plant growth, which in turn
stimulates the biogeochemical cycles of the wetland. The
wetland nitrogen cycle is very complex, and control of even
the most basic chemical transformations of this element is a
challenge in ecological engineering. This chapter describes
the wetland nitrogen cycle, summarizes current knowledge
about environmental factors that control nitrogen transforma-
tions, and provides alternative approaches that can be used to
design wetland treatment systems to treat nitrogen.
9.1 NITROGEN FORMS IN WETLAND WATERS
The most important inorganic forms of nitrogen in wetlands
treating municipal or domestic wastewater are ammonia
(NH
4
), nitrite (NO
2
−
), nitrate (NO
3
−
), nitrous oxide (N
2
O),
and dissolved elemental nitrogen or dinitrogen gas (N
2
).
Nitrogen is also invariably present in FWS wetlands in
organic forms. Both dissolved and particulate forms may be
present, but in most cases there is little particulate nitrogen in
settled wetland surface waters.
Common analytical methods include procedures for
determination of total or dissolved forms (APHA, 2005).
These include
Nitrate
Nitrite
Ammonia
Total Kjeldahl nitrogen (TKN) (organic
ammonia nitrogen)
From these basic measures, several derived concentrations
may be computed:
Oxidized nitrogen nitrate nitrite
Inorganic nitrogen oxidized nitrogen
ammonia
Organic nitrogen TKN − ammonia
Total nitrogen TKN oxidized nitrogen
Each category can be the subject of wetland efuent quality
regulation, and each may represent an important feature of
wetland water quality, depending upon the nature of source
waters.
As treatment wetland technology develops, nondomestic
source waters are of increasing interest, thus bringing atten-
tion to other nitrogen compounds. Examples include
•
•
•
•
•
•
•
•
Polymer industry wastewaters, which contain
amines (RNH
2
, where R is an aliphatic hydrocar-
bon) (Beeman and Reitberger, 2003)
Potato wastewaters, which contain imides (RCO–
NH–OCR`, where R and R` are aliphatic hydrocar-
bons) (Kadlec et al., 1997)
Aluminum and gold processing waste leachates,
which contain cyanide (CN
−
) (Bishay and Kadlec,
2005; Gessner et al., 2005)
Chlorinated efuents, which develop chloramines
in the wetland (NH
x
Cl
y
−
) (Zheng et al., 2004)
Triazine pesticides in agricultural runoff (e.g.,
atrazine, C
8
H
13
N
5
Cl) (Moore et al., 2000b)
These and other specialty applications of interest are dis-
cussed in Chapters 13 and 25.
ORGANIC NITROGEN
Organic nitrogen is made up of a variety of compounds
including amino acids, urea and uric acid, and purines and
pyrimidines. Amino acids are the main components of pro-
teins, which are a group of complex organic compounds
essential to all forms of life. Amino acids consist of an amine
group (–NH
2
) and an acid group (–COOH) attached to the
terminal carbon atom of a variety of straight carbon chain
and aromatic organic compounds. Organic forms of nitrogen,
primarily as amino acids, typically makes up from 1–7% of
the dry weight of plants and animals.
Urea (CNH
4
O) and uric acid (C
4
N
4
H
4
O
3
) are among the
simplest forms of organic nitrogen in aquatic systems. Urea
is formed by mammals as a physiological mechanism to dis-
pose of ammonia that results when amino acids are used for
energy production. Because ammonia is toxic, it must be con-
verted to a less toxic form, urea, by the addition of carbon
dioxide. Uric acid is produced by insects and birds for the
same purpose. These organic forms of nitrogen are impor-
tant in wetland treatment because they are readily hydro-
lyzed, chemically or microbially, resulting in the release of
ammonia.
Pyrimidines and purines are heterocyclic organic com-
pounds in which nitrogen replaces two or more of the carbon
atoms in the aromatic ring. Pyrimidines consist of a single
heterocyclic ring, and purines contain two interconnected
rings. These compounds are synthesized from amino acids
to become the main building blocks of the nucleotides that
make up DNA in living organisms.
Wastewaters contain varying amounts of organic nitro-
gen, depending upon the source. Nitrogen in domestic
sewage comprises about 60% ammonia and 40% organic
•
•
•
•
•
© 2009 by Taylor & Francis Group, LLC
268 Treatment Wetlands
nitrogen (U.S. EPA, 1993b). Activated sludge treatment pro-
cesses typically reduce this fraction considerably, but facul-
tative lagoon efuents may retain the same proportions while
reducing total nitrogen (TN). Food processing efuents may
contain very high amounts of organic nitrogen.
AMMONIA
Ammonia exists in water solution as either as un-ionized
ammonia (NH
3
) or ionized ammonia (NH
4
, ammonium
ion), depending on water temperature and pH:
NH H O NH OH
243
W
(9.1)
Total ammonia is equal to the sum of the un-ionized and the
ionized ammonia, and is designated as ammonia nitrogen in
this book. The fraction of un-ionized ammonia in water may
be estimated from equilibrium conditions, given by
log log .
,
.
10 10
0 09018
272 992
273 16
K
C
CT
d
IA
UA
¤¤
¦
¥
³
µ
´
pH
(9.2)
where
C
C
IA
UA
ionized ammonia concentration, mg/L
uunionized ammonia concentration, mg/L
di
d
K sssociation constant, dimensionless
waterT ttemperature, °C
The ionized form is predominant in most wetland systems
because of moderate pH and temperature, and is designated
as ammonium nitrogen in this book. For a typical “average”
environmental condition of 25nC and a pH of 7, un-ionized
ammonia is only 0.6% of the total ammonia present. At a
pH of 9.5 and a temperature of 30nC, the percentage of total
ammonia present in the un-ionized form increases to 72%. At
lower pH and temperature values, this percentage decreases
signicantly and presumably from wetlands under high pH
and temperature conditions. Un-ionized ammonia is toxic
to sh and other forms of aquatic life at low concentrations
typically at concentrations 0.2 mg/L. U.S. EPA promul-
gates acute and chronic criteria for toxicity, and the reader
is encouraged to consult the latest publication of such limits.
Wetlands are useful for modulation of un-ionized ammonia,
because they create circumneutral pH, and may lower water
temperatures for warm efuents (Kadlec and Pries, 2004).
Ammonia typically comprises more than half of the
TN in a variety of municipal and domestic efuents, where
concentrations often are in the range of 20–60 mg/L. How-
ever, ammonia concentrations in food processing wastewa-
ters treated in wetlands can exceed 100 mg/L (Van Oostrom
and Cooper, 1990; Kadlec et al., 1997). Landll leachates,
particularly from recently closed and capped landlls, can
contain hundreds of mg/L (Bulc et al., 1997; McBean and
Rovers, 1999; Kadlec, 2003c).
Because ammonia is one of the principal forms of nitro-
gen found in many wastewaters and because of its potential
role in degrading the environmental condition of wetlands
and other receiving waters, reducing ammonia concentra-
tion drives the design process for many wetland treatment
systems.
OXIDIZED NITROGEN
Nitrite
(NO
2
)
is an intermediate oxidation state of nitrogen
(oxidation state of 3) between ammonia (−3) and nitrate
(5). Because of this intermediate energetic condition,
nitrite is not chemically stable in most wetlands and is gen-
erally found only at very low concentrations. Nitrate (NO
3
)
is the most highly oxidized form of nitrogen (oxidation state
of 5) found in wetlands. Because of this oxidation state,
nitrate is chemically stable and would persist unchanged
if not for several energy-consuming biological nitrogen
transformation processes that occur. Nitrate can serve as
an essential nutrient for plant growth, but in excess, it leads
to eutrophication of surface water. Nitrate and nitrite are
also important in water quality control because they are
potentially toxic to infants (they result in a potentially fatal
condition known as methylglobanemia) when present in
drinking waters derived from polluted surface or ground-
water supplies. The current regulatory criteria for nitrate
in groundwater and drinking water supplies in the United
States is 10 mg/L.
Oxidized nitrogen is typically near zero in sewage and
in secondarily treated efuents, including secondary acti-
vated sludge and facultative lagoon waters. However, nitrate
may seasonally be the dominant form in nitried secondary
efuents. It is present in agricultural runoff due to the oxida-
tion of ammonia fertilizers in the vadose zone of farm elds,
and may reach 40 mg/L in some cases.
9.2 WETLAND NITROGEN STORAGES
Organic nitrogen compounds are a signicant fraction of the
dry weight of wetland plants, detritus, microbes, wildlife,
and soils. The mass of these nitrogen storages varies in dif-
ferent wetland types. A general idea of the sizes of these dif-
ferent storage compartments is necessary to understand the
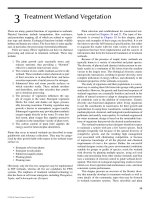
nitrogen uxes discussed in this chapter (Figure 9.1).
SOILS AND SEDIMENTS
The total of newly accreted organic materials at the Sac-
ramento, California, FWS site had about 1.5% nitrogen
(Nolte and Associates, 1998b). At the Houghton Lake,
Michigan, and WCA2A, Florida, FWS sites, the organic
sediments and soils averaged 3.13 o 0.26 and 2.97 o 0.37%
nitrogen by dry weight, respectively. At both these sites,
there was essentially no vertical prole in mass nitrogen
percentage, but there was an increase in soil bulk density
with depth for both. As a result, the volumetric storage of
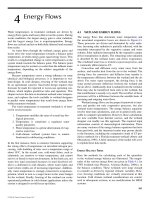
nitrogen increased with depth (Figure 9.2). The resulting
© 2009 by Taylor & Francis Group, LLC
Nitrogen 269
nitrogen storage is about 500–2,000 gN/m
2
in the upper
30 cm of organic wetland sediments. For instance, the data
of Figure 9.2 indicate approximately 700–800 gN/m
2
for
Houghton Lake and WCA2A, respectively.
It is not common for the new sediments and soils in a
treatment wetland to be inorganic in character. However,
systems treating runoff may receive considerable quanti-
ties of inorganic solids from soil erosion in the watershed,
which then combine with organic materials generated within
the wetland. An example is Chiricahueto marsh in Mexico
(Soto-Jiménez et al., 2003). Agricultural runoff brought
water at about 15 mg/L of TN to the marsh for over 50 years.
The soil column is now mostly inorganic, with less than 5%
carbon (Figure 9.3). Mineral matter typically has a low nitro-
gen content, and consequently the nitrogen percentages were
low, less than 0.4% dry weight. Both carbon and nitrogen
decreased together as depth increased, indicating that most
of the soil nitrogen was associated with the organic content.
The nitrogen content of the upper 30 cm at Chiricahueto was
330 gN/m
2
.
0.0
0.5
1.0
1.5
2.0
2.5
3.0
3.5
4.0
0 5 10 15 20 25 30
Depth (cm)
Percent N (dry weight)
0.0
1.0
2.0
3.0
4.0
5.0
6.0
Volumetric TN (mg/cc)
Houghton Lake, MI mg/cc
WCA2A, FL %NHoughton Lake, MI %N
WCA2A, FL mg/cc
FIGURE 9.2 Vertical variation in mass and volume concentrations soil of nitrogen in two FWS treatment wetlands. Houghton Lake, Michi-
gan, data were acquired beneath waters at about 10 mg/L TN after nine years’ exposure, and WCA2A, Florida, data were acquired at a site
with pore water ammonia of 1.5–3.5 mg/L, and surface water of about 2.4 mg/L total nitrogen, after about 20 years’ exposure. (Data for
Houghton Lake: unpublished data; data for WCA2A: unpublished data; and Reddy et al. (1991) Physico-Chemical Properties of Soils in the
Water Conservation Area 2 of the Everglades. Report to the South Florida Water Management District, West Palm Beach, Florida.)
FIGURE 9.1 Nitrogen storages in a densely vegetated hypothetical FWS treatment wetland. Note that most of the stored nitrogen is in soils and
sediments (≈1,000 gN/m
2
), second most is in plant materials (≈100 gN/m
2
), and least is in mobile forms in the water column (≈5 gN/m
2
).
20 cm
25 cm
Deep Soil
Mineral suspended matter
5 g/m
2
at 3.0% N
0.15 g/m
2
Water
250 L/m
2
at 10 mg N/L
2.5 g/m
2
Soil (root zone) 20% solids
40,000 g/m
2
at 2.5% N
1,000 g/m
2
Roots
1,000 g/m
2
at 2.5% N
25 g/m
2
Plankton and organic
suspended matter
5 g/m
2
at 3.0% N
0.15 g/m
2
Periphyton
5 g/m
2
at 3.0% N
0.15 g/m
2
Live plants
2000 g/m
2
at 2.5% N
50 g/m
2
Structural and mineral 750 g/m
2
Decomposable 250 g/m
2
Sorbed and porewater 4 g/m
2
Standing dead
600 g/m
2
at 1.5% N
9 g/m
2
Litter
500 g/m
2
at 1.5% N
7.5 g/m
2
Microdetritus & sediments
50 g/m
2
at 3.0% N
1.5 g/m
2
Note: Dry mass is in italics and standing stock is in bold.
© 2009 by Taylor & Francis Group, LLC
270 Treatment Wetlands
BIOMASS
The TN content of living biomass in marsh wetlands varies
considerably among species, among plant parts, and among
wetland sites. There is little variation from location to location
within a homogeneous stand (Boyd, 1978). Example ranges
of dry weight nitrogen percentages in natural wetlands are:
0.9–2.6% for emergent plants; 1.96–3.8% for oating leaved
plants; and 2.4–2.9% for submersed plants (Boyd, 1978).
TABLE 9.1
Nitrogen Content (gN/m
2
) of Vegetation in Treatment and Natural Areas at the Houghton
Lake, Michigan, Treatment Wetland Site
Control (DIN a 0.1 mg/L)
Discharge (DIN ≈ 15 mg/L)
Biomass
(g/m
2
)
Content
(%)
Crop
(gN/m
2
)
Biomass
(g/m
2
)
Content
(%)
Crop
(gN/m
2
)
Live
1995 368 1.08 4.0 1,086 1.98 18.9
1996 773 1.08 8.2 1,323 2.37 30.3
1997 504 1.00 5.1 1,200 2.11 25.4
1998 311 1.11 3.4 1,333 1.65 22.5
4-year mean 489 1.07 5.2 1,235 2.03 24.3
S
tanding
Dead
1995 642 0.69 4.8 917 1.07 10.1
1996 390 0.58 2.3 392 1.54 5.8
1997 190 0.77 1.4 1,642 2.02 32.6
1998 401 0.61 2.1 1,336 1.59 22.3
4-year mean 406 0.66 2.7 1,072 1.55 17.7
L
itter
1996 84 1.60 1.4 1,769 3.60 62.2
1997 42 1.75 0.8 2,193 3.63 79.3
1998 135 1.75 2.3 3,090 3.55 111.1
3-year mean 87 1.70 1.5 2,351 3.59 84.2
Total Above 982 1.08 9.4 4,658 2.37 126
Note: DIN dissolved inorganic nitrogen oxidized plus ammonia nitrogen.
Source: Unpublished data.
Treatment wetlands are often nutrient-enriched and display
h i g he r v al u es o f t i s s u e n u tr ie n t co n ce n t r a ti o n s t h an n a t u r a l w et -
lands. For instance, live cattail leaves in the discharge area of
the Houghton Lake, Michigan, FWS wetland averaged 2.0% N;
those in nutrient-poor control areas averaged 1.1% N; dead
leaves showed 1.6 versus 0.7% N, and litter leaves showed
3.
6 versus 1.5% N, respectively (Table 9.1). Total biomass is
enhanced by fertilization with efuent, and this compounds
the effect of increased nutrient content, to produce large
0.0
0.5
1.0
1.5
2.0
2.5
3.0
3.5
4.0
4.5
5.0
0 5 10 15 20 25 30
Depth (cm)
Percent Carbon (dry weight)
0.00
0.05
0.10
0.15
0.20
0.25
0.30
0.35
0.40
0.45
Percent Nitrogen (dry weight)
Model Percent Carbon Data Percent Carbon
Model Percent Nitrogen Data Percent Nitrogen
FIGURE 9.3 The decline of carbon and nitrogen with depth in a FWS wetland receiving agricultural runoff, at Chiricahueto, Mexico. (Data
from Soto-Jiménez et al. (2003) Water Research, 37: 719–728.)
© 2009 by Taylor & Francis Group, LLC
Nitrogen 271
storages in treatment areas compared to unfertilized natural
wetlands.
Different plant parts may show large differences in
nitrogen content, and the seasonal variability may be very
large. The extent of this variability is shown in Figure 9.4
for Phragmites australis, for a reed stand in the margin of
Templiner See, a heavily loaded eutrophic shallow lake in
end of the growing season displays much lower nitrogen con-
tent than in spring. Klopatek (1978) has shown trends of the
same magnitude for cattail roots and shoots. It is apparent
that the timing and location of vegetation samples can greatly
affect subsequent calculations of nitrogen storage in biomass.
The decline of aboveground tissue nutrient content is a com-
mon phenomenon in both treatment and natural wetlands
concentration at the end of the growing season. This is partly
due to translocation to belowground rhizomes, which is dis-
cussed in a following section.
These seasonal storages reect the growth cycle of the
plant in question. The processes of growth, death, litterfall,
and decomposition operate year-round, and with different
speed and seasonality depending on climatic conditions and
genotypical habit. Even in cold climates, the total annual
growth is slightly larger than the end-of-season standing crop,
by about 20% (Whigham et al., 1978). In warm climates,
measurements show 3.5–10 turnovers of the live aboveground
standing crop in the course of a year (Davis, 1994). Decay and
translocation processes release most of the nitrogen uptake,
with the residual accreting as new sediments and soils.
0
1
2
3
4
5
6
7
8
9
10
345678910
Month
Percent Nitrogen (dry weight)
Apex
2nd Internode
4th Internode
6th or 8th Internode
Last Internode
FIGURE 9.4 Nitrogen content in Phragmites australis as a function of season and position aboveground. The site was a highly productive
reed stand, which generated 1,500 g/m
2
from Kadlec and Knight (1996) Treatment Wetlands. First Edition, CRC Press, Boca Raton, Florida.)
TABLE 9.2
Whole Plant, Aboveground Foliar Nitrogen Concentration Declines through the Growing Season
Plant Species Location Water
Initial N
(%)
Decline Rate
(%/d) R
2
Reference
Typha latifolia South Carolina N 2.47 0.0133 0.90 Boyd (1971)
Typha latifolia Michigan S 1.00 0.0004 0.75 Houghton Lake, Michigan, unpublished data
Typha angustifolia Michigan S 1.33 0.0027 0.77 Houghton Lake, Michigan, unpublished data
Typha spp. Minnesota N 1.80 0.0063 0.99 Pratt et al. (1980)
Typha spp. Minnesota N 1.70 0.0075 0.86 Pratt et al. (1980)
Scirpus validus
a
New Zealand P 1.46 0.0061 0.80 Tanner (2001a)
Scirpus validus New Zealand P 1.61 0.0059 0.82 Tanner (2001a)
Scirpus validus New Zealand P 1.79 0.0058 0.82 Tanner (2001a)
Scirpus validus New Zealand P 1.93 0.0087 0.88 Tanner (2001a)
Phragmites australis The Netherlands N 2.74 0.0100 0.90 Mueleman et al. (2002)
Phragmites australis Australia AR 4.22 0.0146 0.93 Hocking (1989a, b)
Phragmites australis The Netherlands P 2.54 0.0070 0.96 Mueleman et al. (2002)
Note: Initial %N is at the start of the growing season. Water type is N no wastewater; S nutrients at secondary treatment levels; P nutrients at pri-
mary treatment levels; AR agricultural runoff.
a
Currently known as Schoenoplectus tabernaemontani.
(Table 9.2) and results in a markedly lower tissue nitrogen
of biomass over the June–August period. Redrawn from the data of Kühl and Kohl (1993). (Graph
Germany (Kühl and Kohl, 1993). Biomass collected at the
© 2009 by Taylor & Francis Group, LLC
272 Treatment Wetlands
A common point of reference often used to assay bio-
mass nitrogen is the end of the growing season. The compart-
ments most often analyzed are live aboveground plant tissues,
standing dead and litter, and belowground roots and rhizomes
(Table 9.3). It is seen that a considerable fraction of the bio-
mass is belowground, which is particularly troublesome from
the standpoint of sampling, and hence often omitted. A rough
estimate of nitrogen storages in Table 9.3 may be obtained
by multiplying the dry biomass by 2% nitrogen, resulting in
a range of about 100–300 gN/m
2
. In treatment wetlands that
are lightly loaded, this storage may be an important factor in
the nitrogen budget, on a seasonal basis.
9.3 NITROGEN TRANSFORMATIONS
IN WETLANDS
Figure 9.5 shows the principal components of the nitrogen
cycle in wetlands. The various forms of nitrogen are con-
tinually involved in chemical transformations from inorganic
to organic compounds and back from organic to inorganic.
Some of these processes require energy (typically derived
from an organic carbon source), and others release energy,
which is used by organisms for growth and survival. Most of
the chemical changes are controlled through the production of
enzymes and catalysts by the living organisms they benet.
TABLE 9.3
End of Season Plant Biomass in Wetlands
Species Location Reference Water S/P/E
Live Above
(g/m
2
)
Total Above
(g/m
2
)
Roots and
Rhizomes (g/m
2
)
Cattails
Typha latifolia Wisconsin Smith et al. (1988) N 105/245/290 — 1,400 450
Typha latifolia Texas Hill (1987) N 60/240/345 — 2,500 2,200
Typha glauca Iowa van der Valk and Davis (1978) N 120/265/290 2,000 — 1,340
Typha latifolia Michigan Houghton Lake, Michigan,
unpublished data
N 120/245/275 490 890 6,200
Typha latifolia Michigan Houghton Lake, Michigan,
unpublished data
S 120/245/275 1,240 2,310 2,900
Typha latifolia Kentucky Pullin and Hammer (1989) P — 5,602 — 3,817
Typha angustifolia Kentucky Pullin and Hammer (1989) P — 5,538 — 4,860
B
ulrushes
Scirpus uviatilis Io
wa van der Valk and Davis (1978) N 130/265/285 790 — 1,370
Scirpus validus
a
Iowa van der Valk and Davis (1978) N 120/210/300 2,100 — 1,520
Scirpus validus New Zealand Tanner (2001a) P 30/205/350 2,100 2,650 1,200
Scirpus validus Kentucky Pullin and Hammer (1989) P — — 2,355 7,376
Scirpus cyperinus Kentucky Pullin and Hammer (1989) P — — 3,247 12,495
Phragmites
Phragmites australis United Kingdom Mason and Bryant (1975) N 75/220/305 942 1,275 —
Phragmites australis Iowa van der Valk and Davis (1978) N — — 1,110 1,260
Phragmites australis The Netherlands Mueleman et al. (2002) N 105/255/350 2,900 3,200 7,150
Phragmites australis Brisbane Greenway (2002) S — 1,460 2,520 1,180
Phragmites australis The Netherlands Mueleman et al. (2002) P 105/255/355 5,000 5,500 3,890
Phragmites australis New York Peverly et al. (1993) L 100/270/330 10,800 — 8,700
Note: W
ater type is N
no wastewater; S nutrients at secondary treatment levels; P nutrients at primary treatment levels; L landll leachate with about
300 gN/m
3
. S/P/E refers to the start, peak, and end year-days of the growing season (182 days added for southern hemisphere).
a
Currently known as Schoenoplectus tabernaemontani.
The several nitrogenous chemical species are interrelated
by a reaction sequence. Nitrogen is speciated in several forms
in wetlands, as well as partitioned into water, sediment, and
biomass phases. An FWS wetland is also stratied vertically
into zones which promote different nitrogen reactions. As
a further complicating factor, microenvironments around
individual plant roots may differ from the bulk surroundings
(Reddy and D’Angelo, 1994). Although the detailed processes
are well known, they have not been adequately quantied as
an integrated network for the wetland environment.
A number of processes transfer nitrogen compounds
from one point to another in wetlands without resulting in a
molecular transformation. These physical transfer processes
include, but are not limited to the following: (1) particulate
settling and resuspension, (2) diffusion of dissolved forms,
(3) plant translocation, (4) litterfall, (5) ammonia volatiliza-
tion, and (6) sorption of soluble nitrogen on substrates. In
addition to the physical translocation of nitrogen compounds
in wetlands, ve principal processes transform nitrogen from
one form to another: (1) ammonication (mineralization),
(2) nitrication, (3) denitrication, (4) assimilation, and (5)
decomposition. A detailed understanding of these nitrogen
transfer and transformation processes is important for under-
standing wetland treatment systems. The sections below
describe these processes and the environmental factors that
© 2009 by Taylor & Francis Group, LLC
Nitrogen 273
regulate the transformations. Later in this chapter, empirical
and theoretical design methods are presented for predicting
the treatment wetland area necessary to accomplish the given
nitrogen transformations.
PHYSICAL PROCESSES
The wetland nitrogen cycle includes a number of pathways
that do not result in a molecular transformation of the affected
nitrogen compound. These physical processes include atmo-
spheric nitrogen inputs, ammonia adsorption, and ammonia
volatilization. Sedimentation may also remove particulate
nitrogen from the water, either as a structural component of
the total suspended solids (TSS), or as sorbed ammonia (see
Chapter 7).
Atm
ospheric Deposition
Atmospheric deposition of nitrogen contributes measurable
quantities of nitrogen to receiving land areas. All forms
are involved: particulate and dissolved, and inorganic and
organic. Wetfall contributes more than dryfall, and rain con-
tr
ibutes more than snow (Table 9.4). The nitrogen concentra-
tion of rainfall is highly variable depending on atmospheric
conditions, air pollution, and geographical location. A typical
range of TN concentrations associated with rainfall is 0.5–
3.0 mg/L, with more than half of this present as ammonia
and nitrate nitrogen.
Some dryfall of nitrogen is also from deposition of organic
dust containing organic and ammonia nitrogen. Typical dry-
fall nitrogen inputs are less than wetfall amounts. These
concentrations can be used with local rainfall amounts to
es
timate rainfall inputs in nitrogen mass balances (Table 9.4).
Annual total atmospheric nitrogen loadings are 10–20 kg/
ha·yr. Consequently, atmospheric sources are almost always
a negligible contribution to the wetland nitrogen budget for
all but ombrotrophic, nontreatment wetlands.
Ammonia Sorption
Oxidized nitrogen forms (e.g., nitrite and nitrate) do not
bind to solid substrates, but ammonia is capable of sorp-
tion to both organic and inorganic substrates. Because of the
positive charge on the ammonium ion, it is subject to cation
exchange. Ionized ammonia may therefore be removed from
water through exchange with detritus and inorganic sedi-
ments in FWS wetlands, or the media in SSF wetlands. The
adsorbed ammonia is bound loosely to the substrate and can
be released easily when water chemistry conditions change.
Water
Sediments
Air
"
$
"$
!#
FIGURE 9.5 Simplied nitrogen cycle for a FWS treatment wetland. (Modied from Kadlec and Knight (1996) Treatment Wetlands. First
Edition, CRC Press, Boca Raton, Florida.)
© 2009 by Taylor & Francis Group, LLC
274 Treatment Wetlands
At a given ammonia concentration in the water column, a
xed amount of ammonia is adsorbed to and saturates the
available attachment sites.
The character of the substrate is an important determi-
nant of the amount of sorption or exchange (Figure 9.6). Nat-
ural zeolites have more exchange capacity than do the gravels
usually employed in SSF wetlands, by more than a factor of
100. Organic sediments and peats in FWS wetlands have
capacities intermediate to zeolites and gravels. The exchange
reaction involves protons on the substrate and ammonia:
RRHNHOH NHHO
2
44
W (9.3)
where R represents a ligand, such as the humic substances
found in peat. Other cations, including sodium (Na
), calcium
(Ca
2
) and magnesium (Mg
2
), compete for exchange sites,
TABLE 9.4
Atmospheric Deposition of Nitrogen
Location and Nitrogen Form
Type of
Deposition
Estimated
Precipitation (mm)
Concentration
(mg/L)
Load
(kg/ha·yr) Reference
Geneva, New York Inorganic
Wet dry
993 1.1 10.9 U.S. EPA (1993b)
Coshocton, Ohio Inorganic
Wet dry
939 0.8 7.5 U.S. EPA (1993b)
Organic
Wet dry
— 0.37 3.5
Cincinnati, Ohio Inor
ganic
Wet dry
1,020 0.69 7.0 U.S. EPA (1993b)
Organic
Wet dry
— 0.58 5.9
Seattle, W
ashington Nitrate Dry — — 0.7 U.S. EPA (1993b)
Ottawa, Ontario Inor
ganic Snow 147 0.85 1.3 U.S. EPA (1993b)
Nitrate Rain 724 0.35 15.6
Ammonia Rain — 1.8 13.0
Hamilton, Ontario
Total nitrogen Wet 818 0.49 4 U.S. EPA (1993b)
Total nitrogen Dry — — 2.5
Souther
n Florida
Inorganic
Wet dry
1,500 0.75 6.1 South Florida Water Management
District, unpublished data
Organic
Wet dry
— 1.13 9.3
Particulate
Wet dry
— 0.94 7.7
Mid
wester
n United
Ammonia
Wet dry
889 0.34–0.45 3–4 U.S. EPA (2001b)
States
North Car
olina
Nitrate Wet 1,355 0.25 3.4 Whitall and Paerl (2001)
Ammonia Wet — 0.23 3.1
Organic Wet — 0.23 3.2
Chesapeake Bay Wet (2/3) Sheeder et al. (2002)
Inorganic Dry (1/3) 1,143 0.34–1.62 4–19
Souther
n Sweden
Total nitrogen
Wet dry
569 2.6–4.4 15–25 U.S. EPA (1993b)
Central Europe Total nitrogen
Wet dry
866 2.3–3.5 20–30 U.S. EPA (1993b)
and reduce the potential for ammonia exchange (Weatherly
and Miladinovic, 2004). Hydrogen ions are also important,
because these too reduce the exchange capacity. For example,
McNevin and Barford (2001) found the direct dependence for
Killarney peat, over the range 3.9 pH 7.5 to follow:
K
C
C
exch
S
L
pH0 0018
5 438
.()
.
(9.4)
where
C
C
L
S
ammonia concentration in water, mg/L
a
mmmonia concentration on solid, mg/kg
exch
K ppartition coefficient, L/kg
When the ammonia concentration in the water column is
r e d u c e d , so m e a m m o n i a w i l l b e d e so r b e d t o r eg a i n e q u i l ib r i u m
© 2009 by Taylor & Francis Group, LLC
Nitrogen 275
with the new concentration. If the ammonia concentration in
the water column is increased, the adsorbed ammonia will
also increase.
The mass of sorbed ammonia nitrogen on detritus and
sediment in an FWS wetland is not large, and is very labile.
The top 20 cm of the wetland substrate may contain up to
20 gN/m
2
in exchangeable form for a peat exposed to 10 mg/L
ammonium nitrogen. This pool of nitrogen is quickly estab-
lished at moderate nitrogen loadings (see Chapter 10 for an
analogous discussion of sorption saturation times for phos-
phorus). At light nitrogen loadings, a short start-up period
may be inuenced by this storage.
Wittgren and Maehlum (1997) suggest that seasonal
sorption could store ammonia for later use and release. Riley
et al. (2005) found rapid uptake to sorption, with little or no
subsequent ammonia loss. Their linear sorption K
D
0.083
L/kg. (Sorption relationships are discussed in more detail in
Chapter 10—the following discussion focuses in ammonia
sorption only.)
Gravel: 0.3 1.3 cm
SL
CC0 083
100
.
.
(9.5)
Sikora et al. (1995b) provided data from which Freundlich
constants could be t:
Fine gravel: 0.5 1.0 cm
SL
CC077
064
.
.
(9.6)
Coarse gravel: 0.5 2.0 cm
SL
CC163
055
.
.
(9.7)
Weatherly and Miladinovic (2004) provided Langmuir con-
stants for the zeolites clinoptilolite and mordenite:
Clinoptilolite:
1
2.5 mg/L = 6.9 g/kg
max
K
S
(9.8)
Mordenite:
1
19.6 mg/L = 13.1 g/kg
max
K
S
(9.9)
Lahav and Green (2000) provided Langmuir constants for
the zeolite chabazite:
Chabazite:
1
10.0 mg/L = 50.5 g/kg
max
K
S
(9.10)
The median ammonia loading for HSSF systems is about
1.0 g/m
2
·d, and the median concentration is 20 mg/L. For
the parameters above, the equilibrium ammonia sorbed at
20 mg/L is 2–25 g/m
2
for a 60-cm deep bed. Therefore,
the bed solids can hold approximately 2–25 days’ supply of
ammonia via sorption phenomena.
However, if the wetland substrate is exposed to oxygen,
perhaps by periodic draining, sorbed ammonium may be oxi-
dized to nitrate. Nitrate is not bound to the substrate, and is
washed out by subsequent rewetting. This concept forms the
basis for intermittently fed and drained, vertical ow treat-
ment wetlands, and for other wetland systems that are alter-
nately ooded and drained.
FIGURE 9.6 Ammonium adsorption on FWS and SSF wetland substrates. (The gravel data are from Sikora et al. (1994) Ammonium and
phosphorus removal in constructed wetlands with recirculating subsurface ow: Removal rates and mechanisms. Jiang (Ed.), Proceedings
of the 4th International Conference on Wetland Systems for Water Pollution Control, 6–10 November 1994; IWA: Guangzhou, P.R. China,
pp. 147–161. Everglades peat data from Reddy et al. (1991) Physico-Chemical Properties of Soils in the Water Conservation Area 2 of the
Everglades. Report to the South Florida Water Management District, West Palm Beach, Florida. Michigan peat data from unpublished
results at Houghton Lake. Sepiolite data from Balci (2004) Water Research 38(5): 1129–1138. Clinoptilolite data from Weatherly and
Miladinovic (2004) Water Research 38(20): 4305–4312.)
1
10
100
1,000
10,000
100,000
1 10 100 1,000 10,000
Ammonia in Water (mg/L)
Ammonia on Solid (mg/kg)
Sepiolite Clinoptilolite
Everglades Peat
Michigan Peat
Gravel
© 2009 by Taylor & Francis Group, LLC
276 Treatment Wetlands
Ammonia Volatilization
Un-ionized ammonia is relatively volatile and can be removed
from solution to the atmosphere through diffusion through
water upward to the surface, and mass transfer from the
water surface to the atmosphere.
THEORETICAL CONSIDERATIONS
Total dissolved ammonia exists in the two forms, free or un-
ionized (NH
3
), and ionized (NH
4
). These interconvert readily
in water, according to Equation 9.2, which allows the compu-
tation of the concentration of free ammonia in terms of total
ammonia:
C
C
K
AL
ATL
d
1
(9.11)
where
C
AL
concentration of free ammonia in the bu llk
water, g/m
concentration of total
3
ATL
C aammonia in the bulk
water, g/m
3
Free ammonia may also exist as a gas, whereas ionized
ammonia is nonvolatile. The process of volatilization carries
free ammonia from the water into the air above. That over-
all process comprises four major components in series (see
Chapter 5): (1) partial conversion of ionized ammonia to free
ammonia (dissociation), (2) diffusion of free ammonia to the
air–water interface (water-side mass transfer), (3) release of
free ammonia to the air at the interface (volatilization), and
(4) diffusion of free ammonia from the air–water interface
into the air above (air-side mass transfer). These component
processes are conceptually well understood because of stud-
ies associated with ammonia stripping as an engineering
technology.
The loss of free ammonia may be described by a two-
lm mass transfer equation (Welty et al., 1983; Liang et al.,
2002):
JkC C(
*
)
AL AL
(9.12)
11 1
KkHk
LL G
(9.13)
where
C
AL
= water concentration of free ammonia th
*
aat would be
in equilibrium with the free ammmonia in the bulk
air, g/m
= Henry’s Law c
3
H ooefficient, dimensionless
= overall mass t
L
K rransfer coefficient, m/d
= air-side mass t
G
k rransfer coefficient, m/d
= water-side mass
L
k transfer coefficient, m/d
Water–air equilibrium, or solubility, is governed by
Henry’s law:
C
C
H
AL
AG
*
(9.14)
where
C
AG
= concentration of free ammonia in the bullk air, g/m
3
The value of H is temperature-dependent (Liang et al.,
2002):
H
TT
r
¤
¦
¥
³
µ
´
¤
¦
2 395 10
273 16
4151
273 16
5
.
.
exp
.
¥¥
³
µ
´
(9.15)
Under almost all circumstances, the ammonia concentra-
tion in the air above the wetland will be negligibly small,
and hence may be presumed to be zero. Additionally, total
ammonia rather than free ammonia is used in the overall
vapor loss equation:
JKC
LAL
(9.16)
JK
C
K
kC
¤
¦
¥
³
µ
´
L
ATL
d
ATL
1
(9.17)
where
first-order volatilization rate consk ttant based on total
ammonia, m/d
There are two choices for a rst-order removal rate: one
based on the free ammonia concentration in the water (Equa-
tion 9.16), and one based on the total ammonia concentration
in the water (Equation 9.17); the latter is used here.
Practical Application
Many factors inuence component processes, most of which
will not be known or measured for eld situations involving
treatment wetlands. Solubility depends on temperature, and
degree of ionization depends on temperature and pH. How-
ever, the process of ammonia volatilization involves proton
transfer, and a theoretical decrease in pH. Such a decrease
has been observed in laboratory volatilization tests (Shilton,
1996). Additionally, both temperature and pH undergo large
diurnal swings in some treatment wetlands up to 8nC and 2
pH units. In some few situations, there may be vertical strati-
cation of the water column, leading to interfacial tempera-
ture and pH conditions that deviate from those in the bulk
water (Jenter et al., 2003).
The water-side mass transfer coefcient (k
L
) depends
upon the degree of turbulence (mixing) in the water, which
in turn depends on depth, velocity, and the amount of sub-
mersed plant and litter material (Serra et al., 2004), together
with the wind speed (Liang et al., 2002). The air-side mass
© 2009 by Taylor & Francis Group, LLC
Nitrogen 277
transfer coefcient (k
G
) depends upon the degree of turbu-
lence (mixing) in the air, which in turn depends on wind
speed and amount of emergent plant biomass. The studies of
Liang et al. (2002) suggest that both air-side and water-side
mass transfer resistance are important for ammonia losses
from ponds. That is in contrast to the work of Freney et al.
(1985), which suggested that for a rice crop, the mass transfer
resistance was entirely in the air. Therefore, ammonia loss
rates should depend not only upon temperature and pH, but
al
so on site-specic conditions (see Figure 9.7).
Several studies of ammonia volatilization from ponds and
wetlands provide data from which rst-order rate constants
may be calculated (Table 9.5). Values of k range from 0.11
to 28 m/yr, which is an unacceptably large range. A modi-
ed Arrhenius temperature factor developed from the data
of Stratton (1969) is Q 1.094. This was used to adjust rate
constants to 20nC in Table 9.5. The k
20
values so computed
for wetland systems span a much narrower range 0.28–0.68
m/yr, with mean o SD 0.47 o 0.14. For pond systems, the
values are much higher, mean o SD 4.2 o 4.6. There is
also a clear trend of increasing k with pH for ponds, which
has been reported in several studies (Stratton, 1968; Shilton,
1996; Liang et al., 2002). The reduced rates for wetlands
may be attributed to the vegetation, which breaks the wind
and thus lowers both the water-side and air-side mass trans-
fer coefcients. Presumably, there would be a pH effect for
wetlands, but FWS wetland pH values are most often tightly
clustered in the range 7.0–7.5, thus preventing the manifesta-
tion of a pH effect.
These considerations indicate that emergent FWS wetlands
will lose much less ammonia to volatilization than will ponds.
Therefore, inclusion of open water sections in FWS treatment
wetlands encourages ammonia loss (Poach et al., 2004; see
Fi
gure 9.8). Volatilization rate constants for vegetated wetlands
are quite small compared with rate constants for other mecha-
nisms, as will be discussed in the following text. However, the
same is not necessarily true for open water components.
MICROBIAL PROCESSES
Wetlands are a rich environment for a large suite of microbes
that mediate or conduct numerous chemical reactions involv-
ing nitrogen. Heterotrophic bacteria derive carbon from
preformed organic compounds, whereas autotrophs acquire
energy and carbon from inorganic sources. Denitrication
is often, but not always, accomplished by heterotrophs in
wetlands, while nitrication is carried out autotrophically.
Microbes also produce enzymes that can break down com-
plex molecules, both inside and outside the cell. Microbes
are preferentially associated with solid surfaces, rather than
as free-oating organisms. The principal nitrogen micro-
bial wetland processes are therefore carried out in biolms
located on soils, sediments, and submerged plant parts.
In the following sections, the principal nitrogen conver-
si
ons are discussed in more detail (see Figure 9.5).
Ammonification of Organic Nitrogen
Ammonication is the biological transformation of organic
nitrogen to ammonia and is the rst step in mineralization
of organic nitrogen (Reddy and Patrick, 1984). This pro-
cess occurs both aerobically and anaerobically, and releases
ammonia from dead and decaying cells and tissues. Het-
erotrophic microorganisms are considered to be the group
involved (U.S. EPA, 1993b). The reactions can take place
intracellularly or extracellularly, via the action of enzymes
acting upon proteins, nucleic acids, and urea (Maier et al.,
2000). The sources of nitrogenous organics are plant and
animal tissues, and direct excretion of urea.
Typical ammonication reactions are:
Urea breakdown
NH CONH H O NH CO
222 32
l 2
(9.18)
Amino acid breakdown
RCH(NH )COOH H O NH CO
2232
l
(9.19)
FIGURE 9.7 Ammonia losses were measured directly at ponds at Greensboro, North Carolina. (Photo courtesy M. Poach.)
© 2009 by Taylor & Francis Group, LLC
278 Treatment Wetlands
It is curious that the wastewater treatment literature does
not directly address ammonication, despite the consider-
able proportion of organic nitrogen in raw wastewaters.
The ammonication step is identied on diagrams, but no
mention of chemistry or rates is found in manuals (Brown
and Caldwell, 1975; U.S. EPA, 1993b) or texts (Metcalf and
Eddy Inc., 1991). In some instances, it is recommended to
lump organic and ammonium (as TKN) in calculations of
TABLE 9.5
Rate Constants for Ammonia Volatilization for Ponds and Wetlands
Site T (nC) pH
Total
NH
3
–N
(g/m
3
)
Un-ionized
NH
3
–N
(g/m
3
)
Loss
rate
(g/m
2
·yr)
Total
NH
3
–N k
(m/yr)
Total
NH
3
–N k
20
(m/yr) Reference
Duplin County, North
Carolina
Poach et al. (2002, 2003)
Field: large-scale chambers
Grass 23 7.2 55 0.51 30 0.46 0.35
Bulrush 24 7.2 46 0.42 19 0.40 0.28
Cattail 22 7.2 46 0.36 20 0.57 0.48
Greensboro, North
Carolina
Poach et al. (2004)
Field: large-scale chambers
Bulrush and Cattail 23 7.0 60 0.54 46 0.70 0.53
Pond 25 7.4 40 1.08 237 10.4 6.6
Ujjain, India Billore et al. (1994)
Field: small-scale chambers
Water 35 — 4 — 15 4.2 1.09
Duckweed 35 — 7 — 46 6.5 1.69
Cattail 35 — 14 — 37 2.6 0.68
New Zealand Shilton (1996)
Lab: small-scale chambers
Pond 20 8.6 549 86 389 0.69 0.69
Al-Bireh, Palestine Zimmo et al. (2003)
Field: small-scale chambers
Duckweed 17 7.8 50 1.12 5.4 0.11 0.14
Pond 17 8.1 38 1.38 6.7 0.19 0.25
Grifth, Australia Freney et al. (1985)
Field: air-side measurements
Rice 20 8.0 73 2.78 34.9 0.48 0.48
San Diego, California Stratton (1969)
Lab: ow chambers
Pond 29 9.8 0.47 0.39 0.89 28 12.5
Pond 32 9.1 1.75 0.92 37 20 6.8
Note: V
alues based on total ammonia are shown.
y = 0.705x
R
2
= 0.257
y = 10.4x
R
2
= 0.687
0
100
200
300
400
500
600
700
800
900
1,000
0 20 40 60 80 100 120 140 160 180
Total Ammonia (mg/L)
Loss Rate (g/m
2
yr)
Marshes
Ponds
FIGURE 9.8 Ammonia volatilization losses from 12 marshes and 6 ponds at Greensboro, North Carolina. Conditions in the marshes were
T 23nC, pH 7.0; in the ponds T 25nC, pH 7.4; wind was 0.2–1.5 m/s. (Replotted from Poach et al. (2003) Ecological Engineering,
20(2): 183–197, with zero intercept.)
© 2009 by Taylor & Francis Group, LLC
Nitrogen 279
ammonia processing, on the presumption that organic nitro-
gen will add to the potential ammonia concentrations (U.S.
EPA, 2000a). That procedure can be misleading for two rea-
sons. First, ammonication is not instantaneous, and con-
version proceeds at rates that inuence the removal of TKN
in many instances. Kinetically, ammonication proceeds
more rapidly than nitrication, thus creating the potential
for increasing ammonia concentrations along the ow-path
of a wetland and requiring design for nitrogen removal to
include both ammonication and the slower nitrication pro-
cess. Second, the ammonication process does not proceed
to completion in wetlands, although the removal of ammo-
nia can go to completion for long enough detention. There
is an organic nitrogen background concentration which may
consist of irreducible residuals, or be due to return uxes of
organic nitrogen from decomposing solids.
NITRIFICATION OF AMMONIA
Nitrication is the principal transformation mechanism that
reduces the concentration of ammonia nitrogen in many wet-
land treatment systems, by converting ammonia nitrogen to
oxidized nitrogen, van de Graaf et al. (1996) dened nitri-
cation as the biological formation of nitrate or nitrite from
compounds containing reduced nitrogen with oxygen as the
terminal electron acceptor. Nitrication has been typically
associated with the chemoautotrophic bacteria, although it
is now recognized that heterotrophic nitrication occurs and
can be of signicance (Keeney, 1973; Paul and Clark, 1996).
Results from Conventional Wastewater
Treatment Processes
Biological nutrient removal systems may be broadly catego-
rized as suspended growth (e.g., activated sludge) or attached
growth (e.g., trickling lters). In such devices, nitrication is
considered to be a two-step, microbially mediated process in
U.S. EPA (1993b):
Nitritation
23 224
42 2
NH O NO H O H
2
| l||||
Nitrosomonas
(9.20)
Nitrication
22
22 3
NO O NO
| l|||
Nitrobacter
(9.21)
The rst step, nitritation, is mediated primarily by autotro-
phic bacteria in the genus Nitrosomonas and the second step,
nitrication, by bacteria in the genus Nitrobacter. Both steps
can proceed only if oxygen is present, and thus the actual
nitrication rate may be controlled by the ux of dissolved
oxygen into the system.
Based on this stoichiometric relationship, the theoreti-
cal oxygen consumption by the rst nitritation reaction is
about 3.43 g O
2
per gram of NH
3
–N oxidized, and 1.14 by
the second nitrication reaction, for a total of 4.57. Actual
consumption is reportedly somewhat less, 4.3 g O
2
per
gram of NH
3
–N oxidized (Metcalf and Eddy Inc., 1991).
The oxidation reactions release energy used by both Nitro-
somonas and Nitrobacter for cell synthesis. The combined
processes of cell synthesis create 0.17 g of dry weight
biomass per gram of ammonia nitrogen consumed (U.S.
EPA, 1993b). Nitrication of ammonia to nitrate consumes
approximately 7.1 g of alkalinity (as CaCO
3
) for each nitri-
ed gram of ammonia nitrogen, as two moles of H
are
released for each mole of ammonia nitrogen consumed in
Equation 9.20 (U.S. EPA, 1993b). Thus nitrication lowers
the alkalinity and pH of the water.
The optimal pH range observed for nitrication in
suspended growth treatment systems is between about 7.2
and 9.0 (Metcalf and Eddy, Inc., 1991). Treatment wetlands
almost always operate at circumneutral pH (see Chapter 5);
consequently, this factor should be a minor inuence on nitri-
cation in those systems.
Wetland Environments
Natural environments are considerably more complex than
the situations in biological nutrient removal systems in con-
ventional wastewater treatment plants (WWTPs). There are
now enough wetland data to begin to understand some dif-
ferences, and to appreciate that WWTP results may not apply
to wetlands.
There are more genera potentially involved in natural
systems than those identied above. Ammonia oxidizing
bacteria (AOB) include Nitrosospira and Nitrosococcus in
addition to Nitrosomonas (Bothe et al., 2000). Austin et al.
(2003) found Nitrosospira just as abundant as Nitrosomo-
nas in a treatment wetland, with lesser numbers of Nitroso-
coccus. Likewise, nitrite is oxidized by Nitrospira as well
as Nitrobacter, and the former was found to be much more
prevalent in a treatment wetland (Austin et al., 2003). Fur-
thermore, heterotrophic bacteria are capable of nitrication,
such as Paracoccus denitricans and Pseudomonas putida
(Bothe et al., 2000). Nevertheless, Nitrosomonas is found
in treatment wetlands (Silyn-Roberts and Lewis, 2001). The
oxidation of ammonia to nitrite in natural systems is sug-
gested to comprise two steps, not one (Bothe et al., 2000),
catalyzed by enzymes:
NH O H NH
Ammonia
monooxygenase
232
22 | l||||
e OOH H O
2
(9.22)
NH OH H O N
22
Hydroxylamine
oxidoreductase
| l|||| OOH
2
54
e
(9.23)
This scheme suggests that hydroxylamine is an intermedi-
ate in the process, which presents alternate nitrogen process-
ing possibilities. Further, one of the oxygen atoms in nitrite
derives from O
2
, the other from water.
Nitrite oxidizing bacteria (NOB) were found not to
include Nitrobacter in two FWS treatment wetlands (Flood
et al., 1999). Similarly, Austin et al. (2003) found Nitrospira
(4% of total) to be much more abundant than Nitrobacter
© 2009 by Taylor & Francis Group, LLC
280 Treatment Wetlands
(0.1% of total) in a treatment wetland. Importantly, nitrite
may be also be destroyed by processes other than conversion
to nitrate, as shall be discussed in a later section.
On a practical level, these considerations cast doubt about
the applicability to wetlands of the stoichiometry advocated
for WWTP environments (Equations 9.20 and 9.21). For
instance, the dissolved oxygen requirement for Equations
9.22 and 9.23 is 1.14 g O
2
per gram of ammonia nitrogen,
rather than the 3.43 suggested by Equation 9.20. Alkalinity
requirements are also greatly reduced. The stoichiometric
factor of 4.3 g O
2
per gram of NH
4
–N oxidized has been
used in many treatment wetland publications as a means of
inferring the maximum amount of oxygen transferred into
the water (e.g., Platzer, 1999; Cooper, 2001, 2005). But, in
many wetland situations, the 4.3 factor does not seem to
be applicable (Tanner and Kadlec, 2002). These alterna-
tive pathways with the potential to substantially reduce the
oxygen uxes required to drive NH
4
–N removal need to be
investigated further in both natural and constructed wet-
lands to develop an understanding of their role in wetland
nitrogen removal.
The necessity of a low carbon-to-nitrogen ratio, another
concept from activated sludge and attached growth technolo-
gies, appears dubious for wetlands. It has been suggested
that the biochemical oxygen demand (BOD) level “must be
below (BOD/TKN 1.0)” for “successful nitrication” in
treatment wetlands (Reed et al., 1995; Crites et al., 2006).
In conventional devices, the carbon consumption activity of
heterotrophs may cause them to dominate the overall bacte-
rial population, but with a smooth transition from 3% to 35%
nitriers as the BOD
5
:TKN ratio decreases from 9 to 0.5 in
activated sludge plants (Metcalf and Eddy Inc., 1991). Simi-
larly, the result is a smooth decrease in nitrication rates in
attached growth systems, from a relative level of 100% in
the absence of BOD to 40% at BOD
5
:TKN 5.0 (Brown and
Caldwell, 1975).
Free water surface treatment wetlands operate with a
variety of inlet carbon-to-nitrogen ratios, ranging from 0.28
to 4.41 (5th to 95th percentiles, N 126 wetlands). The mean
inlet ratio is 2.0, and the mean outlet ratio is 1.6. Only one
third of the 126 FWS wetlands met the criterion BOD:TKN
1.0. This distribution is rather narrow, and would not lead
to marked differences in potential nitrication rates. Con-
sidering direct evidence, there is essentially no correlation
between the BOD:TKN ratio and measures of nitrication
performance. For example, the TKN load removed versus
BOD:TKN ratio has an R
2
0.037. Transect data sets display
no nitrogen removal lag as carbon is removed (Tanner et al.,
2002a). Therefore, it is not reasonable to accept this ratio as a
controlling factor in FWS wetlands.
DENITRIFICATION
Denitrication is most commonly dened as the process in
which nitrate is converted into dinitrogen via intermediates
nitrite, nitric oxide, and nitrous oxide (Hauck, 1984; Paul and
Clark, 1996; Jetten et al., 1997).
Denitrication (nitrate dissimilation) is carried out by
facultative heterotrophs, organisms that can use either oxy-
gen or nitrate as terminal electron acceptors. Starting from
nitrate via nitrite, there is sequential production of nitric
oxide (NO), nitrous oxide (N
2
O), and nitrogen gas (N
2
) (e.g.,
Cox and Payne, 1973; Koike and Hattori, 1978):
222
32 2
NO NO NO N O N
2
llll
(9.24)
Diverse organisms are capable of denitrication. In an
array are organotrophs (e.g., Pseudomonas, Alcaligenes,
Bacillus, Agrobacterium, Flavobacterium, Propioni-
bacterium, Vibrio), chemolithotrophs (e.g., Thiobacillus,
Thiomicrospira, Nitrosomonas), photolithotrophs (e.g.,
Rhodopseudomonas), diazotrophs (e.g., Rhizobium, Azo-
spirillum), archaea (e.g., Halobacterium), and others such
as Paracoccus or Neisseria (Focht and Verstraete, 1977;
Knowles, 1982; Killham, 1994; Paul and Clark, 1996).
Results from Conventional Wastewater
Treatment Processes
The overall stoichiometric nitrate dissimilation reaction
based on methanol (CH
3
OH) as a carbon source is summa-
rized by the following (U.S. EPA, 1993b):
NO CH OH N CO
HO OH
3
2
322
0 833 0 5 0 833
1 167
l
.
(9.25)
Other carbon sources also may drive denitrication, such
as glucose (Reddy and Patrick, 1984):
NO C H O N CO
HO OH
6126 2
2
32
0208 05 125
075
l
.
(9.26)
The carbon (energy) requirements are 1.90 g methanol and
2.67 g glucose per gram of nitrate nitrogen, respectively.
Some nitrate and carbon are also used by denitrifying bacte-
ria for cell synthesis. For instance, another 0.57 g methanol
is required for bacterial growth, bringing the total to 2.47 g
of methanol to support the denitrication of 1 g of nitrate
nitrogen. This translates to an optimum carbon level of 2.3 g
BOD per g NO
3
–N (Gersberg et al., 1984). In the absence
of this or another equivalent carbon source, denitrication
is inhibited.
As indicated by Equations 9.25 and 9.26, denitrication
produces alkalinity. The observed yield of this process is
about 3.0 g alkalinity as CaCO
3
per gram of NO
3
-N reduced.
This increase in alkalinity is accompanied by an increase in
the pH of the wetland surface water.
Theoretically, denitrication does not occur in the pres-
ence of dissolved oxygen. However, denitrication has been
observed in suspended and attached growth treatment sys-
tems that have relatively low measured dissolved oxygen con-
centrations, but not above 0.3–1.5 mg/L (U.S. EPA, 1993b).
© 2009 by Taylor & Francis Group, LLC
Nitrogen 281
This is presumably due in part to the activity of aerobic deni-
triers, such as Paracoccus denitricans.
Wetland Environments—Carbon Sources
The carbon source in wetlands is neither methanol nor glu-
cose, but rather organic matter that is sometimes character-
ized by the Redeld ratio C:N:P 106:16:1 (Davidsson and
Stahl, 2000). The denitrication reaction is then written:
84 8
42 4 106
3 2 106 3 16 4
2
.()()()
.
NO NH H PO
N
3
l
CH O
CCO NH H O H PO
2323 4
16 148 8 .
(9.27)
This reaction is irreversible in nature, and occurs in the pres-
ence of available organic substrate only under anaerobic or
anoxic conditions (E
h
350 to 100 mV), where nitrogen
is used as an electron acceptor in place of oxygen. More and
more evidence is being provided from pure culture studies
that nitrate reduction can occur in the presence of oxygen.
Hence, in waterlogged soils, nitrate reduction may also start
before the oxygen is depleted (Kuenen and Robertson, 1987;
Laanbroek, 1990).
The carbon (energy) requirement is 3.02 g organic mat-
ter per gram of nitrate nitrogen. Further, some ammonia is
theoretically liberated, which can support growth or add to
the overall wetland ammonia pool.
As most denitrication is accomplished by heterotrophic
bacteria, the process is strongly dependent on carbon avail-
ability. There is a general correlation between total soluble
organic matter content and denitrication potential, but much
better correlation occurs with the supply of easily decom-
posable organic matter or water-extractable organic carbon
(Bremner and Shaw, 1958; Broadbent and Clark, 1965; Paul
and Clark, 1996). Organic substances able to act as sources of
energy and as hydrogen donors may be present in sediments
and soils through the decomposition of tissues or be provided
by living roots exudates (Stefanson, 1973; Bailey, 1976).
A number of treatment wetland studies have investi-
gated the use of carbon supplements in the form of added
plant biomass (Gersberg et al., 1983, 1984; Burchell et al.,
2002; Hume et al., 2002a). Another study added methanol
(Gersberg et al., 1983), with good effect. Burgoon (2001)
provided carbon by feed-forward of un-nitried inuent to
wetlands receiving nitried potato processing waters. All
such studies have shown that carbon can be limiting in wet-
lands at high nitrate loadings. The amount of total carbon
in dead and decomposing biomass is on the order of 40%
of the dry biomass (Ingersoll and Baker, 1998; Baker, 1998;
Hume et al., 2002b). Not all of the total carbon produced is
available for denitriers. Baker (1998) has suggested that
the C:N loading ratio be at least 5:1 so that carbon does
not become limiting, which in his work translated to 20%
availability. Hume et al. (2002b) suggest 8% availability.
Presuming a carbon content of 40%, the required productiv-
ities are at the lower end of the range for emergent marshes
(Kadlec and Knight, 1996). However, realization of higher
nitrate removal rates, corresponding to higher inlet concen-
trations, may stress the ability of the wetland to generate
the required carbon energy source. If carbon is limiting,
the rate of denitrication will depend strongly on the rate of
carbon supply (Hume et al., 2002a).
It should be noted that the most labile form of organic
carbon in wetland environments is the inuent BOD, which
is likely used preferentially (when available) to reduce oxi-
dized forms of nitrogen.
W
e
tland Environments—Oxygen Inhibition
Denitrication has been observed in numerous wetland treat-
ment systems which have considerable dissolved oxygen in
their surface waters (Van Oostrom and Russell, 1994; Phipps
and Crumpton, 1994). This apparent anomaly is due to the
complicated spatial zonation in a wetland. Oxygen gradi-
ents occur between surface waters and bottom sediments
in wetlands, allowing both aerobic and anoxic reactions to
proceed in close vertical proximity (millimeters) near the
se
diment–water interface (Figure 9.9). Thus, nitrate formed
by nitrication in surface waters may diffuse into top anoxic
soil layers where it is effectively denitried (Reddy and
Patrick, 1984).
Signicant quantities of oxygen pass down through the
airways to the roots (Brix and Schierup, 1990; Brix, 1993);
and signicant quantities of other gases, such as carbon diox-
ide and methane, pass upward from the root zone. Some—
perhaps most—of the oxygen passing down the plant into the
root zone is used in plant respiration (Brix, 1990). However,
there is a great deal of chemical action in the microzones near
the roots of wetland plants. Figure 9.10 shows that the oxy-
genated microzone around a rootlet can conduct nitrication
reactions, whereas denitrication reactions can be occurring
only microns away in the anaerobic bulk soil. Diffusion eas-
ily connects these zones because of their close proximity.
–4
–3
–2
–1
0
1
2
3
0246810
Dissolved Oxygen (mg/L)
Depth (millimeters)
14–15 °C
24–26 °C
FIGURE 9.9 Oxygen distribution above and below the sediment–
water interface at two different temperatures. (Data from Crumpton
and Phipps (1992) The Des Plaines River Wetlands Demonstra-
tion Projects. Vol. III, chap 5. Wetlands Research, Inc., Chicago,
Illinois.)
© 2009 by Taylor & Francis Group, LLC
282 Treatment Wetlands
Bacteria attached to surfaces are usually more numerous
than free-living (planktonic) bacteria (Bastviken et al., 2003,
2005). Attached bacteria form microbial communities that
are embedded in polysaccharide matrixes, e.g., biolms, and
the bacterial activity within these biolms is regulated by dif-
fusion of nutrients into the biolm and by internal processes
within this layer. In wetlands, these surfaces are as impor-
tant as the sediment for the nitrogen turnover processes
(Eriksson and Weisner, 1997; Eriksson, 2001). Biolms,
therefore, comprise a third type of spatial nonuniformity in
the wetland environment. Diffusion within the biolm con-
trols the internal supplies of oxygen, nitrate, and ammonia,
thus regulating the net effects of bacterial conversions. In
surface ow treatment wetlands, biolms have been found to
contain 10
8
–10
9
organisms/cm
2
, mostly beta and gamma Pro-
teobacteria (Flood et al., 1999). Ammonia oxidizers (beta)
were more prevalent near the inlet; denitriers (gamma) were
more prevalent near the outlet. Alum addition was found to
totally eliminate these bacteria.
Another type of spatial nonuniformity exists due to the
presence of longitudinal gradients in dissolved oxygen in the
ow direction. Oxygen may be depleted by heterotrophic
activity, as well as nitrication; but atmospheric reaeration
also occurs.
Clearly, wetland oxygen environments are much more
complex than either the complete-mix situation that domi-
nates activated sludge processing or the attached growth
environment of trickling lters. Results from those technolo-
gies should not be extrapolated to treatment wetlands.
Wetland Environments—Dissimilatory Nitrate
Reduction to Ammonium Nitrogen
Nitrate loss in treatment wetlands is often attributed to deni-
trication in the absence of proof that this mechanism is
indeed the operative one. Other known and studied candi-
date mechanisms in wetlands include assimilation by plants
and microbiota, and dissimilatory reduction to ammonium
nitrogen (DNRA). These alternative reduction routes have
been documented to comprise from 1–34% of the total nitrate
loss (Bartlett et al., 1979; Stengel et al., 1987; Cooke, 1994;
Van Oostrom and Russell, 1994). Bartlett et al. (1979) mea-
sured production of ammonium, dinitrogen, and nitrous
oxide for microcosms with soils from a treatment wetland,
but with no plants. From 1–6% of the product was ammo-
nium nitrogen; the balance was measured as dinitrogen, with
only trace amounts of nitrous oxide. Cooke (1994) measured
15
N-labelled nitrate, ammonium, and organic nitrogen in
unvegetated microcosms in a treatment wetland. He found
34%, 6%, and 60% of K
15
NO
3
converted by dissimilatory
processes, microbial assimilatory processes, and denitrica-
tion, respectively, at one site; and 25%, 5%, and 70% at a
second site. Stengel et al. (1987) used the acetylene blockage
technique to establish that 75–90% of the nitrate loss in a
ow through, Phragmites/gravel SSF unit was due to deni-
trication. Van Oostrom and Russel (1994) measured 16%
dissimilatory nitrate reduction in microcosms containing
Glyceria maxima mats.
The relative importance of denitrication and dissimila-
tory reduction of nitrate to ammonium in the soil environment
FIGURE 9.10 Pathways of nitrogen transformations in the immediate vicinity of a plant root.
Soil
Anaerobic
Aerobic
Aerobic
Anaerobic
Soil
Root
Organic
N
Organic C
CH
4
N
2
O
2
CH
4
NH
4
+
NH
4
+
N
2
NO
3
–
NO
3
–
© 2009 by Taylor & Francis Group, LLC
Nitrogen 283
is far from certain. Denitrication may be the dominant pro-
cess in environments rich in nitrate but poor in carbon, whereas
the dissimilatory reduction of nitrate and nitrite to ammonium
tends to dominate in carbon-rich environments, which are
preferably colonized by fermentative bacteria (Tiedje et al.,
1982). So nitrate-ammonifying bacteria may be favored by
nitrate-limited conditions (Laanbroek, 1990). Nitrate ammo-
nication is found in facultative anaerobic bacteria belong-
ing to the genera Bacillus, Citrobacter, and Aeromonas, or in
the members of Enterobacteriaceae (Cole and Brown, 1980;
MacFarlane and Herbert, 1982; Grant and Long, 1985). How-
ever, strictly anaerobic bacteria belonging to the genus Clos-
tridium are also able to reduce nitrate to ammonia (Caskey
and Tiedje, 1979, 1980). For many of the bacteria responsible
for dissimilation to ammonium, formate is a major elec-
tron donor both for nitrate and nitrite, although most of the
research on the nitrate reductase activity has been restricted
to enteric bacteria such as Escherichia coli (Killham, 1994).
Conversion of NO
3
−
to NH
4
and organic nitrogen increases
markedly with decreasing redox potential, high pH, and large
quantities of readily oxidizable organic matter (Nommik,
1956; Buresh and Patrick, 1978, 1981). Nitrate respiration
to NH
4
occurs at E
h
values of less than −100 mV (Patrick,
1960; Buresh and Patrick, 1981).
Wetland Environments—Effects of Vegetation
Wetland vegetation inuences nitrogen supplies because of
uptake associated with growth, which is the topic of a later
section. However, vegetation also serves other functions in
nitrate reduction, including carbon supply and microbial
attachment sites. Wetlands may contain emergent or submer-
gent vegetation, and areas of unvegetated open water. Plants
may be woody or soft-tissued. Community specicity for
denitrication is expected, roughly correlated with carbon
availability and the amount of immersed surface area.
Unvegetated open water does not promote denitrica-
tion, resulting in rate constants about one third of those for
vegetated systems (Arheimer and Wittgren, 1994). Smith
et al. (2000) have shown nitrate removal proportional to
number of shoots in a Schoenoplectus spp. wetland. Wetlands
with woody species—shrubs and trees—also have relatively
low rates of denitrication (Westermann and Ahring, 1987;
DeLaune et al., 1996). Carbon limitation is the likely cause.
Either emergent or submergent vegetation can harbor
epiphytic microbial biolms on living and dead plant mate-
rial (Eriksson and Weisner, 1997). However, living underwa-
ter plants produce oxygen, which inhibits denitrication. Field
data do not provide clear guidance on the choice between
emergent and submergent plants. Weisner et al. (1994) found
Potamageton to be more effective than Glyceria, and Phrag-
mites stands to be better than open water. Eriksson and
Weisner (1997) measured very high rates of denitrication in
a reservoir with dense Potamageton pectinatus. Conversely,
Gumbricht (1993a) found low rates for Elodea canadensis.
Toet (2003) found that emergent stands of Typha and Phrag-
mites yielded nitrate removal rates of 98 and 287 kg/ha·yr,
respectively, whereas mixed submerged aquatics (Elodea,
Potamogeton and Ceratophyllum) removed only 16–20
kg/ha·yr.
These considerations lead to the conclusion that fully
vegetated marshes with either emergent or submergent com-
munities are the preferred option for denitrication. Weisner
et al. (1994) reached this conclusion and suggested that an
alternating banded pattern perpendicular to ow would addi-
tionally provide hydraulic benets.
Denitrifying bacteria are more abundant than the nitri-
ers, in both FWS and SSF treatment wetlands. Listowel
results show higher populations in the sediments in spring
and summer, about 10
6
/g versus 10
5
/g in fall and winter
(Herskowitz, 1986). Denitriers were found at higher lev-
els in a U.K. gravel bed, approximately 10
7
–10
8
/g; and most
were associated with roots rather than the gravel (May et al.,
1990).
Sulfur-Driven Autotrophic Denitrification
Sulfur-driven autotrophic denitrication, as an alternate to
carbon-driven, heterotrophic denitrication, is well known
(Koenig and Liu, 2001; Soares, 2002). The bacterium Thio-
bacillus denitricans can reduce nitrate to nitrogen gas while
oxidizing elemental sulfur, or reduced sulfur compounds
including sulde (S
2−
), thiosulfate (S
2
O
3
2−
), and sulte (SO
3
2−
).
For example, the chemistry proposed for utilization of ele-
mental sulfur is (Batchelor and Lawrence, 1978):
NO S CO H O NH
N
232 4
2
11 040 076 008
05 0
l
008 11 12
4
2
CHON SO H
572
+
(9.28)
If sulde is the primary species of reduced sulfur, the pro-
posed chemistry is (Komor and Fox, 2002):
NO S CO N SO
3
2
224
2
0 74 0 1886 0 48 0 74
00
l
.337 01 037CHON H HO
572 2
(9.29)
This reaction requires 1.69 g sulde sulfur per gram of nitrate
nitrogen. Other postulated reactions also exist. For instance,
iron pyrite may be oxidized (Pauwels and Talbo, 2004):
14 5 4 7 5 10 2
32 2
2
4
2
NO FeS H N Fe SO H O
2
l
(9.30)
Treatment wetlands can have many forms of sulfur in
sediments, arising from the introduction of sulfate in the
incoming water. Reducing conditions can form suldes and
elemental sulfur in the sediments (see Chapter 11). Those
sediments also contain carbon compounds, and conse-
quently both heterotrophic, carbon-driven, and sulfur-driven
denitrication have been observed to occur simultaneously
in wetland sediments (Nahar et al., 2000; Komor and Fox,
© 2009 by Taylor & Francis Group, LLC
284 Treatment Wetlands
2001, 2002; Wass, 2003). The production of dinitrogen gas
is accompanied by oxidation of sulde to sulfate by the auto-
trophic process.
Given the variety of alternate electron acceptors for
denitrifying organisms, it is not surprising that carbon is
not limiting in some wetland situations where it would be
expected (Fleming-Singer and Horne, 2006).
AEROBIC DENITRIFICATION
Nitrite reduction to gaseous products by denitrifying bac-
teria used to be considered to be a strictly anaerobic pro-
cess, but this fallacy was dispelled with the discovery of
aerobic denitrication (Robertson et al., 1995). Aerobic
denitrication is often coupled to heterotrophic nitrication
in one organism. Because nitrication is mostly measured
by the formation of nitrate or nitrite under oxic conditions,
although (aerobic) denitrication is not expected under such
conditions, this coupled process is not easily observed in
standard enrichment cultures. The observation that Thios-
phaera pantotropha and other organisms are not only het-
erotrophic nitriers, but also aerobic denitriers forced a
reevaluation of this approach (Ludwig et al., 1993; Jetten,
2001). Aerobic denitriers are present in high number in
natural soil samples. Even though the specic activities are
not always very high, they are sufcient to allow signicant
contribution to the turnover of compounds in the nitrogen
cycle (Jetten et al., 1997).
ANAEROBIC AMMONIA OXIDATION (ANAMMOX)
There is now solid evidence for anaerobic elimination of nitrite
by ammonia, also called anaerobic ammonia oxidation (anam-
mox), in a number of wastewater treatment environments (van
de Graaf et al., 1990; Mulder et al., 1995; van Loosdrecht
and Jetten, 1998). In an environment with nitrite and ammo-
nia present, a reaction to dinitrogen has been demonstrated
commercially:
NH NO
42
Planctomycetes
Nitrosomonas eutropha
||l||||||| NHO
22
2
(9.31)
The overall chemistry, including nitrite formation and bac-
terial growth requirements, has been proposed to be (Furu-
kawa et al., 2001):
NH O N NO H O H
32 2
l
085 044 011 143 014
23
. .
(9.32)
The process proceeds through nitrite, formed according to
Equations 9.22 and 9.23, and carries an oxygen requirement
of only 1.94 g O per gram of NH
4
–N. It is autotrophic, and
has no organic carbon requirement.
Various commercial processes are now available
which capitalize on the advantages of this alternative
route for nitrogen removal. The completely autotrophic
nitrogen removal over nitrite (CANON) process utilizes
partial nitritation accompanied by Anammox
®
in a single
vessel (Third et al., 2005). The SHARON
®
Anammox pro-
cess utilizes partial nitritation in one vessel, and anaerobic
elimination of nitrite by ammonia in a second (van Don-
gen et al., 2001). The microbiology has also been demon-
strated in sequencing batch reactors (Kuai and Verstraete,
1998; Strous et al., 1998; Sliekers et al., 2002), activated
sludge (Hao and van Loosdrecht, 2004), and rotating bio-
logical contactors (RBCs) (Helmer and Kunst, 1998; Koch
et al., 2000).
Given advances in the ability to search for and detect
nitrogen processing organisms, they have also been found in
natural treatment systems. Anammox bacteria are present in
soil aquifer treatment (Fox and Gable, 2003; Gable and Fox,
2003). They have also been identied in both FWS and SSF
wetlands. Austin et al. (2003) found 13% of Plantomycetes in
a vertical ow SSF wetland, of which a small fraction were
autotrophic denitriers. They were also found in SSF and
FWS wetlands treating partially nitried domestic wastewa-
ter (Shipin et al., 2004).
The importance of this alternative pathway for ammo-
nia and oxidized nitrogen removal for treatment wetland
analysis lies in the reduced carbon and oxygen require-
ments: less than half the oxygen and no carbon, compared
to conventional routes. In many wetland situations, there is
adequate oxygen present to allow traditional nitrication
(Equations 9.20 and 9.21). Likewise, in other instances,
there is adequate carbon present to fuel traditional denitri-
cation (Equation 9.27). But there are wetlands for which
ammonia and oxidized nitrogen are removed in amounts
that considerably exceed the estimated supplies of carbon
and oxygen. Tanner and Kadlec (2002) found ammonia
losses that would have required far more oxygen trans-
fer than could reasonably be expected in a VF (saturated
upow) system, and Sun and Austin (2006), demonstrated
similar results for highly loaded VF (saturated downow)
columns, while Bishay and Kadlec (2005) found the same
for an FWS wetland. In the latter case, nitrite was present
in relatively large quantities, and the carbon supply was
not adequate to support traditional denitrication. In these
instances, Anammox offers a potential explanation, but has
not been conrmed.
NITROGEN FIXATION
Biological nitrogen xation is the process by which nitrogen
gas in the atmosphere diffuses into solution and is reduced
to ammonia nitrogen by autotrophic and heterotrophic bacte-
ria, cyanobacteria (blue-green algae), and higher plants. The
reduction of gaseous nitrogen (N
2
) to ammonia (NH
3
) takes
place very rapidly and for this reason the individual steps in
the reaction have not been investigated in detail. It is sup-
posed that the whole reaction is a three-step, two-electrons-
per-step mechanism (Winter and Burris, 1976):
N N HN NH H N N H NH
22 3
xl l l
diimide
hydrazine
(9.33)
© 2009 by Taylor & Francis Group, LLC
Nitrogen 285
There are six main types of N
2
-xing organisms that can be
found in soil (Killham, 1994):
1. Free-living bacteria such as Bacillus, Klebsiella,
and Clostridium that x N
2
anaerobically (the
rst two are facultative anaerobes and x nitrogen
under reduced oxygen tensions whereas Clostrid-
ium is an obligate anaerobe)
2. Bacteria of the genus Rhizobium, which x N
2
mainly in the root nodules of leguminous plants
3. Actinomycetes of the genus Frankia, which x
N
2
in the root nodules of nonleguminous angio-
sperms such as Alnus glutinosa (those associations
are often referred to as “actinorhizas”)
4. Free-living cyanobacteria on the soil surface such
as Nostoc and Anabaena
5. Symbiotic cyanobacteria found in the lichen
symbiosis
6. N
2
-xing bacteria loosely associated with the
roots of certain plants, sometimes referred to as
“rhizocoenoses” (e.g., Azotobacter, Beijerinckia
and Azospirilllum)
In wetland systems, free-living bacteria, cyanobacteria (blue-
green algae), N
2
-xing bacteria loosely associated with the
roots of certain plants, and probably Frankia are the most
important N
2
-xing organisms.
Also, the aquatic fern, Azolla, and a few transitional, wet-
land vascular plant species in the genera Alnus and Myrica
have been observed to x atmospheric nitrogen (Waughman
and Bellamy, 1980). Because nitrogen xation uses stored
energy from either autotrophic or heterotrophic sources, it is
not an adaptive process when nitrogen is otherwise available
for growth. The presence of ammonium nitrogen is reported
to inhibit nitrogen xation (Postgate, 1978; as referenced by
Van Oostrom and Russell, 1994).
Under anaerobic conditions, microbial assemblages
in the root zone of Typha spp. and Glyceria borealis were
shown to x considerable quantities of atmospheric nitrogen
(Bristow, 1974). The majority of the activity was shown to be
associated with the plants rather than the soils. Fixation rates
at 20nC were determined to be 33.6 and 353 mg/kg roots·day
for Typha and Glyceria, respectively. The measured rates of
nitrogen xation were estimated to be able to supply 10–20%
of the growth requirement for Typha, and 100% for Glyce-
ria. Under aerobic conditions, xation dropped by an order
of magnitude.
The nitrogen xation potential for the soil-microbe
assemblage was studied for 45 sites in 17 peatlands in
eight countries by Waughman and Bellamy (1980). The
appropriate subset in the context of treatment wetlands
was the rich or extremely rich fen category, with 6.5 a
pH a 7.6, for which N 12 sites. These showed xa-
tion potentials averaging 0.622 mg/L per day of soil. A
30-cm root zone would then x 70 gN/m
2
·yr. Other esti-
mates from natural freshwater wetlands range from 0 to
55 gN/m
2
·yr (Vymazal, 2001b). Estimates of nitrogen xation
in a cypress dome receiving municipal wastewater ranged
from 0.012 to 0.19 g/m
2
·yr (Dierberg and Brezonik, 1984)
and were concluded to be an insignicant component of the
TN loading to this treatment wetland.
These results do not permit quantication of the xation
occurring in treatment wetlands, but do indicate the ability of
wetland plants and soils to x nitrogen. It is unlikely that the
rates of xation in treatment wetlands contribute materially
to nitrogen cycling in nitrogen-rich systems.
9.4 VEGETATION EFFECTS ON NITROGEN
PROCESSING
Plants utilize nitrate and ammonium, and decomposition pro-
cesses release nitrogen back to the water. There are two direct
effects of vegetation on nitrogen processing and removal in
treatment wetlands:
The plant growth cycle seasonally stores and
releases nitrogen, thus providing a “ywheel”
effect for a nitrogen removal time series.
The creation of new, stable residuals accrete in the
wetland. These residuals contain nitrogen as part
of their structure, and hence accretion represents a
burial process for nitrogen.
On an instantaneous basis, plant uptake can be important for
many wetland systems. A benchmark instantaneous growing
season rate is suggested to be 120 gN/m
2
·yr (Kadlec, 2005d).
The majority of the assimilated nitrogen is subsequently
released during death and decay, but a small amount is per-
manently stored as new soil and sediment. The net removal
of ammonia to accretion, via the vegetative cycle, is on the
order of 10 gN/m
2
·yr. This amount is of great importance for
very lightly loaded wetlands, but of no importance for heav-
ily loaded systems.
The two forms of nitrogen generally used for assimila-
tion are ammonia and nitrate nitrogen. Nitrate uptake by wet-
land plants is presumed to be less favored than ammonium
uptake. But in nitrate rich waters, nitrate may become a more
important source of nutrient nitrogen. Aquatic macrophytes
utilize enzymes (nitrate reductase and nitrite reductase) to
convert oxidized nitrogen to useable forms. The production of
these enzymes decreases when ammonium nitrogen is pres-
ent (Melzer and Exler, 1982). Plants such as cattails (Typha
latifolia) are very able to utilize either nitrate or ammonia
(Brix et al., 2002b), and so are algae (Naldi and Wheeler,
2002) and cultivated rice (Kronzucker et al., 2000). Dhondt
et al. (2003) found that about half of the applied nitrate in
a riparian wetland was utilized by plants, whereas half was
denitried.
In the Santee, California, study of a Scirpus/gravel HSSF
wetland (Gersberg et al., 1984), the entire nitrate loss was
ascribed to plant uptake in the absence of an exogenous car-
bon source and with essentially no ammonium in the nitri-
ed inuent. This process may also be important in other
•
•
© 2009 by Taylor & Francis Group, LLC
286 Treatment Wetlands
treatment wetlands. For instance, a short-term
15
N study of
several SSF gravel wetland mesocosms (Zhu and Sikora,
1994) showed 70%–85% of the entire nitrate loss was plant
uptake—in the absence of an exogenous carbon source and
with essentially no ammonium in the nitried inuent. Dif-
ferent species responded differently: 70% of the nitrate was
taken up by Phragmites australis, 75% by Typha latifolia,
and 85% by Scirpus atrovirens georgianus. In the absence of
denitive results on the proportions of nitrate versus ammo-
nia uptake in treatment wetlands, some authors have opted
to presume these are utilized in proportion to the quantities
in the water (Martin and Reddy, 1997; Tanner et al., 2002a).
However, process factors argue against this simple expecta-
tion. First, plants extract their nitrogen requirements via their
root system, which is predominantly located in the wetland
soil, with the possible exception of adventitious roots, which
occur in the water column. Nutrients reach the subsurface
root system via diffusion under appropriate circumstances,
but more importantly via transpiration ux, the vertical water
ow driven by the transpiration requirement of the plant (see
Chapter 4). The upper soil horizon that contains the roots is
typically anoxic and has a high carbon content, and there-
fore is capable of supporting denitrication (Crumpton et al.,
1993). Nitrate that moves downward toward the root zone
is therefore unlikely to survive in the same proportion as it
exists in the water column above the soil.
THE EFFECTS OF VEGETATION GROWTH AND CYCLING
The removal of ammonia from water by wetland plants has
been the subject of many studies (e.g., Reddy and DeBusk,
1985; Rogers et al., 1991; Busnardo et al., 1992; Tanner,
1996). Many such studies have been characterized by mea-
surements of gross nitrogen uptake, with no deduction for
subsequent losses due to plant death and decomposition, with
the attendant leaching and resolubilization of nitrogen.
From the standpoint of nitrogen removal from wetland
water, it is the net effect of the macroora on water phase
concentrations that is of interest. Here the terminology of
Mueleman et al. (2002) will be used (see Figure 3.7):
Phytomass refers to all vegetative material, living
plus dead.
Biomass refers to all living vegetative material.
Necromass refers to all dead vegetative material.
The seasonal patterns of vegetation growth and nitrogen stor-
age embody complex patterns of biomass allocation among
plant parts, as well as the nitrogen content of those various
portions of living and dead material. However, from the point
of view of the annual ecosystem removal of nitrogen, uptake
and return from the combination of biomass and necromass
are the principal features of concern. On an annual average
basis, the only concern is net removal to permanent storage.
However, during the course of the year, uptake and return
may occur at different times, thus inuencing removals dif-
ferently in different seasons. For these reasons, it is necessary
•
•
•
to examine the transfers to and from the collective parts of
the macrophytes, which is here dened as phytomass. Dur-
ing the course of the year, especially in temperate climates,
phytomass increases during the growing season, and shrinks
during the senescence season. The same pattern is followed
by phytomass nitrogen.
A Mass Balance Framework
The purpose here is to make order-of-magnitude assessments
of the role of vegetation in the overall set of ammonia nitro-
gen processes. This choice has the effect of establishing a
“green and brown box,” which interacts with the balance of
the
wetland ecosystem (see Figure 3.7). The nitrogen mass
balance for that box is (instantaneously)
()JJJ
d
dt
urb
N
(9.34)
or for a xed time period ∆t:
()JJJt
urb
$$N
(9.35)
where
uptake of nitrogen by phytomass (
u
JU
ee
2
r
), gN/m ·d
release of nitrogen from phyJ ttomass
(),gN/m·d
burial of nit
ab
2
b
LD D
J rrogen from phytomass
(+),gN/m·d
/
ab
2
AA
dN ddt storage change rate of nitrogen in phytoomass,
gN/m ·d
increase in nitrogen stor
2
$N aage in phytomass, gN/m
time interval, d
2
$t
The uptake of nitrogen is via the root system, which is usu-
ally belowground. Nitrogen must therefore be transported
into the rhizosphere, by processes of diffusion (minor)
and vertical movement driven by transpiration ux (major)
(Reddy et al., 2005). Some of the new plant growth nutrient
requirement is supplied by translocation from stores in the
rhizomes, and some from uptake from pore water. It is pos-
sible that the presence of nitrogen-rich pore waters causes
less withdrawal from rhizomes, and causes lesser storage in
belowground tissues (Tanner, 2001a).
Nitrogen is returned to surface waters and pore waters
by leaching and decomposition. It is likely that the major-
ity of nitrogen in the necromass is returned, with lesser
amounts transferred to permanent burial in the form of
new soils and sediment. Over the course of a full calen-
dar year, for a repetitively stable ecosystem, there is no
change in the total phytomass, and ∆N 0. For that annual
period, plant uptake is either returned (more) or buried
(less). But, as can be seen from Figure 9.11, the total phy-
tomass nitrogen grows in spring and early summer, and
recedes in autumn. This annual cycle is more pronounced
in cold climates, in response to the more pronounced sea-
sonal conditions.
© 2009 by Taylor & Francis Group, LLC
Nitrogen 287
At this point in the development of knowledge about
wetland plant nitrogen cycling, there is some good idea of
the change in storage (∆N) for a given time interval, but
less about the three individual uxes that lead to the stor-
age (J
u
, J
r
, J
b
).
A Speculative Numerical Assessment
The green and brown box, consisting of all phytomass nitro-
gen, expands during the growing season, and contracts dur-
ing the balance of the year. The purpose here is to assess the
approximate magnitude of these nitrogen withdrawals and
returns upon the amount of ammonia nitrogen in the water
column. Some useful insights may be gained by speculatively
assigning uptake and burial (Kadlec, 2005b). These are:
1.
A xed proportion of the necromass nitrogen that
returns to water.
2. A constant rate of burial (J
b
) apportioned to the
unfrozen season.
3. Nitrogen release driven by the amount of necro-
mass during the unfrozen season.
As an order-of-magnitude illustration, an annual phytomass
nitrogen cycle is presumed to follow a smoothed version of
Fi
gure 9.11. An annual accretion of 20 gN/m
2
·yr is proposed.
This is apportioned over a growing season (unfrozen) of eight
months, at a constant rate of 2.5 gN/m
2
·mo. Four times that
amount, 80 gN/m
2
·yr, is presumed to be returned to water.
Growth begins at the end of April, and ends in December,
causing nitrogen uptake from April through August, totaling
156 gN/m
2
. During September through December, 56 gN/m
2
is returned from senescing and decaying necromass from the
current year. TN return is 80 56 136 gN/m
2
for the year,
or 87% of the uptake. Only 13% of the nitrogen uptake nds
its way into recalcitrant residual forms. However, during the
spring growth period, the entire external nitrogen loading is
consumed to create the standing crop. These seasonal effects
are summarized in Figure 9.12. The loading to the wetland
was 240–270 gN/m
2
·yr. Thus, it is seen that vegetative trans-
fers make up major fractions of the external load.
Treatment wetland data show growing season vegeta-
tive uptakes of 20–100 gN/m
2
, which occurs during a four-
to six-month period in temperate climates. This results in
growing season uptake rates of 40–200 g/m
2
·yr. A median
benchmark uptake loading of 120 g/m
2
·yr has been selected
here as a basis for evaluating external loadings. Examina-
tion of a large number of operational data sets for FWS
wetlands leads to the conclusion that emergent and sub-
mergent plants are important contributors to the process-
ing of ammonia in free water surface wetlands, for about
half of the existing systems (Kadlec, 2005d). For instance,
nitrogen storage in the roots and rhizomes in the inlet zone
of a FWS Phragmites/Typha treatment wetland in Byron
Bay, Australia, was 35 g/m
2
; in the leaves and stems it was
92 g/m
2
(Adcock et al., 1995). Approximately 65% of the
nitrogen added to this treatment wetland was found in the
macrophyte biomass, due to low nitrogen loading (approxi-
mately 25–40 g/m
2
·yr).
0
50
100
150
200
250
0 30 60 90 120 150 180 210 240 270 300 330 360
Yearday
Nitrogen Content (gN/m
2
)
Above
Below
Total
FIGURE 9.11 Seasonal patterns of nitrogen in Phragmites austra-
lis in the Netherlands for a fertilized stand. (Data from Mueleman
et al. (2002) Wetlands, 22(4): 712–721.)
"%#$
!#&
#
'#
FIGURE 9.12 Hypothetical seasonal transfers of nitrogen corresponding to the measured growth pattern of Figure 9.11. The loading to the
wetland was 240–270 gN/m
2
·yr. (Data from Mueleman et al. (2002) Wetlands, 22(4): 712–721.)
© 2009 by Taylor & Francis Group, LLC
288 Treatment Wetlands
ACCRETION OF NITROGENOUS RESIDUALS
The least studied aspect of nitrogen transfer in wetlands is in
the creation of new soils and sediments, with their attendant
nitrogen content. Not all of the dead plant material undergoes
decomposition. Some small portions of both aboveground
and belowground necromass resist decay, and form stable
new accretions. Such new stores of nitrogen are presumed to
be resistant to decomposition. The origins of new sediments
may be from remnant macrophyte stem and leaf debris, rem-
nants of dead roots and rhizomes, and from undecomposable
fractions of dead microora and microfauna (algae, fungi,
invertebrates, bacteria).
The amount of such accretion has been quantied in
only a few instances for free water surface wetlands (Reddy
et
al., 1991; Craft and Richardson, 1993a,b; Rybczyk et al.,
2002), although anecdotal reports also exist (Kadlec, 1997a).
Quantitative studies have relied upon either atmospheric
deposition markers (radioactive cesium or radioactive lead),
or introduced horizon markers, such as feldspar or plaster.
Either technique requires several years of continued deposi-
tion for accuracy.
Reddy et al. (1991) used
137
Cs to estimate the rate of
accretion in a mildly fertilized cattail wetland in Florida,
which ranged from approximately 5 to 11 mm/yr of low bulk
density material, less than 0.1 g/cm
3
. The nitrogen content
of these new accretions was measured to be approximately
3%, resulting in annual accretion rates of 11–24 gN/m
2
·yr.
Murkin et al. (2000) found 4.5–6.5 gN/m
2
·yr annual accre-
tion rates for low nutrient, mixed marshes in Manitoba. Soto-
Jiménez (2003) reported net sedimentation of nitrogen of
11.3 gN/m
2
·yr for a marsh receiving strong agricultural run-
off. Hocking (1989b) estimated 8 gN/m
2
·yr annual accretion
rate for Phragmites australis in a nutrient-rich Australian set-
ting. Klopatek (1978) estimated 5 gN/m
2
·yr annual accretion
rate for a Schoenoplectus (Scirpus) uviatilis stand. Repre-
se
ntative accretion rates are given in Table 9.6.
The manner of accretion has sometimes been presumed
to be sequential vertical layering (Kadlec and Walker, 1999;
Rybczyk et al., 2002), but that view is likely to be overly
simplied. At least two factors argue against simple layer-
ing: vertical mixing of the top soils and sediments (Robbins
et al., 1999), and the injection of accreted root and rhizome
residuals at several vertical positions in the root zone. None-
theless, new residuals are deposited on the wetland soil sur-
face from various sources. The most easily visualized is the
litterfall of macrophyte leaves, which results in top deposits
of accreted material after decomposition. However, algal
and bacterial processing which occurs on submersed leaves
and stems results in litterfall and accretion of micro-detrital
residuals.
SHORT-TERM ANOMALIES
In addition to the considerations of long-term repetitive
annual vegetation effects on wetland nitrogen processing,
there are transient effects related to start-up of treatment
wetlands. These transient events are different from the stable
annual pattern of swelling and shrinking of the phytomass
nitrogen storage. Results from transient studies must not
be construed as being representative of long-term patterns.
Some case study transient results are informative.
FWS Mesocosm Start-Up
Busnardo et al. (1992) operated FWS mesocosms vegetated
with Scheonoplectus (Scirpus) californicus. The ammonia
loading rates to the mesocosms were 330 and 670 gN/m
2
·yr
for two consecutive seven-month periods. Approximately 60%
of the ammonia nitrogen removed was found in plant growth.
TABLE 9.6
Accretion Rates in FWS Wetlands
Location Reference Method
Water NH
4
–N
(Typical) (mg/L)
Accretion
(cm/yr)
Nitrogen Burial
(gN/m
2
·yr)
Louisiana Rybczyk et al. (2002); 400–500 gC/gSoil; 2.0% N
a
Feldspar 0.05 0.14 —
Michigan Kadlec and Robbins (1984) Lead 210 0.1 0.2 —
Everglades WCA2A Reddy et al. (1991); 300–500 gC/gSoil; 3.0% N Cesium 137 0.3 0.5 9
Everglades WCA2A Craft and Richardson (1993a,b); 450 gC/gSoil; 3.2% N Cesium 137 0.3 0.4 11.6
Everglades WCA3 Craft and Richardson (1993a,b); 450 gC/gSoil; 3.2% N Cesium 137 0.1 0.3 10.7
Everglades, Florida Robbins et al. (1999); 3.0% N
a
Lead 210 0.3 0.5 11
Everglades, Florida Chimney (2000), unpublished data; 500 gC/gSoil;
3.2% N
Feldspar 0.1 0.85 35
Iron Bridge, Florida Miner et al. (2002) Visual 0.1 1.17 —
Louisiana Rybczyk et al. (2002); 400–500 gC/gSoil; 2.0% N
a
Feldspar 15 1.14 23
Sacramento, California Nolte and Associates (1998b); 4.3% N Visual 16 1.5 44
Houghton Lake,
Michigan
Kadlec (1997); 400–500 gC/gSoil; 3.2% N Resurvey 10 1.8 56
Chiricahueto, Mexico Soto-Jiménez et al. (2003); 10–40 gC/gSoil; 0.3% N Lead 210 14 1.0 1.5
a
Assumed value.
© 2009 by Taylor & Francis Group, LLC
Nitrogen 289
Although this experiment demonstrated that emergent mac-
rophytes have the capacity to assimilate large quantities of
ammonia, Busnardo et al. (1992) speculated that plants would
have a lesser effect in mature wetlands.
SSF Mesocosm Start-Up
A number of studies in the literature focus upon newly
planted mesocosms, which are monitored for performance
during the subsequent period of plant development. For
example, Rogers et al. (1991) reported on nitrogen pro-
cessing in 25-L buckets lled with gravel and planted with
Schoenoplectus validus rhizomes. Studies of ammonia
removal commenced ve weeks later, and continued for
35 weeks. Ammonia loading rates of 60–600 gN/m
2
·yr
were applied over periods of 10–15 weeks. Removals
ranged from 90–100%, of which about 90% was found in
the vegetation. These rates of uptake are not counteracted
by return uxes, because no necromass was formed over
the short duration of the tests. It was eventually found that
the plants in the buckets remained in the colonizing mode
for at least three years. (Rogers et al., 1991).
Ammonia Loads to a New Wetland
Newly constructed wetlands are typically planted sparsely
compared to the ultimate grow-out of vegetation. The devel-
opment of the new vegetation creates a nitrogen demand that
persists only during that grow-in period. For example, Sartoris
et al. (2000) reported on the rst two years of ammonia
removal and plant coverage for a 9.9-ha FWS constructed
wetland at Hemet, California. As the plant coverage went
from near zero (planted clumps on 1.2-m spacing) to about
80% of Schoenoplectus spp., and the vegetation density
increased by 67%, the ammonia load removed went from 98
down to 15 gN/m
2
·yr. Sartoris et al. (2000) concluded that
plant uptake was most likely the primary sink for nitrogen
during the two-year study. In this case of a FWS wetland, the
increase in coverage by plants reduced the fraction of open
water, and hence created a lesser potential for atmospheric
reaeration to support nitrication.
HARVEST TO REMOVE NITROGEN
Nitrogen removal is theoretically possible via the harvest
of plants and their associated nitrogen content. However,
aboveground standing crops do not display a large poten-
tial for removal of nitrogen, even under the assumption that
the entire crop could be recovered (Table 9.7). Based on the
productivities given by DeBusk and Ryther (1987), potential
nitrogen removal for oating large-leaved plants (Eichhornia,
Pistia, Hydrocotyle) is in the range of 100–250 gN/m
2
·yr, and
50–150 gN/m
2
·yr for oating small-leaved plants (Salvinia,
Lemna, Spirodela, Azolla).
Direct harvesting experience has shown that only a
small fraction of the applied nitrogen can be recovered in
harvested biomass (Table 9.7). Systems operating in tropical
climates may be capable of greater sustained annual vegeta-
tive removals, which are enhanceable by harvest. Koottatep
and Polprasert (1997) measured from 70 to 275 gN/m
2
·yr,
depending upon harvesting frequencies ranging from no har-
vest to every eight weeks, respectively.
Harvest may involve complete removal in the case of
oating plants (Lemna minor, Eichhornia crassipes), or cut-
ting of aboveground parts of rooted plants such as Typha,
Schoenoplectus, and Phragmites. Harvesting typically
requires expensive mechanical equipment, and is labor-
intensive for large systems. For instance, a one-time harvest
of oating mats of Typha in a Florida treatment wetland
cost approximately $16 per cubic meter of wet material, or
about $8 per kilogram of nitrogen removed. However, in
the small SSF systems, such as those commonly found in
TABLE 9.7
Amount of Nitrogen in the Standing Aboveground Stock Compared to Nitrogen Loadings
Location Reference Type
Nitrogen Stock
(gN/m
2
)
Applied Nitrogen
(gN/m
2
·yr)
Percent
Removable
Ondrejov, Czech Republic Vymazal et al. (1999) SSF Phragmites 51 1,183 4.3
Kolodeje, Czech Republic Vymazal et al. (1999) SSF Phragmites 20 493 4.1
Chmelna, Czech Republic Vymazal et al. (1999) SSF Phalaris 26.5 1,397 1.9
Zasada, Czech Republic Vymazal et al. (1999) SSF Phalaris — — 0.8
Hamilton, New Zealand Tanner (2001a) SSF Schoenoplectus 23 431 5.3
Hamilton, New Zealand Tanner (2001a) SSF Schoenoplectus 40 1,256 3.2
Sacramento, California Nolte and Associates (1998b)
FWS Typha Scirpus
60 360 16.5
ENR, Florida Everglades ENR Cell 1,
unpublished data
FWS Typha 4.7 8 60
Byron Bay, Australia Adcock et al. (1995)
FWS Leersia Urochloa
44 203 21
Houghton Lake, Michigan Houghton Lake, Michigan–based
50 ha, unpublished data
FWS Typha 25 10 250
Malham, United Kingdom Hurry and Bellinger (1990) FWS Phalaris 49 469 11
Duplin County, North Carolina Hunt et al. (2002) FWS Typha 32 392 8
Duplin County, North Carolina Hunt et al. (2002) FWS Scirpus 35 420 8
Greensboro, North Carolina Hunt et al. (2002) FWS Typha 20 971 2
© 2009 by Taylor & Francis Group, LLC
290 Treatment Wetlands
Europe, harvesting is easy and forms a negligible amount
within the annual O&M costs.
The problem of biomass disposal is often not eas-
ily resolved. Harvested biomass may either be composted,
or digested to form a biogas product. Composting requires
transportation costs, and dedicated land area. Biogas genera-
tion from water hyacinths has been shown to be feasible (Bil-
jetina et al., 1987; Joglekar and Sonar, 1987); however, sludge
disposal remains a problem. The capital cost of harvesting
and gas generation about is about the same as for the rest
of the wastewater treatment plant, and is thus prohibitively
expensive (Chynoweth, 1987). As a consequence of these dif-
culties, plant harvesting is not favored for nitrogen removal
(Crites and Tchobanoglous, 1998), and has seldom been used
except for oating plants.
SOIL AND SEDIMENT EFFECTS ON NITROGEN PROCESSING
Apart from accretion, wetland solids form a large pool of
nitrogen, some of which is available for exchange with sur-
face waters and pore waters. As noted above, sorption and
cation exchange are active processes in the wetland environ-
ment. These nitrogen solid storages will stabilize under con-
tinuous operation of a treatment wetland, but are nonetheless
active, and exchange compounds with their surroundings.
Thus the image of nitrogen compounds traveling with the
owing water is incorrect; nitrogen follows a “park and go”
trajectory through the wetland.
Kadlec et al. (2005) reported these exchanges for
SSF treatment wetlands. Four mesocosm trains and one
eld-scale wetland contained well-established bulrushes
(Schoenoplectus tabernaemontani), and another eld-scale
wetland remained unvegetated. The systems were operated
at steady inows, with a nominal detention times of four
to ve days. The incoming ammonium nitrogen ranged
from 18.5–177 g/m
3
, and removals ranged from 15% to
90% for the various feed waters. Each system was dosed
with a single pulse of
15
N ammonium mixed into the feed
wastewater, and the fate and transport of the isotopic nitro-
gen were determined. The
15
N pulses took 120 days to clear
the heavily loaded eld-scale wetlands. During this period
small reductions in
15
N were attributable to nitrication/
denitrication, and a larger reduction due to plant uptake.
Mesocosm tests ran for 24 days, during which only 1–16%
of the tracer exited with water, increasing with nitrogen
loading. Very little tracer gas emission was found, about
1%. The majority of the tracer was found in plants (6–48%)
and sediments (28–37%). These results indicated a rapid
absorption of ammonium into a large sediment storage
pool, of which only a small proportion was denitried
during the period of the experiment. Plant uptake claimed
a fraction of the ammonium, determined mainly by the
plants requirement for growth rather than the magnitude
of the nitrogen supply. A rapid return of ammonium to the
water was also found, so that movement of
15
N through the
wetland mesocosms comprised a “spiral” of uptake and
release along the ow path.
9.5 NITROGEN MASS BALANCES
The individual process considerations discussed above may
be combined to form the integrated concept of nitrogen uxes
in treatment wetlands. This interpretive step is very impor-
tant, because it
1. Identies the true rates of ammonication, ammo-
nia oxidation, and denitrication.
2. Places the role of the vegetative nitrogen cycle in
the context of the microbial processes.
3. Allocates the fate of added nitrogen to storage,
leakage, and gasication.
The use of the percent removal measure may be very mis-
leading for separate nitrogen species. For example, U.S. EPA
(1993f) found that approximately half of the SSF wetlands
inventoried had negative percent removals for ammonia. In
the absence of speciated nitrogen mass balances, that tech-
nology assessment ascribed the good performance to lack
of algae, oxygen availability and long detention, and poor
performance to short rooting depth and oxygen deciency.
However, in the absence of adequate data on ammonica-
tion, U.S. EPA (1993f) dismissed that process as not being a
contributing factor. Much more information is now available,
and it is possible to examine the nitrogen interconversions in
more detail.
MASS BALANCE CASE STUDIES
Only a few wetland studies have reported mass balances
for the interrelated species of nitrogen (Tanner and Kadlec,
2002; Senzia et al., 2002b; Bishay and Kadlec, 2005; Kadlec
et al., 2005). In all cases, the involvement of vegetation in the
nitrogen cycle is somewhat speculative, because it depends
upon estimates of biomass and tissue nitrogen content. None-
theless, much is known about standing stocks and turnover
rates, as well as the (narrow) bounds on nitrogen percent-
ages in that biomass. Here three examples of FWS wetland
nitrogen mass balances will be explored: (1) a lightly loaded
polishing wetland, (2) a leaky wetland treating contaminated
river water, and (3) a seasonal wetland treating nitrogenous
mine wastewaters. In each case, long-term performance is
examined, and consequently seasonal effects are not eluci-
dated. One example of mass balance for an HSSF wetland is
presented as well.
Orlando Easterly, Florida, FWS Wetland
This treatment wetland has been in operation since 1987, and
is described in general terms in U.S. EPA (1993a). It is a 494-
ha constructed free water surface wetland with 17 compart-
ments in a series and parallel arrangement, which receives
about 60,000 m
3
/d of highly treated municipal efuent. The
cells were vegetated with soft-tissue emergent plants, and the
vegetative communities evolved over time to a mixed marsh
condition. In addition to annual and specialty project reports,
© 2009 by Taylor & Francis Group, LLC
Nitrogen 291
there have been several published papers (Jackson, 1989;
Jackson and Sees, 2001; Martinez and Wise, 2003a,b; Wang
et al., 2006a,b). Data used here are from the ten-year period
1993–2002.
Nitrogen totals less than 3 mg/L entering the system,
and less than 1.4 mg/L in the efuent from the wetland.
Atmospheric contributions are not negligible under these
circumstances, and are estimated at 2.0 mg/L based upon
other Florida data. The inlet hydraulic loading was 1.2 cm/d,
and rainfall averaged about 0.4 cm/d (Table 9.8A). Particu-
late nitrogen is not a factor, because the TSS content of the
incoming water is very low (1.2 mg/L). The data combine
to produce a TN inlet loading of 11.3 gN/m
2
·yr, appor-
tioned across the species as indicated in Figure 9.13. This is
much less than the required nitrogen for even modest plant
growth, indicating that the vegetative cycle must draw upon
internal sources of nitrogen. There was net removal of all
forms of nitrogen, summing to a 70% reduction in the load
of TN. The inlet–outlet concentration reduction was less,
55%, because it does not include the contribution of rainfall
nitrogen.
Since measurements were not made of vegetative nitro-
gen processes, assumptions must be made. The wetland was
moderately well vegetated, with some open water, leading to
the assumption of an annual productivity of 1,000 g dw/m
2
·yr
with an assumed nitrogen content of 2%. Of this, 10% was
assumed to be buried as new sediments (Table 9.8B). Both
nitrate and ammonia were presumed to be used to support
growth, in proportion to their availability in the water. Aver-
age concentrations were used to determine the uptake ratio,
although selective spatial utilization may have occurred.
This information is adequate to calculate all the aver-
age annual transfers within the wetland via mass balances.
The pattern of nitrogen transfers is dominated by the veg-
etative cycle (Figure 9.13). Production of ammonia from
decomposition of biomass is eight times higher (20.65 gN/
m
2
·yr) than the reduction in ammonia in the water from
inlet to outlet (2.64 gN/m
2
·yr). Nitritation is seven times
higher than the reduction in the owing ammonia load
(11.32 versus 1.57 gN/m
2
·yr), and that high internal load
of nitrite is subsequently nitried to nitrate. Some nitrate
is lost through denitrication, but more is used to support
TABLE 9.8B
Assumptions for the Orlando Easterly Wetland Carbon and Oxygen Supplies
Assumption Notes
Biomass produced
1,000
g dm/m
2
∙yr
—
Carbon content
0.5 — 50%
Useable carbon fraction
0.3 — 30%
Carbon available
150
g/m
2
∙yr
—
Denitrication carbon requirement
140
g/m
2
∙yr
1.07 r N
Biomass N uptake
20
g/m
2
∙yr
2% N
Biomass buried
100
g dw/m
2
∙yr
10%
Nitrogen buried
2.0
g/m
2
∙yr
2% N
Oxygen needed
36
g/m
2
∙yr
3.43 r nitritation 1.14 r nitrication, plus DO increase
Daily oxygen needed
0.16
g/m
2
∙d
—
Note: Biomass is the assumed source of carbon, and oxygen requirements are determined from Figure
9.14 uxes.
TABLE 9.8A
Average Inlet and Outlet Concentrations for the Orlando Easterly, Florida, FWS Wetland for 1993–2002
Parameter
Inlet
(mg/L)
Outlet
(mg/L)
Mean
(mg/L) Fraction
Assumed Rain
(mg/L)
HLR, cm/d 1.17 1.15 — — 0.41
Organic N 1.67 0.98 1.32 — 1.0
Ammonia N 0.33 0.14 0.23 0.545 0.5
Nitrite N 0.60 0.04 0.32 — —
Nitrate N 0.26 0.13 0.19 0.455 0.5
TSS 1.2 4.0 — — —
CBOD
5
2.0 2.6 — — —
DO 6.1 8.9 — — —
Alkalinity 94 92 — — —
Source: City of Orlando operating data.
© 2009 by Taylor & Francis Group, LLC