Natural Hazards Analysis - Chapter 4 doc
Bạn đang xem bản rút gọn của tài liệu. Xem và tải ngay bản đầy đủ của tài liệu tại đây (827.44 KB, 20 trang )
© 2009 by Taylor & Francis Group, LLC
87
4Chapter
Spatial Analysis
Objectives
e study of this chapter will enable you to:
1. Define spatial analysis and explain how we use this tool in hazards analysis.
2. Explain the type of spatial analysis.
3. Describe how to visualize data using the results of spatial analysis.
Key Terms
Accuracy
Buffering
Choropleth maps
Error
Geospatial data
Hydraulic analysis
Hydrologic data
Hypothesis
Metadata
Precision
Reliability
Spatial analysis
Statistical analysis
Transformations
© 2009 by Taylor & Francis Group, LLC
88 Natural Hazards Analysis: Reducing the Impact of Disasters
Issue
What tools are available to examine the spatial and temporal nature of hazards and
their impacts?
Introduction
Dr. John Snow unraveled the causes of cholera in the mid-ninth century in London
by recording on a map the incidence of cholera. He was able to observe from his
map the relationship between a public water pump in the center of the cholera
outbreak. Although his use of maps to track the cholera outbreak did not prove the
cause, it raised a question as to the relationship between drinking water and the
public health outbreak. Stronger evidence was obtained to confirm his contention
when the water supply was cut off and the outbreak subsided (Gilbert 1958).
is illustration provides several critical elements of the productive use of spa-
tial analysis in a hazards analysis. First, John Snow collected accurate health data
and made accurate georeference placement of this data on a map. He also noted on
his map other related items, such as the public water pump. e scale of the map
was of a small area within London and provided an appropriate scale in which to
test his hypothesis. More importantly, Snow simply used his analysis of spatial data
to raise a hypothesis that had to be further studied or tested. He thus limited the
use of the information from his analysis and had a sound basis for choosing his data
sources and how he would use this data in forming a hypothesis. His methodology
was goal directed and determined the scope of his analysis. e key to spatial analy-
sis is clearly stating what we intend to accomplish and determining a methodology
that is suitable to achieve the desired results.
Definition of Spatial Analysis
Spatial analysis is a set of tools and methods that are used to examine the relation-
ships between social, cultural, economic, ecological, and constructed phenomena.
For our purpose in examining hazards and their impacts, spatial analysis provides
a means of understanding the nature of hazards and their social, economic, or
ecological impacts. Spatial analysis is the center of how geographic information
systems are used in transforming and manipulating geographic data. It provides
the methods that are used to support organizational decision making by govern-
ment agencies, businesses. and nonprofits (Longley et al. 2005). e methods and
tools provided by spatial analysis thus give us a means of turning raw data such as
what John Snow collected, into useful information. In the case of understanding
natural hazards, we can enhance our understanding of the nature of hazards and
their impacts by using spatial analysis. e results of our analysis can also help us
© 2009 by Taylor & Francis Group, LLC
Spatial Analysis 89
to better communicate within organizations and with the public. Spatial analysis
adds meaning, content, and value to our quest to better understand hazards and
their impacts.
Spatial analysis is more than just a fast computer and expensive digital data. It
is the formation of a hypothesis and the use of geospatial data in expanding our
understanding of how the physical environment interfaces with our social, eco-
nomic, and natural environments. Statistical methods are used in our analytical
methods, but spatial analysis is much more that just crunching numbers. rough
spatial analysis, we are able to reveal patterns and processes that otherwise might
not have been observed and confirm or disprove our hazard-related hypothesis.
Fisher notes that spatial data analytical techniques perform a variety of func-
tions within a geographic information system (GIS) and are important for the
types of questions and concerns that policy makers address in private, public, and
nonprofit organizations (1996). He further stresses that using geographic spatial
relationships provides a very good framework for understanding the meaning of
data within a GIS. Spatial analysis evolved in the early 1960s as part of quantitative
geography and the application of statistical processes in examining spatial relation-
ships of points, lines, and area surfaces. A spatial temporal perspective was added to
allow us to examine these relationships over time.
Geospatial Data Set
Geospatial data relating to hazards comes in many forms and enables us to charac-
terize both the nature and extent of the hazard event and the many elements that
help shape or characterize the hazard.
For flooding events, we need high-resolution elevation data to describe the broad
geographic area that makes up a river basin, subbasin, or drainage area. Further,
we need to characterize the size and shape of water features that make up the river
basin and characterize over time the amount of water at any given time in the water
feature (discharge). Other factors that influence flooding in a river basin include
the amount of impermeable services (paved roads or parking lots and residential
structures, commercial buildings, or industrial sites). Flooding threats in a river
basin may change over time if property near water features is changed from a natu-
ral landscape to one that has new subdivisions, commercial development, or major
changes in roads or parking lots. Rain may flow more quickly into a water feather
as a result of changes in the development of the landscape.
Riverine flood models use discharge values, soil types, and land-use and eleva-
tion data in characterizing flooding events in a river basin or drainage area. ese
flood-modeling programs utilize a variety of spatial analysis tools to determine the
nature and extent of a flooding event for a specific geographic area. e accuracy
of these data, which provide the input into the model, influences the validity of the
modeling outputs.
© 2009 by Taylor & Francis Group, LLC
90 Natural Hazards Analysis: Reducing the Impact of Disasters
Critical inking: Spatial analysis is dependent on the identification of accurate
timely data and appropriate tools for manipulating the data to ultimately show
where flood waters will go over time and the depth of the water in a spatial context.
e methodology that we establish must include the identification and selection of
an appropriate data set that can support the results of our analysis.
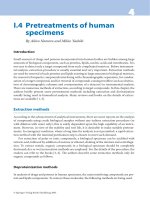
Riverine flood modeling addresses the question of just how deep the water will
be at a given time and location. e map shown in Figure
4.1 provides an illustra-
tion of the use of spatial analysis to show the anticipated depth of water for a 100-
year flooding event in a drainage area. e Hazards United States Multi Hazard
Flood (HAZUS-MH) Flood model developed by Federal Emergency Management
Agency (FEMA) provides the means of utilizing many types of data to characterize
riverine flooding events for a specific drainage area.
1. Hydrologic data determines just how much water may be in the water fea-
ture for a 100-year event, for example, for a water feature and drainage area.
Hydrology is the science that deals with the properties, distribution, dis-
charge, and circulation of water on the surface of the land, in the soil and
Study Region: East Baton Rouge and Livingston Parishes - Amite River
Study Case: 500-Ye ar Flood using HEC-RAS
Legend
500-Ye ar Flood
Value
300-meter DEM
Value
(c) 1997–2003 FEMA.
0 1 2 4 6 8
Kilometers
High: 32
High: 27.628805
Roads
Interstate
Water Features
Low: - 1.86
Low: – 1.86
Figure 4.1 (See color insert following page 142.) Riverine flood modeling results
within HAZUS-MH Flood.
© 2009 by Taylor & Francis Group, LLC
Spatial Analysis 91
underlying rocks, and in the atmosphere. It also refers to the flow and behav-
ior of rivers and streams.
2. Hydraulic analysis determines flood elevations for a specific flooding event at
a location on a water feature. Hydraulic data thus reflects anticipated areas
to be flooded and the depth of flooding. ese calculations are determined
by comparing the “modeled” flood elevations along a water feature with land
contours (Digital Elevation Model [DEM] land elevations). A hydraulic model
such as HEC-RAS is used by FEMA and the U.S. Army Corps of Engineers
to prepare community flood maps for the National Flood Insurance Program
(NFIP). How will the water move and flow in the drainage area? What will
be the depth of the water?
3. High-resolution land contour data is obtained from remote sensing tools such
as light detection and ranging (LIDAR) flow by either fixed-wing aircraft or
helicopters.
4. Spatial modeling tools such as HEC-RAS calculate the depth of water along
the water feature. GIS tools depth would need to be calculated on the banks
of the water feature and in the deepest areas of the water bed.
5. Location of bridges or culverts that might limit or constrict the flow of
the water.
Hurricanes Katrina and Rita provided a unique opportunity for researchers
to have access to a large collection of hazard-related data. e Katrina and Rita
Geospatial Data Clearinghouse houses numerous data sets that can be used to gain
a better understanding of the nature of these two hurricanes and their environ-
mental, social, economic, and physical impacts. Included in the clearinghouse are
extensive collections of digital remote sensing data including:
1. High-resolution commercial and government remote-sensing photos of impacted
areas a few days following the landfall of each storm (resolution 1:6 inches).
2. Satellite radar data from Radarsat allow users to identify areas that experienced
flooding or environmental contamination from oil storage or platform spills.
3. Aircraft LIDAR high-resolution landscape elevation data in coastal areas that
allow for examination of land loss issues associated with coastal storms.
4. Moderate resolution imaging spectroradiometer (MODIS) and LANDSAT
satellite data that allow for an assessment of land use changes in coastal
areas.
For further information on data available from the Katrina and Rita Geospatial
Clearinghouse see .
© 2009 by Taylor & Francis Group, LLC
92 Natural Hazards Analysis: Reducing the Impact of Disasters
Spatial Data Quality
We should acknowledge that any data set will not be 100 percent accurate. Errors
and uncertainty are inherent in any data set or information system (Openshaw and
Clarke 1996) and should be acknowledged as part of the hazards analysis process.
Critical inking: To what degree does our data set accurately represent our
environment (social, economic, ecological, and built)? Understanding the limita-
tions of the data set is critical in formulating a sound methodology for our hazards
analysis. What special problems are present in data sets? How does the availability
of data influence our methodology that we use in our hazards analysis?
Many users of hazards analysis inherently trust computer outputs, especially in
a complex environmental hazards analysis. We should acknowledge that the com-
puter model is just a tool that includes assumptions about the environment and the
relationships between its variables. We should be very clear as to the limitations of
the data inputs and the assumptions that the model makes in simulating a complex
environmental hazard.
ose that use the outputs from a hazards analysis that are from nonspatial
disciplines need to appreciate the uncertainly that is inherent in spatial data sets
and the consequences of using these data sets in our analysis. ere are clear limita-
tions in any data set used in a hazards analysis; clearly expressing these limitations
is critical for an appropriate application of the hazards analysis outputs in decision
making. Goodchild (1993) stresses that GIS layers have inherent errors that may be
obvious to GIS specialists but not understood or appreciated by those from other
disciplines. e key is that one should not ignore inherent errors that are just part
of a geospatial dataset. Errors may occur in either the source of the data or in the
processing steps of the GIS.
Hazards analysis combines the use of GIS (including spatial analysis), envi-
ronmental modeling, and remote-sensing data sets. e linkages and integration
between them are evolving, and weaknesses exist. Clarifying how these tools have
been integrated must be explained in our methodology for a hazards analysis.
Data is collected within a specific context. Metadata files associated with a data
set describe the process of the data collection, the purpose of the data set, time lines
for data collection, processing, assessment, and distribution. Understanding why
and how the data was collected must be part of the methodology for our hazards
analysis. Any conflicts that are identified with the scope and purpose of the data set
and our use of the data must be explained.
We stress that our spatial analysis approach or methodology must include an
examination of our metadata files, which document, who established the data set,
when, the intended use, and date of outputs, but which rarely address the accuracy
of the dataset. e metadata will provide us the information to explain why our
selected data is suitable for what we hope to accomplish in our hazards analysis.
© 2009 by Taylor & Francis Group, LLC
Spatial Analysis 93
is may be because it is just too costly to assess the spatial error in the data or
because of the complexity of completing such an assessment.
Key terms that help us understand spatial data quality include error, accuracy,
precision, and reliability. Error is any deviation of an observation and computation
from what exists or what is perceived as truth (Brimicombe 2003). Accuracy is
the degree of fit between our observation or computation with reality. Precision is
the degree of consistency between our observations and what exists in the natural,
social, or built environments. Reliability involves our confidence in the fit between
our data and our intended application of the data in the hazards analysis process.
For our purposes, the persons responsible for establishing a methodology for a haz-
ards analysis has the responsibility to articulate what data sets are being used in
our analysis and why we believe they are appropriate for our use. Our judgment
as to the reliability of the data sets is critical in ensuring that users of the hazards
analysis have confidence that their decisions are sound and can be supported by our
methodology. Uncertainty is an inherent element of the hazards analysis process
from the ways that we obtain data sets, use them, store and manipulate them, and
present the results of our analysis as information in support of organizational deci-
sions. e outputs from our hazards analysis are thus dependent on data quality
and model quality (including any spatial, statistical, or GIS tools that we utilize)
(Burrough et al. 1996).
A few illustrations can help demonstrate the importance of understanding the
purpose of and intended use of a dataset, who collected it, when it was collected,
and how and when it was disseminated. Many community and organizational haz-
ards analysis utilize Census Bureau road, water feature, community boundary, and
point files. e Census Bureau obtained these critical community files from the
U.S. Geological Survey and added critical data to the lines (roads, rail lines, and
water features), points (community features, such as schools, churches, or pub-
lic buildings), and polygons (lakes and political boundaries). e Census Bureau
has over many years made changes to these files to more accurately reflect what
exists throughout the United States. A process of involving community partners in
updating these files has resulted in very accurate data sets for some communities.
e Census Bureau has obtained from many local communities’ updated road
files, school, medical facilities and church locations, and political boundaries. e
names and addresses of schools, medical facilities, and churches may have changed
over the past fifty years and new road features added in a community. Many local
governmental emergency communication districts have taken the Census Bureau
road files and aligned them over very high-resolution digital images of their com-
munity. For many communities, high-resolution images of a half-foot resolution
provide a basis for ensuring that a road feature or a school location is highly accu-
rate. Prior to these corrections being made, the Census Bureau map files so often
used in a hazards analysis have extensive errors in the name of a specific feature
and its location. It is not uncommon that a road or other feature may be off by
as much as 100 feet when observed on a high-resolution image of a community.
© 2009 by Taylor & Francis Group, LLC
94 Natural Hazards Analysis: Reducing the Impact of Disasters
Unfortunately, easy-to-use GIS programs were not available to local communities
when the Census Bureau created the map files that have been used as part of the
Centennial Census. Errors thus could be present either in geographic representa-
tion of the object or because of errors in the attributes reflected in the data (i.e., the
road name or feature name is incorrect).
We should not avoid using Census Bureau map files in our hazards analysis,
but insist that the metadata be reviewed and that any errors inherent in the road or
water feature files be fully understood and explained in our methodology used in
the hazards analysis.
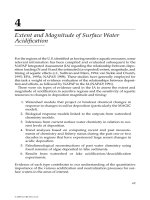
Figure
4.2 provides a comparison between common community road files
obtained and edited road files over a high-resolution image. e image was taken
after Hurricane Katrina in January 2006. ese road files had been edited by the
New Orleans Regional Planning Commission GIS unit for the City of New Orleans
Planning Department years before Hurricane Katrina struck south Louisiana.
ese edited street files have been a long-standing asset to local and regional haz-
ards analysis efforts in the public, private, and nonprofit sectors in the New Orleans
area. e unedited Census road files on the left are the type of road files that are
available from many sources that are commonly used by local jurisdictions as part
of their base map. e edited files have been corrected using high-resolution images
such as the ones above. ey provide a highly accurate basis for spatial analysis.
High-resolution photos were not available when the United States Geological
Survey (USGS) created the road and street files that were later used by the Census
Bureau as a guide for census workers to navigate local communities. Many com-
munities have edited the Census road and street files so that they more accurately
reflect the local landscape when imposed over high-resolution images. Users of data
such as Census road files must appreciate the errors that exist in the files and if they
are an appropriate basis for analysis of hazards at the community level.
New Orleans High Resolution Image
with Census Roads
New Orleans High Resolution Image
with Edited Roads
Figure 4.2 (See color insert following page 142.) Comparison of Census Bureau
road files and edited files. High resolution image provided by NOAA (2005).
© 2009 by Taylor & Francis Group, LLC
Spatial Analysis 95
Critical inking: If a local community was utilizing unedited Census road and
street files along with Census population data at the block or block group resolu-
tion, could the data sets be used without potential errors distorting the results of
the analysis?
Many errors that are inherent in data sets used in a hazards analysis occur
because of changes over time. Changes in water features, land use, or landscapes
may occur naturally or because of human interventions. We must examine any data
set that is part of our hazards analysis to understand if changes have occurred and
that these are noted in our methodology.
It should be noted here, as we discuss data quality, that modelers assess the
quality of their outputs by comparing the results of simulated disasters with actual
events. e National Weather Service (NWS) has customarily compared model
results from hurricanes with weather data from sensors in coastal environments.
ese comparative studies provide the basis for adapting hurricane models and
improve their predictive capacity for future storms. Post-Rita and Katrina storm
surge measurements in 2005 provided modelers running the Advanced Circulation
Model for Coastal Ocean Hydrodynamics (ADCIRC) hurricane model with
invaluable measurements to compare simulated surge heights at specific locations
with actual storm surge heights in coastal Mississippi and Louisiana.
Types of Spatial Analysis
Queries
How many people, commercial businesses, or residential homes might be impacted
by a flood or storm surge? How many roads or bridges are in the area with the deep-
est flooding? How many structures are in the high-wind zone of a hurricane? How
many renters or homeowners may be displaced by a flooding event? What is the
average income of population of a community directly impacted by a hurricane?
How many employees are affected by businesses in a flood zone?
Spatial analysis can address the question of access to major transportation
routes by renters, households below the poverty level, households with no auto-
mobiles and access to public transportation routes, or households and shelters with
handicapped individuals over the age of 65. Spatial analysis provides a means of
comparing renters and homeowners and access to evacuation routes, evacuation
access points, or shelters. Figure
4.3 shows the percent of renters by census-block-
group level in New Orleans. e analysis could help determine if renters might
be more vulnerable than homeowners if an evacuation was ordered. Further, the
analysis would be able to show which block group areas for either renters or hom-
eowners are at higher risk by living further from an evacuation route, pick-up
point, or shelter. With this information, emergency management staff could target
© 2009 by Taylor & Francis Group, LLC
96 Natural Hazards Analysis: Reducing the Impact of Disasters
specific areas of the community for a contingency plan to ensure that all residents
would be safe in an emergency.
Measurements
Hurricane Katrina flooded many communities in the greater New Orleans area.
What was the area flooded in the City of New Orleans? How did this change as
rescue efforts progressed and pumps were used to remove the water? What is the
average residential parcel or lot size in flood areas of the city? Using land-use clas-
sification data for the City of New Orleans, how much commercial or industrial
property was flooded? How much public property for parks and open space was
flooded? How much of the city’s poor neighborhoods were flooded as compared to
more wealthy areas?
With the flood depth grid shown in Figure
4.4 for the City of New Orleans
during Hurricane Katrina, one could use spatial analysis to determine if a higher
percentage of households in flooded areas had incomes below the poverty level, had
no access to an automobile, were handicapped, were renters, or had a single head of
household with children below the age of 18. Pedro (2006) examined these ques-
tions in her Master of Science thesis, using the flood depth levels from a hurricane
Legend
Percent of Renters
(c) 1997–2003 FEMA.
N
W
E
S
4 2 0 4 Kilometers
Interstate HWY
Water Features
0.00–0.18
0.19–0.40
0.41–0.58
0.59–0.77
0.78–1.00
Figure 4.3 (See color insert following page 142.) Percent of renters for the City
of New Orleans at the census-block-group level. Background image provided by
the City of New Orleans.
© 2009 by Taylor & Francis Group, LLC
Spatial Analysis 97
simulation for 2005, and determined that there were no differences between house-
holds on these characteristics when comparing flooded and nonflooded areas of the
City of New Orleans. She also addressed the hypothesis that the simulated flooding
did not have a disproportionate impact on the percentage of households in census
block groups who were African American, below the poverty level, renters, or who
did not have an automobile. With this analysis, she was able to pinpoint areas of
the City of New Orleans in which the depth of flooding might be very high and a
greater percentage of residents would not have access to an automobile, were below
the poverty level, and had a single head of household with children under the age
of 18.
Spatial analysis provides us with a set of tools with which we can explore ques-
tions about potential vulnerability to and damage from hazards. It can provide
information that can be used to take precautionary measures or to further explore
if some neighborhoods were more vulnerable than others and if assistance with
evacuations or sheltering was needed.
Transformations
ese analysis tools allow the user to transform GIS data sets to reveal relationships
and dynamics of the physical environment. Examples include buffering a point,
line, or area to highlight potential change. If a new school were to be built in a
Interstates
High: 13.49
Low: 0.00
N
E
S
W
0 0.45 0.9 1.8 2.7 3.6
Miles
Figure 4.4 City of New Orleans flooding following Hurricane Katrina (NOAA
figures).
© 2009 by Taylor & Francis Group, LLC
98 Natural Hazards Analysis: Reducing the Impact of Disasters
specific location, what is the population in a two-mile area? If a commercial area
were to be flooded, what other enterprises in a three-mile area could handle the
additional business? If a rail line was damaged as a result of an earthquake, how
many industrial enterprises within a ten-mile area could be impacted?
Buffering
Buffering was used by Pine et al. (2002) to determine if African Americans were
in closer proximity to thirteen large chemical processing sites in Iberville Parish in
Louisiana. e question centered on whether African American residents were not
closer to chemical processing operations than non-African Americans. e buf-
fer zones were determined using dispersion modeling programs from the thirteen
sites, and the number of African Americans was calculated for each risk zone from
Census 2000 data. e buffering spatial analysis tool was helpful in examining
claims of disparate impact of chemical releases for African Americans in a com-
munity. e study showed that African Americans did have a greater chance of liv-
ing closer to one of the thirteen chemical processing operations than non-African
American residents (Figure 4.5).
Legend
Railroads
Interstate
Earhart Ave
Streets
Zone 1 Resp.
Zone 2 Resp.
Zone 3 Resp.
Zone 2
Zone 1
Zone 3
0 0.15 0.3 0.6 0.9 1.2
Miles
N
E
S
W
Figure 4.5 Race and distance.
© 2009 by Taylor & Francis Group, LLC
Spatial Analysis 99
Spatial interpolation is used to help estimate potential flooding along a water
feature where hydrologic modeling programs determine the depth and extent of
flooding at various locations along a stream, bayou, or river. Riverine flood models
utilize precise elevation measurements along water features as part of the flooding
program. Spatial interpolation is used to estimate the depth and extent of flood-
ing between survey points. Many hydrological flooding efforts include field survey
cross sections along water features as a basis for determining flood depths. e
depth of flooding between the cross sections is interpolated spatially. e model
thus produces a smooth flood zone and depth of flooding for the area impacted
using this spatial analysis tool.
Descriptive Summaries
Data sets that reflect unique elements of a disaster provide opportunities for under-
standing potential relationships between a disaster and associated human charac-
teristics. Following Hurricane Katrina, 911 emergency calls at point locations were
examined to see if the calls were clustered in some way to suggest the basis of the
emergency call. e issue centered on whether there was a relationship between
clusters of 911 emergency calls and water depth and selected social characteristics.
Spatial analysis was used to identify hot spots areas where there was a high number
of emergency calls for assistance. Further analysis examined the depth of the water
at these hot spots and social characteristics of the census tract.
Optimization Techniques
Spatial analysis is also used in site selection and transportation routing to help
locate the ideal setting for an emergency shelter, medical clinic, or police substa-
tion, or the shortest evacuation route of multilane roads and highways. Evacuation
routes that are scenario specific can be developed to aid community planners in
evacuating large populations from a metropolitan area. State departments of trans-
portation have used these tools to mark major evacuation routes as aids to move
citizens from vulnerable areas due to hurricanes, earthquakes, or riverine flooding.
Hypothesis Testing
is type of spatial analysis was used in New Orleans to anticipate the rate of return
to specific neighborhoods following the flooding from Hurricane Katrina. A statis-
tically valid sample of household surveys was conducted to determine the family’s
capacity and willingness to return to the city after their residence had been flooded.
e address of the respondent was obtained in the survey along with the resident’s
perception of the level of damage to their home and neighborhood. Independent
surveys of residential structures conducted by FEMA, the City of New Orleans,
and the Louisiana Road Home Program provided an independent perspective on
© 2009 by Taylor & Francis Group, LLC
100 Natural Hazards Analysis: Reducing the Impact of Disasters
individual property damage. Household sentiment to return was then compared to
their perception of the level of damage to their home and the independent property
damage assessment. Spatial analysis was utilized to use the results of the surveys to
infer if other residents would return in a given time period. is type of analysis
provided a basis for testing a set of hypotheses relating to the willingness to return
to a specific structure or neighborhood.
Spatial analysis was used to examine a hypothesis concerning social vulner-
ability and flood depth following Hurricane Katrina. e question centered on an
association between risk zones measured by depth of flood waters and social vulner-
ability. is study, which is under review for publication, examined the relation-
ship between risk (i.e., flood depth) and social population characteristics, including
race, income, disability, home ownership, single family member and head of house-
hold, and household access to an automobile. e analysis revealed that African
Americans had the strongest association with deeper flood waters when compared
with other populations characteristic for the Orleans Parish. e results of the
analysis is being used by City of New Orleans emergency management officials to
identify neighborhoods that are highly vulnerable to future flooding, and family
evacuation plans are prepared in advance of coastal storms.
Since two different data sets were used in the study, one had to be converted to a
common type and scale. Flood depth values from a grid file were selected and then
averaged for each census block group. Since land elevations in New Orleans varied
only slightly within a block group, this conversion produced good flood estimates
for each block group. It is critical that the methodology used in a hazards analysis
fully explore any potential problems with geospatial data that is utilized and explain
the source of any data and how it may have been adapted for the spatial analysis.
Spatial Data Visualization
A critical part of the hazards analysis process is displaying the results on our analy-
sis. Hazards are geospatially oriented, and thus being able to show the results of
our analysis is a key element in supporting individual, organizational, and com-
munity decision making. Whether the results of our analysis comes from a model-
ing program such as HAZUS-MH, earthquake, flood, coastal hazards, or Areal
Locations of Hazardous Atmospheres (ALOHA), displaying geospatial data is a
critical means of conveying information to users of our final hazards analysis or as
we work with the data using spatial analysis techniques. Spatial data is meant to be
viewed as maps, and a GIS allows us to interactively change these maps to help us
reveal information from the landscape in a variety of ways. We can add different
spatial layers, such as where people live, transportation routes, quarantine areas,
key facilities, or infrastructure, and display them over high-resolution images of a
community.
© 2009 by Taylor & Francis Group, LLC
Spatial Analysis 101
Visualization of the results of a hazards analysis and the use of spatial analysis
and mapping tools can help us to:
1. Identify patterns within complex data sets or multiple data sets of related data.
2. Make sense of large data sets.
3. Appreciate that local geospatial features change over time.
4. Appreciate that geospatial features may be similar, or interact more frequently,
within smaller geographic scales.
5. Provide a means of conveying complex information without oversimplifica-
tion of the data.
6. Give an Emergency Operations Center (EOC) at a local, state, or regional level
critical information on the nature of hazards and their potential impacts.
Both Figure
4.3 and Figure 4.4 offer illustrations of how we visualize hazard vul-
nerability in a simulation or exercise or an actual disaster response. In an examination
of the map of the City of New Orleans in Figure 4.3, one sees that there is great varia-
tion in the percentage of the population that are renters. Two patterns may be seen
to suggest that the higher percentage of census block groups are in the central and
midcity neighborhoods, while those areas on the urban fringe of New Orleans have
the lowest percentage of renters. A test of this theory and the association between
income and percent of renters can be determined quantitatively using spatial analy-
sis. Maps as in Figure
4.4 provide us with a broad view of the community and a basis
for forming our hypothesis, which may be tested using spatial analysis.
Additional hypotheses could be identified, using broad views of the community,
raising questions as to the relationship between ground elevation and household
income, the relationship between major transportation routes and rental housing,
or the association between housing values and community recreation areas (parks).
A look at Figure
4.3 shows that City Park is located in the top of the image and
that limited rental units are available near the community recreation area. A spatial
analysis could address the hypothesis to determine if there is a clear association
between large community recreation areas and block groups with low percentages
of households of renters.
Figure
4.4 was used extensively by emergency responders at the local, state,
and federal level following the flooding from Hurricane Katrina. As water depth
changed as the pumping process was underway, one could provide information
to emergency responders on major transportation routes and flood depth. Spatial
analysis was used to determine the best rescue routes throughout New Orleans.
For any hazard, there is both a spatial and temporal dimension. e spatial
dimension has various scales (local to international) depending on what the hazard
is. e temporal dimension also has multiple scales (minutes to months).
Mapping data related to a hazard utilizes many different data sets and types of
mapping data including photographs, USGS quad sheets showing graphic represen-
tation of areas, and vector representations of roads (lines), buildings (points), and
© 2009 by Taylor & Francis Group, LLC
102 Natural Hazards Analysis: Reducing the Impact of Disasters
county or city boundaries (polygons). What are the best ways to show hazards from
wind, flooding, storm surge, earthquake, landslide, drought, or other disaster?
Every map is a graphic representation or a model of reality or milieu:
1. A map may represent economic or cultural features, such as neighborhoods
or citizen sentiment, settlement patterns, and political–administrative
boundaries.
2. A map represents physical features, such as elevation, water features, and
land cover.
A map can also display mental abstractions that are not physically present on
the geographical landscape. For example, we can map people’s attitudes, quality of
life, or citizen sentiment for or against gun control.
Choropleth Maps
A choropleth map is defined by the International Cartographic Association (ICA)
as “a method of cartographic representation, which employs distinctive color or
shading to areas other than the feature boundaries. ese are usually statistical or
administrative areas.” Making a choropleth map starts with the collection of data by
a specific geographic area. An areal symbolization scheme is then devised for these
values, and the symbols are applied to those areas on the map whose data fall into the
symbol classes. e selection of symbol classes is based on a classification method.
It is important that choropleth maps show relative data in contrast to absolute
data. Relative data includes densities (e.g., population density—people per square
mile), percentages (e.g., percent of people 65 years and older), and rates (e.g., num-
ber of homicides per 100,000 people). e following three decisions have to be
made when compiling any choropleth map:
1. Number of classes. A trade-off exists between too many and too few classes.
Too many classes make the choropleth map too complex and difficult to per-
ceive and to understand by the map reader. Too few classes results in too
much information loss.
2. Type of classification method. is includes equal steps, which could be inter-
vals such as 0–10, >10–20, >20–30, etc. A second one involves natural breaks
in the data, which are reflected in the sorted data. Quantiles could be used
as a classification method using equal number of observations in each class.
Finally, standard deviation can be used, which includes the average deviation
of the data values from the mean (average) of the data set. is approach
measures the variability in the data and is a good relative measurement tool.
3. Color or areal symbolization scheme. is can be used to simply show the
different areas (zip codes, incorporated areas, or districts) in various colors.
© 2009 by Taylor & Francis Group, LLC
Spatial Analysis 103
Critical inking: Figure 4.6 provides an example of how we can display the
same information using different classification methods. e maps show that the
manner in which we view the data will influence the conclusions that we draw.
Which of the four maps provide the best spatial and temporal perspectives?
An example of a proportional symbol map is the common dot map. Common
dot mapping involves the selection of an appropriate point symbol to represent
each discrete element of a geographically distributed phenomenon. e symbol
form does not change, but its number changes from place to place in proportion to
the number of objects being represented. Design decisions involve the placement
of dots and the selection of dot value and dot size. Figure
4.7 shows data in a juris-
diction that could have resulted from an analysis of spatial data. e dot symbols
reflect data for a specific geographic boundary.
A proportional symbol map uses a form (circle, square, or triangle) and varies
its size from place to place, in proportion to the quantities it represents. Map read-
ers can form a picture of the quantitative distribution by examining the pattern of
differently sized symbols. Proportional point symbol mapping is selected when data
occur at points or when data is aggregated at points representing areas as illustrated
in Figure
4.7.
Data Mapped with Four Different
Classification Methods (6 Classes)
64–1212
>1212–2359
>2359–3507
>3507–4655
>4655–5802
>5802–6950
64–736
1041–4043
>4043–4368
>4368–4814
>4814–6168
6950
64–612
>612–1475
>1475–2476
>2476–3169
>3169–4031
>4031–6950
–2––1 Std. Dev.
>1–0 Std. Dev.
>0–1 Std. Dev.
>1–2 Std. Dev.
>2–3 Std. Dev.
Equal steps
Natural breaks
Quantiles (Sixtiles) Standard deviations
Figure 4.6 (See color insert following page 142.) Visualization of data using dif-
ferent classification methods.
© 2009 by Taylor & Francis Group, LLC
104 Natural Hazards Analysis: Reducing the Impact of Disasters
Conclusions
Brimicombe (2003) stresses that suitability of a dataset for our use in a hazards
analysis centers on its “fitness for use.” Rather than focus on errors, he encourages us
to view our use of data in a wider examination of uncertainty. We should examine
the quality of the data, but explain that the dataset is an appropriate application for
our use. We thus examine the quality of the dataset and how we plan on using the
data in our methodology or our approach to spatial analysis and our overall hazards
analysis. In the end we want to ensure that our data fits our methodology and is an
appropriate use of the dataset in our analysis. A fitness-for-use test thus includes an
evaluation of the data quality and an explanation of any limitations of the data as
it is used in our hazard models or spatial analysis techniques. e key is that this is
a managed process that accounts for limitations in our data. Our methodology in
completing the hazards analysis should clearly explain the steps that we are taking in
the spatial analysis, including the source of our data and our analysis of this data.
We stress that our methodology must include an examination of our metadata files,
which document who established the data set, when, the intended use, and date of
outputs, but rarely address the accuracy of the dataset. e metadata will provide us the
information to explain why our selected data is suitable for what we hope to accomplish
Shelter Capacity
South Louisiana Parishes
Legend
Shelter Capacity
10
50
100
250
500
1,000
Parishes
Parishes
Interstate
Interstate
Water Bodies
Water Bodies
(c) 1997–2003 FEMA.
N
S
W
0510203040
Miles
E
Figure 4.7 (See color insert following page 142.) Use of proportional symbols in
mapping data.
© 2009 by Taylor & Francis Group, LLC
Spatial Analysis 105
in our hazards analysis. is may be because it is just too costly to assess the spatial error
in the data or because of the complexity of completing such an assessment.
Discussion Questions
Many efforts to examine environmental hazards require the use of digital eleva-
tion map data (DEM). e USGS has published for many years DEM data
for the United States in different scales (1:30 meters or 1:20 meters). More
recently, many state and federal agencies have created higher-resolution DEM
data using LIDAR remote-sensing technology (1:5-meter resolution). What
difference does using the higher-resolution DEM make for an environmental
hazards analysis?
Given that any dataset will not be 100% accurate, why is it so important that
errors be examined and explained in a hazards analysis?
What do the terms error, accuracy, precision, and reliability mean, and why are
they so critical to the use of data in a hazards analysis?
How might the results of a spatial analysis be visualized to communicate infor-
mation that can help us to understand the outputs of a hazards analysis?
Applications
Metadata provides information about a geospatial data set to guide the user in
determining how best to utilize the data in a hazards analysis or other application.
Metadata files are provided for many data sets as illustrated by the Atlas Internet
site at Louisiana State University (). Go to this site, select the
LIDAR data set, and download for any geographic area of the state one metadata
file. Read the file and determine how the data was obtained, who collected the
data, when was it collected and made available to the public, what the resolution
of the data is, and what the intended purpose of the data is. e file notes that no
data quality tests were performed on this data. What might that mean to the user
of the data?
Ask students to use any disaster data and visualize them with a proportional
point symbol map.
Map a disaster using a common dot map approach for the same study area, but
using different dot sizes and dot values, and observe the differences between the dif-
ferent dot maps. Use any mapping or GIS software package to perform this exercise.
Web Sites
FedStats. Federal Statistics. />© 2009 by Taylor & Francis Group, LLC
106 Natural Hazards Analysis: Reducing the Impact of Disasters
Geodata.gov. GOS—Geospatial One Stop. />U.S. Census Bureau. TIGER/Line shapefiles. />html
References
Brimicombe, A. (2003). GIS, Environmental Modeling and Engineering. Taylor and
Francis. London.
Burrough, P. A. and A. U. Frank, eds. (1996). Geographical Objects with Indeterminate
Boundaries. Taylor and Francis, London.
Fischer, M. M., H. J. Scholten, and D. Unwin, eds. (1996). Spatial Analytical Perspectives on
GIS. Taylor and Francis, London.
Gilbert, E. W. (1958). Pioneer maps of health and disease in England. Geographical Journal,
124:172–183.
Goodchild, M. F. (1993). Data models and data quality: problems and prospects. In
Environmental Modeling with GIS, eds. M. F. Goodchild, B. O. Parks, and L. T.
Steyaert. Oxford University Press, New York.
Longley, P. A., M. F. Goodchild, D. J. Maguire, and D. W. Rhind (2005). Geographic
Information Systems and Science, 2nd Edition. John Wiley and Sons, New York.
Openshaw, S. and G. Clarke (1996). Developing spatial analysis functions relevant to GIS
environments. In Spatial Analytical Perspectives on GIS, eds. M. Fischer, H. J. Scholten,
and D. Unwin. Taylor and Francis, London, 21–37.
Pedro, S. (2006). Delineating Hurricane Vulnerable Populations in Orleans Parish, Louisiana.
esis for an M.S. degree, Louisiana State University.
Pine, J. C., B. D. Marx, and A. Lakshmanan (2002). An examination of accidental release
scenarios from chemical processing sites: the relation of race to distance. Social Sciences
Quarterly Special Environmental Justice Issue 83(1):317–331.