the university of Montana a Component unit of the state of Montana_part2 potx
Bạn đang xem bản rút gọn của tài liệu. Xem và tải ngay bản đầy đủ của tài liệu tại đây (708.85 KB, 11 trang )
A-5
>
Assets and liabilities presented in the financial statements are generally measured at current
value, although capital assets are stated at historical cost less accumulated depreciation.
>
Capital assets are classified as depreciable and non-depreciable. Depreciation is treated as an
operating expense.
>
Assets and liabilities are treated as current @ue within one year) or as non-current (Due in
more than one year), and are presented in the Statement of Net Assets in order of liquidity.
>
Revenues and expenses are classified as operating or non-operating.
"Operating" is defined
as resulting
from transactions involving exchanges of goods or services for payment, while
"non-operating" is defined as resulting from transactions not involving the exchange of goods
or services for payment. We show a substantial operating loss on the Statement of Revenues,
Expenses, and Changes in Net Assets primarily because GASB requires that General
Operating Fund expenses be reported as operating, while the State Appropriation
-
which is
General Operating Fund revenue
-
must be reported as non-operating.
>
Tuition and fees are reported net of any scholarships or fellowships that were applied directly
to a student's account. The reason for "netting" these is to keep the University financial
statements from "double counting" this revenue and expense.
STATEMENT
OF
NET ASSETS
The Statement of Net Assets reflects the financial position of the University at the end of the fiscal year.
The changes in net assets that occur over time indicate improvements or deterioration in the
University's financial position. A summary of the Statement of Net Assets follows:
For the years ended June
30,
(stated in millions)
Description
Total current assets
Total non-current assets
Total assets
Total current liabilities
Total non-current liabilities
Total Liabilities
Invested
in
Capital Assets, Net of Related
Debt
Restricted:
Nonexpendable
Expendable
Unrestricted
Total net assets
Total Liabilities and net assets
*Restated
This is trial version
www.adultpdf.com
A-6
Events or developments that occurred which had a significant impact on the Statement of Net Assets
include:
Events or developments which occurred durinp
2007:
P
Non current assets increased by $17.9 million primarily from additions to capital assets of
$30.0 million net of an increase to accumulated depreciation of $15.8 million.
A
$1.7 million
increase in the fair value of long term investments also contributed to the increase in non
current assets.
P
Non current liabilities decreased by $5.9 million due primarily to principal payments of $6.4
million on outstanding revenue bonds payable, notes payable and advances from primary
government. The University did not issue any additional long term debt during FY 07.
P
Net assets increased by $24.1 million due in part to a $5.6 million of state fbnding related to
the Donaldson Building addition on the Helena campus.
In
addition, investments increased
by $3.6 million, which included a $1.6 million federal endowment.
Events or developments which occurred during
2006:
P
Current assets increased by $21.4 million, with most of that change resulting from an increase
in cash and cash equivalents of $27.3 million. Most of the increase was from Series J 2005,
bond proceeds invested in highly liquid guaranteed investment contracts and will be used to
pay for several major capital projects.
P
Non current assets increased by $10.9 million primarily from additions to capital assets of
$25.9 million net of an increase to accumulated depreciation of $16.4 million.
P
Non current liabilities increased by $16.9 million due primarily to the issuance of Series J
2005 revenue bonds, which was offset by principal payments of $5.0 million related to
revenue bonds outstanding in
FY06.
P
Net assets of the University increased by $16.4 million due primarily to an increase in private
gifts income of $5.8 million associated with the construction of the Skaggs and Journalism
buildings on the Missoula campus and also, from an in increase in investments earnings.
STATEMENT
OF
REVENUES, EXPENSES,
AND
CHANGES
IN
NET ASSETS
The Statement of Revenues, Expenses, and Changes in Net Assets present the results of the
University's operational activities for the fiscal year, categorizing them as either operating or non-
operating items. Consistent with the accrual method of accounting, the current year's revenues and
expenses are recognized when they were earned or incurred, regardless of when cash was received or
paid.
A
summary of the Statement of Revenues, Expenses and Changes in Net Assets follows:
For the years ended June
30,
(stated in millions)
Description
Operating revenues
Operating expenses
Operating
loss
This is trial version
www.adultpdf.com
Non-operating revenues (expenses)
80.2 1
76.91 64.14
Income before other revenues
14.25
12.27 1.97
Other revenues
9.90 4.09
5.8 1
Net increase in net assets
24.15 16.36 7.78
Net assets, beginning of year, as adjusted
170.25
153.89 146.11
Net assets, end of year
$
194.40
$
170.25
$
153.89
*Restated
**
The amounts presented do not reflect a change in the classification of graduate teaching assistant fee
waivers to compensation and benefits, and the related effect of the reclassification on the amount of tuition
discounting. Had the
FY2005
amounts been adjusted to reflect the impact of this change, operating
revenues would increase by approximately
$2.7
million and operating expenses would increase by
$2.7
million.
The following provides a comparative analysis of revenues and expenses for the years ended June 30,
2007,2006, and 2005:
For the vears ended June
30.
(stated in millions)
REVENUES
2007
-
2006* 2005**
Amount Percent Amount Percent Amount Percent
Tuition and fees, net
Federal grants and contracts
State
&
local grantslcontracts
Nongovernmental grantslcontracts
Facilities and administrative cost
allowances
Saleslservices of educational
departments
Auxiliary enterprise charges
State appropriations
Investment income
Private gifts
Capital grants and gifts
All other sources combined
EXPENSES Amount Percent Amount Percent Amount Percent
Compensation and benefits
$
201.17 63.3%
$
189.61 62.8%
$
175.85 61.2%
Other operating expenses
76.08 23.9% 73.79 24.4% 72.73 25.4%
Scholarships and fellowships
16.36 5.2% 14.68 4.9% 15.70 5.3%
Depreciation and amortization
16.84 5.3% 16.7 1 5.5% 16.07 5.6%
Interest expense
7.44 2.3% 7.37 2.4% 6.60 2.5%
$
317.89 100.0%
$
302.16 100.0% $286.95 100.0%
*
Restated
**
The amounts presented do not reflect a change in the classification of graduate teaching assistant fee
waivers to compensation and benefits, and the related effect of the reclassification on the amount of tuition
discounting. Had the
FY2005
amounts been adjusted to reflect the impact of this change, tuition and fees,
net, would increase by approximately
$2.7
million, compensation and benefits would increase by
$3.3
million, and scholarships and fellowships would decrease by a net amount of
$638
thousand
This is trial version
www.adultpdf.com
Comments about specific revenue and expense items are:
Events or developments which occurred during 2007 include:
P Tuition and fees increased by almost $8.0 million, with approximately $6.4 million of the
increase attributable to higher tuition rates, and the remainder to higher enrollments in
FY07.
P
Grants and contract revenue from state, local and private funding sources, and facilities and
administrative cost allowances, increased by over $2.2 million. Funding for research from
federal sources continues to be difficult to obtain because of the federal government's war
effort in Iraq.
As
a result, funding from this source declined by almost $734 thousand in FY
07.
P
Sales and service revenue increased by almost $1.8 million over FY 06, with approximately
$1.0 million of the increase attributable to additional intercollegiate athletics event ticket
sales and game guarantees, and additional special event ticket sales.
An
increase in
educational department sales and service revenue accounts for most of the remaining
increase.
P
Investment earnings increased by over $2.8 million due largely to a $1.7 million fair value
increase in pooled equity investments. The investment earnings were also positively impacted
by the investment of over $17.1 million of unexpended bond proceeds in various interest
bearing investments throughout the year, as well as continued higher yields on the State's
Short Term Investment Pool (STIP). STIP rates averaged 4.25% in 2006 and 5.35% in 2007.
P
Capital grants and gifts increased by approximately $5.1 million due primarily to $5.6 million
of State
fimding received for the Donaldson Building addition on the Helena campus.
P Operating expenses increased by approximately $15.7 million due primarily to increases in
salaries and benefits, and supplies and other services of approximately $1 1.6 million and $1.9
million, respectively. Salary increases in FY 07 for classified staff and faculty were 3.6% and
3.0%, respectively. Employer contributions for employee benefits including health
insurance, increased by approximately 10% over FY 06.
Events or developments which occurred during 2006 include:
P Tuition and fees increased by nearly $4.9 million, with approximately $4.2 million of the
increase attributable to higher tuition rates, and the remainder to higher enrollments in
FY06.
P Federal grants and contracts revenue and facilities and administrative cost allowances
declined in total by over $1.6 million in
FY06, reflecting the difficulty in obtaining federal
funding. The University has put more effort in obtaining state and local contracts as a result,
and revenue from these sources increased by $2.5 million.
P State appropriation increased by $5.4 million, with about $4.5 million attributable to an
increase in funding to the Montana University System for the 2006-2007 Biennium, approved
by the 2005 state legislature. The remainder of the increase is from a special appropriation for
program development at our colleges of technology.
P
Private gifts increased by $5.8 million, with most of the increase from foundation donations
for several capital projects on the Missoula campus.
P Investment earnings increased by $2.6 million due to higher yields on interest bearing
investments, a fairly significant increase in fair value of pooled equity investments and the
investment of approximately $21 million of Series
J
bond proceeds, which were held in
various interest bearing investments during the year.
This is trial version
www.adultpdf.com
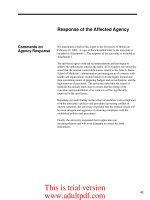
FY
2007
Revenues
by
Source
=
$342.04 Million
($
in Millions)
Sales
&
Services of
Investment Income
I
State
Grant
&
Contract
Appropriations
Activity $90.15
$63.45
Expenses
by
FunctionlPurpose
12007
02006
12065
I
I
I
I
I
I
I
I
I
I
I I
535.1
3
A~llriliary
Entaprlscs
W.50
91
lasfit~ltionrl
Snpport
1a.l"
S22.74
S22.62
Academic
Suppol
-
,149
9.1 3
I
92.05
Stndeat
Scrvlccs
I
$20.25
$1 9.21
1
516.84
Depredatior.
m::$?
I
10 20 30 40
50
60
70
80 90
100
(Stated
in
Millions)
This is trial version
www.adultpdf.com
The Statement of Cash Flows provides information about the University's sources and uses of cash
during the fiscal year. This statement aids in assessing the University's ability to meet obligations and
commitments as they become due, their ability to generate future cash flows, and their needs for
external financing.
As
required by GASB, the statement is presented using the "Direct Method", which
focuses on those transactions that either provided or used cash during the fiscal year.
For years ended June 30,
(stated in millions)
2007 2006 2005
CASH
now
CATEGORY
Cash Provided by(Used for):
Operating Activities
$
(47.39)
$
(49.19)
$
(43.95)
Non-capital Financial Activities 80.13 80.66 71.61
Capital and Related Financial Activities (36.44) (13.85) (24.17)
Investing Activities
Net Increase in Cash
Cash and Cash Equivalents, beginning of year 84.63 58.03 57.60
Cash
and
Cash Equivalents,
end
of year
$
87.05
$
84.63
$
58.03
Specific events or cash transactions in FY 07 which were notable included:
>
Cash flows from operating revenues increased by approximately
$1
1.6 million over FY 06,
due primarily to an increase in cash flows
fiom tuition and fees, auxiliary enterprise charges,
and sales and service activities totaling $10.9 million. This increase in cash flows was offset
by an increase in operating expenses of $9.8 million due largely to an increase in payments
for salaries and benefits of $7.9 million.
P Cash provided by investing activities declined by $2.8 million over the prior year due
primarily to an overall decrease in the purchase and sale of investments.
>
Overall, $36.4 million in cash was used in capital and related financing activities, or an
increase of $22.6 million in comparison to FY 06. The University did not issue additional
long term debt in FY 07 to finance current or future acquisitions of capital assets. In FY 07,
$22.8 million was paid for construction and acquisition of capital assets.
An
additional $13.8
million of cash was used to make debt service payments on long term obligations, including,
$6.4 million of principal paid.
Specific events or cash transactions in FY 06 which were notable included:
>
Cash flows from operating revenues increased by approximately
$1
1.0 million, due primarily
to an increase in cash flows
from tuition and fees and auxiliary enterprise charges totaling
$7.9 million. This increase in cash flows was offset by an increase in operating expenses of
$16.3 million due largely to an increase in payments for salaries and benefits of $13.7
million.
>
Noncapital financing activities provided additional cash flows over the prior year due
to
an
increase in state appropriations of $5.4 million and a significant increase in private
giRs of
$5.8 million, designated primarily for use by several capital building projects.
This is trial version
www.adultpdf.com
A-1
1
>
Cash flows provided by investing activities increased in excess of $12.0 million over FY 05.
A
major reason for the increase was due to the increase in maturities of close to $6.0 million
of debt securities during the year, and a corresponding decrease in investments of $3.3
million compared to FY 05. The proceeds from the maturity of debt securities were used to
fund capital construction activities. Another factor contributing to the increase in cash flows
fi-om these activities was an increase in investment earnings of $2.4 million, resulting fiom
higher yields on interest bearing investments.
>
Overall, cash flows fiom capital and related financing activities increased by $12 million in
FY06. Proceeds from the issuance of Series J 2005 bonds net of payments to defease a
portion of Series F 1999 bonds, increased cash flows by $21 million. This increase was
offset by cash used for acquiring capital assets, which increased by $8.5 million over FY 05.
DISCUSSION
OF
SIGNIFICANT PENDING ECONOMIC AND FINANCIAL ISSUES
The issues we view as significant pending economic or financial issues for the four campuses of the
University are:
>
As of June 30, 2007, a number of major construction projects were nearing completion,
including, on the Missoula campus, an addition to the School of Pharmacy and Allied Health
Sciences Skaggs Building (estimated cost of $14 million), a new journalism school building,
Anderson Hall (estimated cost of $1 1.4 million) and on the Helena campus, an addition to the
Donaldson Building (estimated cost of $7.5 million).
In
addition at year end, Phase
I
of the
expansionlupgrade of the steam distribution system on the Missoula campus (estimated cost
$9 million) was underway.
Looking ahead to the 2009 biennium, the University plans to undertake 10 major construction
projects, with estimated costs in excess of $84.5 million. The projects are as follows:
These projects will be funded from a variety of sources including, Series J bond proceeds,
private donations and state funding.
>
The 2007 Session of the Montana Legislature did not appropriate sufficient additional
funding to cover operation and maintenance costs associated with several new facilities on
the Missoula campus.
A
concern for the University is securing long term funding to cover
these ongoing costs without adversely affecting academic programs or administrative
services.
This is trial version
www.adultpdf.com
>
The number of high school graduates in Montana is projected to decline 17% to 19% over the
next 10 years. This will likely translate into a significant decrease in the number of new
resident students who will enroll at the University each year during this time period. To help
mitigate the impact of
future enrollment declines, the University has or will be implementing
a number of long term strategies to improve access and retention of this smaller pool of in-
state students. While tuition at the University is in the moderate range when compared to
other peer institutions, even a moderate level of tuition increase is not affordable for many
Montana families.
To
improve access and hopefully increase the participation rate of a
smaller pool of prospective in-state students, the University will continue to refine such
programs as Montana Partnering for Affordable College Tuition (MPACT) to minimize debt
burden as a barrier to participation. The University will also continue to encourage more
need-based assistance at the State level to help increase the overall support provided to
economically disadvantaged students.
An
initiative is currently underway to develop and
implement a responsive retention program to improve the retention rate of freshmen through
sophomore students.
Other efforts by the University to mitigate declining resident enrollment include broadening
marketing efforts to attract more non-resident students, including foreign students.
In
addition, the University has placed emphasis on graduate enrollments and research
involvement.
>
The 2007 Session of the Montana Legislature approved a plan proposed by the Governor to
fi-eeze tuition for Montana resident students during the two years of the 2009 biennium. The
Governor's initiative is known as the College Affordability Plan (CAP). The CAP replaced
tuition revenue with general fund appropriation. The Governors plan is a welcome relief for
Montana students after an extended period of rising tuition. Nonresident student tuition and
mandatory fees are not frozen and can be increased during the biennium upon approval by the
Board of Regents.
>
The University continues to seek ways to improve the efficiency and effectiveness of its
operations through an on-going assessment of its business practices. It must pursue
initiatives to generate additional financial support, reduce operating costs, while improving
services to students.
This is trial version
www.adultpdf.com
The
University
of Montana
A
Component Unit of the State of Montana
A-13
Consolidated Statements
of
Net Assets
As
of
June
30,2007
and
2006
2007 2006
ASSETS
Current Assets
Cash and cash equivalents (note
3)
Securities lending collateral
Investments
Accounts and grants receivable, net
Due from Federal government
Due from primary government
Due from other State of Montana component units
Loans to students, net
Inventories
. .
Prepaid expenses and deferred charges
2,505,436 1,661,508
Total current assets
$109,537,339 $106,405,474
Noncurrent Assets
Restricted cash and cash equivalents
Restricted investments
Other long term investments
Loans to students, net
Bond issuance costs
Capital assets. net
263.444.684 248.272.379
Total Noncurrent Assets
$301,749,419 $283,876,959
Total Assets
$411,286,758 $390,282,433
LIABILITIES
Current Liabilities
Accounts payable and accrued liabilities
Due to Federal government
Due to primary government
Due to other State of Montana component units
Securities lending liability
Student and other deposits
Deferred revenue
Accrued compensated absences
Current portion of long-term obligations
6,179,874 5,725,342
Total Current Liabilities
$
47,289,575
$
44,486,581
Noncurrent Liabilities
Accrued compensated absences
$
12,099,491
$
11,596,372
Long tern obligations
140,303,15
1
146,509,434
Advances from primary government
5,076,359 5,466,479
Due to Federal Government
10,020,6 16 9,875,660
NET ASSETS
Invested in capital assets, net of related debt
$134,280,592 $1 19,572,500
Restricted for:
Nonexpendable
Endowments
19,159,970 15,958,648
Loans
1,909,185 1,874,706
Expendable
Loans
1,897,207 1,698,933
Scholarships, research, instruction, and other
3,604,149 3,850,034
Unrestricted
33,551,963 27,298,586
Total Net Assets
$194,403,066 $170,253,407
Total Liabilities
&
Net Assets
$41 1,286,758 $390,282,433
The accompanying notes are an integral part of these financial statements.
This is trial version
www.adultpdf.com
The University
of
Montana
A
Component Unit of the State of Montana
University Component Units
-
Combined Statements of Financial Position
As of June 30 or December 31,2007 and 2006
ASSETS
Cash and cash equivalents
Short-term investments
Accrued dividends and interest
Investments
Contributions receivable, net
Contracts and notes receivable, net
Student loans and other receivables
Depreciable assets, net
of
accumulated depreciation
Other assets
706,747 5 18,232
Total Assets
$
217.372.891
$
190.274.569
LIABILITIES
Accounts payable
$
152,747
$
58,417
Accrued expenses
27,436 27,150
Compensated absences
179,168 168,944
Note payable
-
bank
609,873 469,614
Note payable
-
long-term
57,453 75,712
Liabilities to external beneficiaries
2,904,226 2,786,406
Custodial funds 24,353,157 19,582,375
Other liabilities
247,3 19 3 16,896
Total Liabilities
$
28.531.379
$
23.485.5 14
NET ASSETS
Net assets
-
unrestricted
11,175,235 10,450,806
Net assets
-
temporarily restricted 78,254,364 63,864,257
Net assets
-
permanently restricted 99,411,913 92,473,992
Total Net Assets
$
188,841,512
$
166,789,055
Total Liabilities
&
Net Assets
$
217,372,891
$
190,274,569
The accompanying notes are an integral part of these financial statements.
This is trial version
www.adultpdf.com
The
University of Montana
A
Component Unit of the State of Montana
Consolidated Statements
of
Revenues, Expenses
and Changes in Net Assets
For
the Years Ended June 30,2007 and 2006
2007
2006"
OPERATING REVENUES:
Tuition and fees (net of scholarship allowances in 2007 and 2006 of $17,949,275 and 17,713,186,
respectively; 2007 and 2006 revenues of $1 1,292,252 and $1 1,083,016 respectively, are pledged)
$
99,151,493
$
91,169,556
Federal grants and contracts 63,916,568 64,650,157
State and local grants and contracts 9,198,949 8,913,433
Nongovernmental grants and contracts 6,569,106 4,984,611
Grant and contract facilities and administrative cost allowances 10,456,648 9,793,983
Sales and services of educational departments (2007 and 2006 revenues of $4,057,684 and $3,562,413,
respectively, are pledged) 14,138,787 12,347,010
Auxiliary enterprises charges:
Residential life (net of scholarship allowances in 2007 and 2006 of $1,213,061 and $923,263,
respectively; 2007 and 2006 revenues of $12,365,385 and $1 1,876,485, respectively, are pledged)
12,373,989 11,930,935
Food services (net of scholarship allowances in 2007 and 2006 of $1,213,061 and $923,263,
respectively; 2007 and 2006 revenues of $10,491,524 and $9,717,646 respectively, are pledged)
10,492,514 9,899,853
Other auxiliary revenues (2007 and 2006 revenues of $10,385,865 and $9,692,759, respectively,
are pledged)
11,460,009 10,924,707
Interest earned on loans to students
46,005 47,480
Other
o~erating revenues
6.689.346
5.482.745
Total operating revenues
$
2&f,493~14~$230,144,470
OPERATING EXPENSES:
Compensation and employee benefits
Other (note 18)
Scholarships and fellowships
Deprec'
.
NON-OPERATING REVENUES (EXPENSES):
State appropriations
$
63,455,247
$
62,073,958
Land grant revenues (revenues are pledged) 1,505,512 1,452,867
Private gifts 14,661,178 15,575,156
Investment income (2007 and 2006 revenues of $2,831,339 and $2,005,526, respectively, are pledged) 8,033,742 5,184,299
.
-
Interest expense (7,442,523) (7,376,448)
Net non-operating revenues
$
80,213,156
$
76,909,832
INCOME BEFORE OTHER REVENUES (EXPENSES)
$
14,255,517
$
12,267,652
OTHER REVENUES (EXPENSES):
Capital grants and gifts
$
8,149,640
$
3,063,894
Additions to permanent endowments
1,562,500 1,562,500
Gain (loss) on disposal of capital assets
182,002 (538,074)
Total other revenues
$
9,894,142
$
4,088,320
Net increase in net assets
$
24,149,659
$
16,355,972
NET ASSETS:
Net assets
-
beginning of year
$
170,253,407 $153,897,435
Net assets
-
end
of
year
$
194,403,066 $170,253,407
*Restated
The accompanying notes are an integral part of these financial statements.
This is trial version
www.adultpdf.com