Assessment of the plant diversity changes in ba vi national park in recent 10 years
Bạn đang xem bản rút gọn của tài liệu. Xem và tải ngay bản đầy đủ của tài liệu tại đây (351.09 KB, 31 trang )
ACKNOWLEDGEMENTS
Being consented of the Department of Forest Resources and Environmental
Management (FREM), I have carried out a research: “Assessment of the plant diversity
changes in Ba Vi National Park in recent 10 years"
In the implementing research process, I have received the help of Management Board,
Forest Rangers of Ba Vi National Park, local people, and especially the enthusiastic guidance
of Assoc. Prof. Dr. Bui The Doi – Vietnam Forestry University.
So I would like to express deep gratitude to Assoc.Prof.Dr. Bui The Doi, and also
thank to the Board of Director of Ba Vi National Park, forest rangers who have created
favorable conditions for me to complete the study. Especially forest rangers have instructed
me enthusiastically throughout the research. I also appreciate the local people, my family and
classmates who help me complete this study.
Due to time constraints, knowledge, and capacity are limit, so this study will not avoid
flaws. I look forward to the contributions from teachers to more complete the study.
Sincerely!
Hanoi, October, 2015
Tran Phung Ngoc Anh
ABSTRACT
The research presents the changes of plant diversity in Ba Vi National Park in recent
10 years. Base on old data and survey results collected on 10 sample plots in 2015, the study
clearly described the status of forest changes over the years and determine the cause of
decline of plant resources, propose measures to conserve plant diversity. Using methods of
investigation for fluctuations in forest state, methodology of fluctuations of forest plants to
investigate the biodiversity indicators. The results of study showed that total forest area,
natural forests and plantation forests area have changed after 10 years: fluctuation in density
of high tree layer, fluctuation in diameter at breast height of high tree layer, and fluctuation in
the tree high of high tree layer. In addition, important value index and diversity indices of tree
species are also necessary indicators to assess status of forest. Data collected in 2015 include
61 species and 701 trees species. Generally, plant resources in Ba Vi National Park in 10
years don’t have much fluctuation, and the index has not changed much proved that the
quality of forests in the study area are quite good.
TABLE OF CONTENTS
ACKNOWLEDGEMENTS
ABSTRACT
TABLE OF CONTENTS
LIST OF FIGURES
LIST OF TABLES
I. INTRODUCTION ................................................................................................................... 1
II. AN OVERVIEW OF THE RESEARCH............................................................................... 8
2.1. In the world .......................................................................................................................... 8
2.2. In Vietnam ........................................................................................................................... 9
III. RESEARCH OBJECTIVES AND METHOD ................................................................... 11
3.1. Goals and objectives: ......................................................................................................... 11
3.2. Study site and scope .......................................................................................................... 11
3.3. Methodologies ................................................................................................................... 13
3.3.1. Data inherited method ................................................................................................... 13
3.3.2. Field survey methods ...................................................................................................... 13
IV. RESEARCH RESULTS AND DISCUSSIONS ................................................................ 18
4.1. Fluctuations in forest state and in forest area .................................................................... 18
4.2. Fluctuations of forest plants in Ba Vi National Park ......................................................... 20
4.2.1. Fluctuations in density of high tree layer ....................................................................... 20
4.2.2. Fluctuations diameter at breast height (DBH) of high tree layer. .................................. 21
4.2.3. The fluctuation the trees high (H) of high tree layer. ..................................................... 23
4.3. Investigative biodiversity indicators .................................................................................. 24
4.3.1. Important value index ..................................................................................................... 24
4.3.2. Diversity indices of tree species. .................................................................................... 26
4.4. Proposed some solutions developed lower forest layer and forest management Ba Vi
National Park. ........................................................................................................................... 27
4.5. Propose some solutions to protect and grow diverse plant resources in Ba Vi National
Park. .......................................................................................................................................... 28
V. CONCLUSION ................................................................................................................... 29
REFERENCE
LIST OF FIGURES
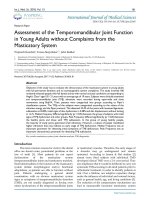
Figure 3.1. The location of study site ...................................................................................... 12
Figure 3.2. Sample plot ............................................................................................................ 14
LIST OF TABLES
Table 4.1. Comparing fluctuations of total forest area, natural forests area, and plantation
forests area. ............................................................................................................................... 18
Table 4.2.The density of high tree layer of regional in phase 2005 to 2015 ............................ 20
Table 4.3. Fluctuations diameter at breast height (DBH) of high tree layer in phase 2005 to
2015 .......................................................................................................................................... 22
Table 4.4. The average height of high tree layer in phase 2005 to 2015 .................................. 23
Table 4.5. Important value index .............................................................................................. 25
Table 4.6. Diversity indices of tree species .............................................................................. 26
I. INTRODUCTION
Forests provide us many rare products. Many of trees in forest are herbs have health
benefits for human life. Forests also play an important role in climate regulation, and life
protection. Forests are the giant lungs for air purification, oxygen supply to sustain human
life. They are also windbreak forests, and coastal sand compartment. There are forests
preventing floods in the mountains. Forests help people to limit nature disasters.... In
particular, forest is an invaluable nature reserve with thousands of birds, rare animals, and a
source of endless research for the biologists.
Currently, the demand for resources is increasing, leading to numerous contradictions
in the relationship between nature conservation and development. To resolve this conflict, but
still satisfies human’s demands in a sustainable manager, the need to use resources in a way
that effectively, especially forest resources. However, forests have been over exploited,
natural causes were devastated, and climate change is threatening the lives around Earth.
Estimation of the Food and Agriculture Organization of the United Nations (FAO)
said that every year, 130.000 km² of world's forest is disappearing due to deforestation. This
makes the habitat of species on Earth has shrunk, biodiversity declined, with this trend in the
future, every day we will lost about 100 species. Besides, the conversion of forests to
agricultural land, land settlement, sustainable timber harvesting, and land management
inefficiency... are also the common reasons for this loss of forests in many region in the
world. Concerning about the phenomenon of climate change, the World Bank said that 20%
of greenhouse gas emissions are caused by deforestation today.
In Vietnam, the forest cover has been declining at an alarming rate. The quality of the
remaining natural forest is low. In 1943, with nearly 15 million hectares of area, forests
covered 43% of the natural area. But the 30-year war with many different causes, made forest
6
areas shrink rapidly, until 1993, only 9.5 million hectares remaining, covering 28% of the
natural land of the country.
The economic development while still protecting natural resources and environment
for sustainable development is a matter of many managers. To make this work, investigation,
monitoring and analyzing fluctuations in the forest area is one of the most important tasks.
Every year, forest managers should have reports on the current state and the changes of forest
area to help manage and protect forests.
Today the protection and sustainable development of forest resources are set out as an
urgent requirement for many countries and globally. On general principles of sustainable
development, sustainability of forest is evaluated base on the stability of the area, the ability
to provide wood and wood quality, the functional conservation of biological diversity, in
terms of ecological sustainability of socio-economic and employment security for the people.
Today, due to the development of the society, in which natural forest area in the world in
general, and Vietnam in particular are being degraded in terms of area and plant resources.
That’s why, I chose this topic for my thesis, in order to assess fluctuations in plant resources
at Ba Vi National Park, and provide a better overview of the status of plant resources in Ba Vi
National Park. Using old surveys of previous years, I can evaluate data over the years, analyze
and clarify the status of forests, forest area, and the change of forest plant resources. This will
help me to clarify whether the status of forest plant resources at present is better or worse in
previous years, in terms of forest area and whether forest protection wayis adequate or not.
From that information, a number of measurements to protect and improve forest better would
be proposed, making the management of forests to be more sustainable.
7
II. AN OVERVIEW OF THE RESEARCH
Investigation and assessment of forest vegetation resources at Ba Vi National Park is
actually to investigate and assess the current state of the vegetation here, and the result is to
bring data collected by the group of plant resources. Thereby, solutions for using reasonable and
sustainable of plant resources in the study area will be proposed. There have been numerous
studies on vegetation and researches on sustainable development, which mentioned below:
2.1. In the world
The international conference on major forest areas in the world took place on
11/03/2010 in France. At this conference, participants discussed measurements to fight
deforestation in the world, including the deployment of US for $3.5 billion financing, which 6
countries (including France, Australia, Japan, Britain, Norway, and the US) have committed
to support developing countries to reduce emissions causing the greenhouse effect from
deforestation at the Copenhagen summit in 12/2009.
Base on the conference opening speech, French President Nicolas Sarkozy called the
developed countries and the developing countries together take on the task to fight against
deforestation in the world, with the goal of reducing deforestation by 50% by 2020 and
elimination deforestation by 2030. Mr. Sarkozy stressed that the fight against deforestation
must be linked to the livelihood security of people in poor countries. Sarkozy said: "It is
absurd if must choose between protecting forests and poverty of the people living in the forest
and the surrounding areas. I hope there will be a study on the impact of positive and negative
anti-deforestation programs on food security issues in order to offer the best solutions to
reconcile the task of combating deforestation and Security food security"
To raise awareness about conserving and enhancing forest management and
sustainable development for the benefit of the present and futuregenerations, the United
Nations has officially declared the year of 2011 as the International Year of the Forest, with
8
the main objective is to promote the management, conservation and sustainable development
of all types of forests; while enhancing the long-term political commitment among nations
based on "Declaration of Rio" (1992), the principles of Agenda 21 on combating
deforestation.
Specifically, through the activities of the International Year of the Forest in the
country and the region, the UN wants worldwide of forest cover will increase significantly
through sustainable forest management, which including protection, restoration and
reforestation, afforestation and the efforts to prevent forest degradation. At the same time,
reduce the economic, social, environmentalimpacts on and forest by improving the livelihoods
of people who depend on forests.
2.2. In Vietnam
On 24 September 2010, the Government of Vietnam issued a "Decree 99/2010 / NDCP on the policy on payment for forest environmental services". Under this Decree, the state
agencies, organizations, households, and individuals doing business to benefit from forest
environment must pay for the suppliers (organizations and individuals, forest communities).
There is a lot of research on the investigation and evaluation of forest vegetation in Vietnam,
focusing research mainly on the status of vegetation, its development rules, which propose
security solutions protection, forest restoration. This proposal can list a number of typical
projects:
-
Vu Tien Hinh (1991), "The regeneration characteristics of the natural forest ", Journal
of Forestry.
-
Le Đong Tan (2000), “Study the natural recovery process some plant communities
after cultivation in Son La serve the zoning”, Biology doctoral thesis, Hanoi.
-
Nguyen Tu Uong, Do Van Ban(2010) “Study forest plant resources in Vietnam”
9
-
Tran Minh Tuan (2014) Research of diversity of vascular plants in Ba Vi National
Park
The study of changes in forest resources of Tran Ngu Phuong and Thai Van Trung
mentioned the laws of different forest structure, recognition of arrangement trees with the
space vertical and spatially located horizontal.
10
III. RESEARCH OBJECTIVES AND METHOD
3.1. Goals and objectives:
- Goal: Improve the effectiveness of management of forest resources in Ba Vi National Park
- Specific objectives:
[1] Using the survey results and comparing with the old data to determine the status of
forest changes over the years, changes in forest area, plant resources, and to calculate
indicators of biodiversity in the study area.
[2] Determining the causes of declining in plant resources and propose measurements to
conserve plant diversity in Ba Vi National Park.
3.2. Study site and scope
- Study site: Ecological Restoration zone of Ba Vi National Park.
- Forest type: Secondary natural forest in Ba Vi.
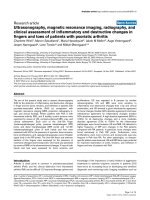
Ba Vi National Park has been affected by the north latitude factors, monsoon
combining together, and have humid tropical climate (dry and cold in winter). The annual
average temperature is 23.40C, the lowest temperature is 2.70C, and highest temperature
reaches to 420C. At 400m height above the sea level (ASL), average temperature is 20.60C;
above 1,000m height at ASL, the average temperature is about 160C, and sometimes in the
winter, temperature can decrease to 0.20C. The annual rainfall is about 2,500mm and is
mainly distributed from July to August. The air humidity is about 86.1%, at 400m height
ASL; there is no dry season. With those characteristics, it has made the diversity of ecology,
and it becomes a rich potential resort attracting tourists. Ba Vi National Park is higher than
Cuc Phuong National Park, so the weather in Ba Vi National Park is cooler than that in Cuc
Phuong. In the high peaks, it has more diversity about flora and fauna than Cuc Phuong
National Park.
11
Ba Vi has medium and low mountains. It has some high mountain peaks such as: Vua peak
(1,296m asl.), Tan Vien peak (1,227m asl.), Ngoc Hoa peak (1,131m asl.), and Vien Nam
peak (1,031m ASL.).
Ba Vi mountain range consists of two main ridges. The first ridge stretches from the
East to the West (from Oi stream to Dat bridge then through Vien and Lobster peak) with 9km
long. The second ridge stretches from Northwest to Southeast (from Yen Vien Son, through
Tan Vien peak to Quit mountain with 11km long, then it extends to Vien Nam belong to Hoa
Binh province). The Park has many steep slopes, the average slope is about 250, and from the
elevation above 400m, the average slope is 350.
Figure 3.1. The location of study site
12
3.3. Methodologies
3.3.1. Data inherited method
To assess the changes in forest vegetation resources at Ba Vi National Park in 10
years, major tasks of this phase is to collect, examine, evaluate documentation and available
data, and field surveys according to the requirements of the content and objectives of the
subject. The consisting data of the study area will be selected and inherited.
_ Collect data variation of plant resources in 10 years and the natural conditions, economic,
and social studies area.
_ Collect documents and records related to the service, the study of the subject
3.3.2. Field survey methods
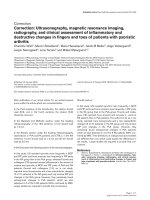
a) Setting up plots: Principle: plot area is the minimum area, relatively homogenous forest to
ensure that the research data to meet the requirements and the research objectives proposed.
Fixed plots in the position of high representative for the forest, the terrain is relatively
homogenous, and the trees distributed relatively evenly, normal growth. Do not place plots
squeezed through the slot, over the top or through the trail.
To have full characteristics for the research, representing the diverse flora across the
entire study area, the selection of survey line and research sites is very important. Based on
topographic maps, maps of land use status of Ba Vi National Park, and the previous survey to
conduct selection the site survey.
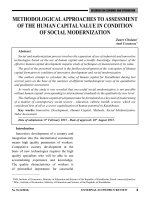
The area and shape of sample plots: plot has the area of 5000m2 (40m x 125m) in the
north slopes of Mount Ba Vi
Structure of sample plots: multi-scale sampling plots.
For each sample plot we will arrange as below:
13
Figure 3.2. Sample plot
b) Method of investigation for fluctuations in forest state, fluctuations in forest area:
Preliminary survey forests at Ba Vi National Park, assess the current state of the forest
for 10 years period. Collecting the data of the previous year, tabulation of data to comparing
fluctuations forested area, and I chose two time periods of 2005 and 2010, then compared
with 2015.
Time
Natural forest
Plantation forest
Area (ha)
2005
2010
2015
c) Research methodology of fluctuations of forest plants in Ba Vi National Park
* Investigating the high tree layer: high tree layer with silvicultural perspectives are
trees with crown that create the main forest canopy and with DBH (diameter at breast height)
greater than 6cm.
14
*The indicators to be measured at tree layer:
_ Measuring the diameter at breast height (DBH) of all trees in plots with caliper, measured in
two perpendicular dimensions and took the average.
_ Measuring the tree high (H) and height under crown (h) of all trees in plots by height
measuring machine Vertex.
_ Measuring the diameter of tree crown (Dc) of all trees in plots by tape.
_ Surveying the state of growth in two levels of good and bad (good growth trees with a good
shape, foliage are not twisted, topless; on the contrary is bad).
Ordinal
DBH (cm)
Species
name
1
...
2
...
da
db
H (m)
Dav
H
Dc
h
da
db
Dav
Sample sheet #1: Tree measurement
* Investigate lower forest layer:
Along with investigating tree layer, it is necessary to check the numbers of lower forest layer,
all small trees have to be numbered or marked with paint, in case trees are too small, should
hang numbers sign.
-
Identify the species name: Based on the survey results of the previous year, comparing
the position diagram to determine reality status. If errors are detected, it need to be
repaired, or added.
-
Measurement of the growth indicators: conducted similar to high tree layer.
Specifically, the actual measurement of indicators: the diameter at breast height
(DBH), trees high (H and h), diameter of tree crown (Dc ), quality of trees…
15
d) Methods to investigate the biodiversity indicators
Applied the practical research methods by quantitative analysis of biological diversity
in order to determine the index: Shannon index (H), Importance Value Index (IVI). If the
value of the index is high, it means high diversity corresponds with high biological value.
This research method is necessary to create database for solutions for conservation, policy and
planning sustainable use of biodiversity resources.
To identify indicators of biodiversity of Ba Vi National Park, using survey methods
according to plots. At each plot, measure and collect information on:
_ Species composition (with sampling plant to specify the name for a number of species
required); determine the name of the trees.
_ The number of individuals for each species, diameter of each individual
- Determining important value IV index of tree species (IV, %) by using formula (1)
(1)
In which:
- IV%: important value index of tree species
- N%: percentage of the number of tree species
- G%: percentage of basal area of tree species
Basal area (BA) = π (DBH/2)2
- Determining diversity index of tree species, include: Formula (2), (3), (4), (5).
+ Margalef's Diversity index (d)
(2)
Where:
d: diversity indicator Margalef
S: total species in the plot
16
N: total individual in the plot
+ Diversity indicator Shannon - Wiener (H’)
(3)
With:
H’: indicator Shannon - Wiener
S: the number of species in the plot
(4)
N: total individual in the plot
ni: the number of individual of i specie
+ Indicator Simpson (L - Lambada)
(5)
17
IV. RESEARCH RESULTS AND DISCUSSIONS
4.1. Fluctuations in forest state and in forest area
Total forest area and forest land in Ba Vi National Park are 10,814.6 hectares. Based
on the status of the distribution of forest resources, the terrain of the Ba Vi National Park is
divided into functional areas:
a) Strict protection zone: with functions, the basic task is to strictly protect status quo
entire area and to prohibit all activities that change the composition and structure of the forest.
This is a subdivision primarily for scientific research and tourist attractions, including the area
from a height of 400m and above, total area: 1648.6 ha, accounting for 15.2% of the area,
including: forests land 1617.7 ha, accounting for 98.1% of the subdivision, no forest land 29.9
ha, accounting for 1.8% of the subdivision, other land 1.0 ha, representing 0.1% area
subdivision.
b) Ecological restoration zones: Include area under 400m elevation, total area 8,823.5
ha, making up 81.6% of the area. Forested land 7,045.9 ha, accounting for 79.8% of the
subdivision in which 4932.1 ha are natural forests, and 2,113.8 ha are plant forest. No forest
land 1,569.5 ha, accounting for 17.8% of the subdivision, other land: 210.1 ha, accounting for
2.4% of the subdivision. The average forest area (state IIIA2, IIIB), and poor forest (state
IIIA1) focus area three mountains with 883.9 ha.
Table 4.1. Comparing fluctuations of total forest area, natural forests area, and
plantation forests area.
Time period
Natural forest (ha)
Plantation forest (ha)
Total area (ha)
2005
4,987.4
2,052.3
7,039.7
2010
4,959.4
2,086.8
7,046.2
2015
4,932.1
2,113.8
7,045.9
18
Base on data collected, tabulated comparison showing forest area over the years to
compare, evaluate, and review the status, condition of forests in Ba Vi National Park
*Review and explain fluctuations of types of forest
Overall, forest quality in Ba Vi National Park is relatively stable, with the decline, but
not significantly, in 10 years, from 2005 to 2015, the area of forest land tended to increase
from 7,039.7 ha to 7,045.9 ha.
Natural forests: In 2005, natural forests in Ba Vi National Park is 4,987.4 ha reached
45.6% coverage rate of forests; natural forests in 2010 was only 4,959.4 hectares, and from
2010 to 2015, decreased from 4,959.4 ha to 4,932.1 ha. Thus, after 10 years, natural forest
area have decreased 55.3 ha.
Some causes affecting this decline: in a few years, the growing in population and
increasing in demand of firewood, timber, food crops and large industrial plants. Illegal
logging status still occurs; according to statistics in 10 years from 2005 to 2015, rangers
discovered and handled 30 cases of illegal logging with total losses of 38.1 m3of wood.
Deforestation, slash and burn, forest fires have also happened to cause the decline of natural
forests. Besides, forest protection has not been performing well, and uncontrolled acts of
forest land encroachment existing. The illegal slash and burn and forest fires in the past and
present have caused destruction of species in the region. It is a direct cause that weakens the
plant diversity of this place. It is not only destroyed directly the species, but also change the
environment, and make the regeneration capacity of vegetation decline.
Plantation forest: in 2005, plant forest area is 2,052.3 ha. Since then, the planted
forests area increasing continuously; especially from 2010 up to now, afforestation rate has
increased rapidly, 61.5 ha in 10 years. Planted forest area increased by planting movement
thriving in many places recently, and a plan to plant 5 million hectares of forestry were
applied and implemented at Ba Vi National Park. Total forest area is currently 7,045.9
hectares, occupying 65.15% of total forest area.
19
4.2. Fluctuations of forest plants in Ba Vi National Park
High tree layer have dominant effects on situations of forest and affect the growth of
native trees under their canopy. According to survey of 10 plots of high tree layer in the
research area, there are two main species: Vai guoc (Xerospermum noronhianum (Blume)
Blume) and Khao tang (Nothaphoebe baviensis H.Lec.)
4.2.1. Fluctuations in density of high tree layer
Density is a very important factor to present the level of high tree layer. Frequency of
appearance of Vai guoc is 10/10 plots and Khao tang is 9/10 plots. Calculation results of high
tree layer from 2005 to 2015 are summarized in Table 4.2
Table 4.2.The density of high tree layer of regional in phase 2005 to 2015
Area of plot: 500m2
Tree names
Vai guoc
Khao tang
Years
Plots
number
2005
2010
2015
1
2
2
3
2
6
6
6
3
5
5
7
4
4
5
7
5
5
7
9
6
3
4
4
7
2
7
9
8
0
3
4
9
6
8
9
10
2
3
3
N(max)
6
8
9
N(min)
0
2
3
N(Av)
3
5
6
1
6
6
7
2
5
6
6
3
6
6
6
20
4
5
5
5
5
5
5
7
6
9
9
10
7
3
4
4
8
1
2
3
10
2
2
2
N (max)
9
9
10
N (min)
1
2
2
N(Av)
5
5
6
High tree layer density of the forest status in the study area has not change much
(average increase from 1 to 2 trees per plot of 500m2), because plants are perennial woody
plants and relatively height. Highest density is 10 trees in plot #6, and lowest density is 0 trees
in plot #8. The increase is because well-protected area was not affected by deforestation,
plants are still growing and well developed.
Thus, high layer in this forest stand is tree layer developed naturally, without human
influence. However, in the current period, due to the need of light and nutrients for trees under
canopy in lower layer are increasing, so high layer density remaining may cause an adverse
effect on the growth and development of tree under the canopy.
4.2.2. Fluctuations diameter at breast height (DBH) of high tree layer.
The diameter at breast height is an important indicator reflecting the growth of forest
trees. Through which may reflect the effect of the application of silvicultural techniques,
measures and adaptability of forest tree with conditions and circumstances. Therefore,
diameter at breast height is growth indicators indispensable in the process of investigation and
research of forest resources. DBH show the growing horizontally. Over the year, the trees
have increased about diameter at breast height and there is no sign of declining. I have
selected with each species a few trees that characteristic and typical for indicators DBH. Data
of DBH on research plots in the period (2005-2015) are shown in Table 4.2
21
Table 4.3. Fluctuations diameter at breast height (DBH) of high tree layer
in phase 2005 to 2015
Unit: cm
Tree names
Vai guoc
Khao tang
Plots number
Years
2005
2010
2015
1
13.2
14.4
15.9
4
27.8
29.1
31.4
6
21.3
22.5
24.2
7
6.4
7.6
8.6
9
13.4
14.7
15.9
DBH (max)
27.8
29.1
31.4
DBH (min)
6.4
7.6
8.6
DBH (Av)
17.1
18.4
20
3
20.3
25.5
29.9
2
50.3
52.8
56.1
5
6.8
7.5
8.9
9
17.0
22.1
27.7
4
15.5
17.6
21.0
DBH (max)
50.3
52.8
56.1
DBH (min)
6.8
7.5
8.9
DBH (Av)
57.1
30.2
32.5
From Table 4.2, the result shows that: each research plot by time is the increase in
diameter at breast height indicators, so high tree layer in the area are still in the growth stage.
We can see that the growth rate is relatively stable.
In a time of research, DBH is variation among the plots, in 2015, the highest diameter
at breast height in plot 2 is 56.1 cm, and the lowest at plot 7 is 8.6 cm. With high DBH value
is usually economic value of forest more large, due to the greater volume and tree age DBH
often high, the development of DBH often slower than the development of the tree high (H).
22
Variance with the difference between the plots, from 5.3 to 9.2, such situation occurs due to
natural forests growth and the previous years don’t have much affect. On the other hand, trees
with different age (from 15 to 24 years) should lead to disparities in DBH.
4.2.3. The fluctuation the trees high (H) of high tree layer.
The high of trees is an important indicator in surveys of forest growth; it manifests
forest tree growth, while also reflecting the structure of the forest, according to the vertical
plane. Based on the height, we can see a lot of the characteristics of the forest. The change in
H of high tree layer in the period (2005-2015) are shown in Table 4.2
Table 4.4. The average height of high tree layer in phase 2005 to 2015
Unit: m
Tree
names
Vai guoc
Khao tang
Plots number
Years
2005
2010
2015
1
9.6
10.2
11,0
4
8.0
12.3
14.6
6
7.6
8.9
10.0
7
5.8
7.7
8.4
9
8.0
10.5
12.0
H(max)
9.6
10.2
11.0
H(min)
5.8
7.7
8.4
H(Av)
7.7
8.9
9.7
3
8.0
11.5
15.4
2
17.0
21.7
25.0
5
6.0
7.5
9.2
9
12.6
14.1
15.0
4
11.0
15.4
18.2
H(max)
17.0
21.7
25.0
H(min)
6.0
7.5
9.2
H(Av)
11.5
14.6
34.2
23
From table 4.3 we can see that: every year, the height of high tree layer in the region
still rising, suggesting that tree growth and normal development.
Data in the 5 years of research, the height of the trees in the plots are relatively large
fluctuations, in 2015, the height of high tree layer ranges from 8.4 m to 25.0 m. The variance
has not much difference, from 2.5 to 3.7; due to good plant growth and normal growth in
height.With this height, high tree layer dominates the above trees layer, shielding and
reducing the intensity of light for the below trees layer, includes smaller shade, tolerate plants
to grow better. On the other hand, Table 4.3 shows the variation in height of high tree layer is
quite high, suggesting that plants grow quickly in good climate and other impacts are less
affected.
4.3. Investigative biodiversity indicators
4.3.1. Important value index
The species that have ecological significance in the community have an important
value index (IV %) of equal and more than 5%. In this study, in 2015, the results of the study
showed that number of the species that meet this criterion which have significant in
communities ranged from 2 to 10 species. Important value indices also have differences
among the species and change among years.
In 10 plots there are 15 species that have highest IV%, in which 2 species have
ecological significance, Khao tang (Nothaphoebe baviensis) and Re chum (Cinnamomum
glaucescens) have the highest IV% values. Percentage of plots where species appeared in
varied from 60% to 90%. 15 species which have the high important value indices (IV%) are
shown in Table 4.4.
24
Table 4.5. Important value index
No.
Name of species
Family
IV % (2015)
IV % (2005)
1
Khao tang (Nothaphoebe baviensis)
Lauraceae
2.54 – 18.51
1.82- 18.78
2
Re chum (Cinnamomum glaucescens)
Lauraceae
0.92- 16.55
1.93 – 16.04
3
Ba dau (Croton roxburghii)
Euphorbiaceae
2.18 – 12.36
3.24 – 12.04
4
Goi gac (Aphanamixis grandiflora)
Meliaceae
1.41 – 8.12
1.91 -10.18
5
Nanh chuot (Cryptocarya lenticellata)
Lauraceae
1.14 – 8.99
1.62 – 7.62
6
Tram trang (Eugenia wightiana)
Myrtaceae
1.45 – 14.98
1.55 – 14.45
7
Linh (Eurya japonica)
Pentaphylacaceae 1.21 – 8.72
1.44 – 6.46
Khao luoi nai (Machilus thunbergii
8
Lauraceae
1.22 – 10.32
1.64 – 6.89
Myrtaceae
0.84 – 10.09
1.72 – 9.77
Sapindaceae
3.96 – 14.46
3.85 – 12.15
Magnoliaceae
0.98 – 8.62
1.72 – 8.44
Fagaceae
1.95 – 9.56
2.34 – 11.04
Apocynaceae
2.67 – 7.35
1.83 – 5.22
Lauraceae
1.04 – 6.46
1.61 – 6.94
Rubiaceae
1.30 – 8.08
1.69 – 9.53
Sieb)
9
Tram tia (Syzygium baviense)
Vai guoc (Xerospermum
10
noronhianum)
11
Mo (Parakmeria lotugensis)
12
De la tre (Quercus bambusifolia)
13
Thung muc (Wrightia laevis)
14
Re gung (Cinnamomum zeylanicum)
Vang ve (Adina globiflora Salisb var
15
tonkinensis)
According to Thai Van Trung (2001), the dominant tree species must have IV value
≥ 50%. Calculation results show that 6 plots (in total of 10 plots investigated) satisfies this
condition, the total index of the IV% ecologically significant species varied from 50.64% to
80.88%. The presence of many species, such as Khao, Nanh Chuot, Tram Tia, Vai Guoc, and
25