starck, murtagh - handbook of astronomical data analysis
Bạn đang xem bản rút gọn của tài liệu. Xem và tải ngay bản đầy đủ của tài liệu tại đây (5.36 MB, 303 trang )
Jean-Luc Starck and Fionn Murtagh
Handbook of Astronomical Data
Analysis
Springer-Verlag
Berlin Heidelberg NewYork
London Paris Tokyo
Hong Kong Barcelona
Budapest
Table of Contents
Contents. . . . . . . . . . . . . . . . . . . . . . . . . . . . . . . . . . . . . . . . . . . . . . . . . . . . . . i
Preface . . . . . . . . . . . . . . . . . . . . . . . . . . . . . . . . . . . . . . . . . . . . . . . . . . . . . . . vii
1. Introduction to Applications and Methods . . . . . . . . . . . . . . . . 1
1.1 Introduction . . . . . . . . . . . . . . . . . . . . . . . . . . . . . . . . . . . . . . . . . . . 1
1.2 Transformation and Data Representation . . . . . . . . . . . . . . . . . . 4
1.2.1 Fourier Analysis . . . . . . . . . . . . . . . . . . . . . . . . . . . . . . . . . . 5
1.2.2 Time-Frequency Representation . . . . . . . . . . . . . . . . . . . . 6
1.2.3 Time-Scale Representation: The Wavelet Transform . . 8
1.2.4 The Radon Transform . . . . . . . . . . . . . . . . . . . . . . . . . . . . 12
1.3 Mathematical Morphology . . . . . . . . . . . . . . . . . . . . . . . . . . . . . . . 12
1.4 Edge Detection . . . . . . . . . . . . . . . . . . . . . . . . . . . . . . . . . . . . . . . . . 15
1.4.1 First Order Derivative Edge Detection . . . . . . . . . . . . . . 16
1.4.2 Second Order Derivative Edge Detection . . . . . . . . . . . . 19
1.5 Segmentation . . . . . . . . . . . . . . . . . . . . . . . . . . . . . . . . . . . . . . . . . . 20
1.6 Pattern Recognition . . . . . . . . . . . . . . . . . . . . . . . . . . . . . . . . . . . . 21
1.7 Chapter Summary . . . . . . . . . . . . . . . . . . . . . . . . . . . . . . . . . . . . . . 25
2. Filtering . . . . . . . . . . . . . . . . . . . . . . . . . . . . . . . . . . . . . . . . . . . . . . . . . . 27
2.1 Introduction . . . . . . . . . . . . . . . . . . . . . . . . . . . . . . . . . . . . . . . . . . . 27
2.2 Multiscale Transforms . . . . . . . . . . . . . . . . . . . . . . . . . . . . . . . . . . . 29
2.2.1 The A Trous Isotropic Wavelet Transform . . . . . . . . . . . 29
2.2.2 Multiscale Transforms Compared to Other Data Trans-
forms . . . . . . . . . . . . . . . . . . . . . . . . . . . . . . . . . . . . . . . . . . . 30
2.2.3 Choice of Multiscale Transform . . . . . . . . . . . . . . . . . . . . 33
2.2.4 The Multiresolution Support . . . . . . . . . . . . . . . . . . . . . . . 34
2.3 Significant Wavelet Coefficients. . . . . . . . . . . . . . . . . . . . . . . . . . . 36
2.3.1 Definition . . . . . . . . . . . . . . . . . . . . . . . . . . . . . . . . . . . . . . . 36
2.3.2 Noise Modeling . . . . . . . . . . . . . . . . . . . . . . . . . . . . . . . . . . 37
2.3.3 Automatic Estimation of Gaussian Noise . . . . . . . . . . . . 37
2.4 Filtering and Wavelet Coefficient Thresholding . . . . . . . . . . . . . 46
2.4.1 Thresholding . . . . . . . . . . . . . . . . . . . . . . . . . . . . . . . . . . . . 46
2.4.2 Iterative Filtering . . . . . . . . . . . . . . . . . . . . . . . . . . . . . . . . 47
ii Table of Contents
2.4.3 Experiments . . . . . . . . . . . . . . . . . . . . . . . . . . . . . . . . . . . . . 48
2.4.4 Iterative Filtering with a Smoothness Constraint . . . . . 51
2.5 Haar Wavelet Transform and Poisson Noise . . . . . . . . . . . . . . . . 52
2.5.1 Haar Wavelet Transform . . . . . . . . . . . . . . . . . . . . . . . . . . 52
2.5.2 Poisson Noise and Haar Wavelet Coefficients . . . . . . . . . 53
2.5.3 Experiments . . . . . . . . . . . . . . . . . . . . . . . . . . . . . . . . . . . . . 56
2.6 Chapter Summary . . . . . . . . . . . . . . . . . . . . . . . . . . . . . . . . . . . . . . 59
3. Deconvolution . . . . . . . . . . . . . . . . . . . . . . . . . . . . . . . . . . . . . . . . . . . . 61
3.1 Introduction . . . . . . . . . . . . . . . . . . . . . . . . . . . . . . . . . . . . . . . . . . . 61
3.2 The Deconvolution Problem . . . . . . . . . . . . . . . . . . . . . . . . . . . . . 62
3.3 Linear Regularized Methods . . . . . . . . . . . . . . . . . . . . . . . . . . . . . 65
3.3.1 Least Squares Solution . . . . . . . . . . . . . . . . . . . . . . . . . . . . 65
3.3.2 Tikhonov Regularization . . . . . . . . . . . . . . . . . . . . . . . . . . 65
3.3.3 Generalization . . . . . . . . . . . . . . . . . . . . . . . . . . . . . . . . . . . 66
3.4 CLEAN . . . . . . . . . . . . . . . . . . . . . . . . . . . . . . . . . . . . . . . . . . . . . . . 67
3.5 Bayesian Methodology . . . . . . . . . . . . . . . . . . . . . . . . . . . . . . . . . . 68
3.5.1 Definition . . . . . . . . . . . . . . . . . . . . . . . . . . . . . . . . . . . . . . . 68
3.5.2 Maximum Likelihood with Gaussian Noise . . . . . . . . . . . 68
3.5.3 Gaussian Bayes Model . . . . . . . . . . . . . . . . . . . . . . . . . . . . 69
3.5.4 Maximum Likelihood with Poisson Noise . . . . . . . . . . . . 69
3.5.5 Poisson Bayes Model. . . . . . . . . . . . . . . . . . . . . . . . . . . . . . 70
3.5.6 Maximum Entropy Method . . . . . . . . . . . . . . . . . . . . . . . . 70
3.5.7 Other Regularization Models . . . . . . . . . . . . . . . . . . . . . . . 71
3.6 Iterative Regularized Methods . . . . . . . . . . . . . . . . . . . . . . . . . . . 72
3.6.1 Constraints . . . . . . . . . . . . . . . . . . . . . . . . . . . . . . . . . . . . . . 72
3.6.2 Jansson-Van Cittert Method . . . . . . . . . . . . . . . . . . . . . . . 73
3.6.3 Other iterative methods . . . . . . . . . . . . . . . . . . . . . . . . . . . 73
3.7 Wavelet-Based Deconvolution . . . . . . . . . . . . . . . . . . . . . . . . . . . . 74
3.7.1 Introduction . . . . . . . . . . . . . . . . . . . . . . . . . . . . . . . . . . . . . 74
3.7.2 Wavelet-Vaguelette Decomposition . . . . . . . . . . . . . . . . . 75
3.7.3 Regularization from the Multiresolution Support . . . . . 77
3.7.4 Wavelet CLEAN . . . . . . . . . . . . . . . . . . . . . . . . . . . . . . . . . 81
3.7.5 Multiscale Entropy . . . . . . . . . . . . . . . . . . . . . . . . . . . . . . . 86
3.8 Deconvolution and Resolution . . . . . . . . . . . . . . . . . . . . . . . . . . . . 88
3.9 Super-Resolution . . . . . . . . . . . . . . . . . . . . . . . . . . . . . . . . . . . . . . . 89
3.9.1 Definition . . . . . . . . . . . . . . . . . . . . . . . . . . . . . . . . . . . . . . . 89
3.9.2 Gerchberg-Saxon Papoulis Method . . . . . . . . . . . . . . . . . 89
3.9.3 Deconvolution with Interpolation . . . . . . . . . . . . . . . . . . . 90
3.9.4 Undersampled Point Spread Function . . . . . . . . . . . . . . . 91
3.9.5 Multiscale Support Constraint . . . . . . . . . . . . . . . . . . . . . 92
3.10 Conclusions and Chapter Summary . . . . . . . . . . . . . . . . . . . . . . . 92
Table of Contents iii
4. Detection . . . . . . . . . . . . . . . . . . . . . . . . . . . . . . . . . . . . . . . . . . . . . . . . . 95
4.1 Introduction . . . . . . . . . . . . . . . . . . . . . . . . . . . . . . . . . . . . . . . . . . . 95
4.2 From Images to Catalogs . . . . . . . . . . . . . . . . . . . . . . . . . . . . . . . . 96
4.3 Multiscale Vision Model . . . . . . . . . . . . . . . . . . . . . . . . . . . . . . . . . 100
4.3.1 Introduction . . . . . . . . . . . . . . . . . . . . . . . . . . . . . . . . . . . . . 100
4.3.2 Multiscale Vision Model Definition . . . . . . . . . . . . . . . . . 101
4.3.3 From Wavelet Coefficients to Object Identification . . . . 101
4.3.4 Partial Reconstruction . . . . . . . . . . . . . . . . . . . . . . . . . . . . 104
4.3.5 Examples . . . . . . . . . . . . . . . . . . . . . . . . . . . . . . . . . . . . . . . 105
4.3.6 Application to ISOCAM Data Calibration . . . . . . . . . . . 109
4.4 Detection and Deconvolution . . . . . . . . . . . . . . . . . . . . . . . . . . . . . 113
4.5 Conclusion . . . . . . . . . . . . . . . . . . . . . . . . . . . . . . . . . . . . . . . . . . . . 115
4.6 Chapter Summary . . . . . . . . . . . . . . . . . . . . . . . . . . . . . . . . . . . . . . 116
5. Image Compression . . . . . . . . . . . . . . . . . . . . . . . . . . . . . . . . . . . . . . . 117
5.1 Introduction . . . . . . . . . . . . . . . . . . . . . . . . . . . . . . . . . . . . . . . . . . . 117
5.2 Lossy Image Compression Methods . . . . . . . . . . . . . . . . . . . . . . . 119
5.2.1 The Principle . . . . . . . . . . . . . . . . . . . . . . . . . . . . . . . . . . . . 119
5.2.2 Compression with Pyramidal Median Transform . . . . . 120
5.2.3 PMT and Image Compression . . . . . . . . . . . . . . . . . . . . . . 122
5.2.4 Compression Packages . . . . . . . . . . . . . . . . . . . . . . . . . . . . 125
5.2.5 Remarks on these Methods . . . . . . . . . . . . . . . . . . . . . . . . 126
5.3 Comparison . . . . . . . . . . . . . . . . . . . . . . . . . . . . . . . . . . . . . . . . . . . . 128
5.3.1 Quality Assessment . . . . . . . . . . . . . . . . . . . . . . . . . . . . . . . 128
5.3.2 Visual Quality . . . . . . . . . . . . . . . . . . . . . . . . . . . . . . . . . . . 129
5.3.3 First Aladin Project Study . . . . . . . . . . . . . . . . . . . . . . . . 132
5.3.4 Second Aladin Project Study . . . . . . . . . . . . . . . . . . . . . . 134
5.3.5 Computation Time . . . . . . . . . . . . . . . . . . . . . . . . . . . . . . . 139
5.3.6 Conclusion . . . . . . . . . . . . . . . . . . . . . . . . . . . . . . . . . . . . . . 140
5.4 Lossless Image Compression . . . . . . . . . . . . . . . . . . . . . . . . . . . . . 141
5.4.1 Introduction . . . . . . . . . . . . . . . . . . . . . . . . . . . . . . . . . . . . . 141
5.4.2 The Lifting Scheme . . . . . . . . . . . . . . . . . . . . . . . . . . . . . . . 141
5.4.3 Comparison . . . . . . . . . . . . . . . . . . . . . . . . . . . . . . . . . . . . . 145
5.5 Large Images: Compression and Visualization . . . . . . . . . . . . . . 146
5.5.1 Large Image Visualization Environment: LIVE . . . . . . . 146
5.5.2 Decompression by Scale and by Region . . . . . . . . . . . . . . 147
5.5.3 The SAO-DS9 LIVE Implementation . . . . . . . . . . . . . . . 149
5.6 Chapter Summary . . . . . . . . . . . . . . . . . . . . . . . . . . . . . . . . . . . . . . 150
6. Multichannel Data . . . . . . . . . . . . . . . . . . . . . . . . . . . . . . . . . . . . . . . . 153
6.1 Introduction . . . . . . . . . . . . . . . . . . . . . . . . . . . . . . . . . . . . . . . . . . . 153
6.2 The Wavelet-Karhunen-Lo`eve Transform . . . . . . . . . . . . . . . . . . 153
6.2.1 Definition . . . . . . . . . . . . . . . . . . . . . . . . . . . . . . . . . . . . . . . 153
6.2.2 Correlation Matrix and Noise Modeling . . . . . . . . . . . . . 154
6.2.3 Scale and Karhunen-Lo`eve Transform . . . . . . . . . . . . . . . 156
iv Table of Contents
6.2.4 The WT-KLT Transform . . . . . . . . . . . . . . . . . . . . . . . . . . 156
6.2.5 The WT-KLT Reconstruction Algorithm . . . . . . . . . . . . 157
6.3 Noise Modeling in the WT-KLT Space . . . . . . . . . . . . . . . . . . . . 157
6.4 Multichannel Data Filtering . . . . . . . . . . . . . . . . . . . . . . . . . . . . . 158
6.4.1 Introduction . . . . . . . . . . . . . . . . . . . . . . . . . . . . . . . . . . . . . 158
6.4.2 Reconstruction from a Subset of Eigenvectors . . . . . . . . 158
6.4.3 WT-KLT Coefficient Thresholding . . . . . . . . . . . . . . . . . . 160
6.4.4 Example: Astronomical Source Detection . . . . . . . . . . . . 160
6.5 The Haar-Multichannel Transform . . . . . . . . . . . . . . . . . . . . . . . . 160
6.6 Independent Component Analysis . . . . . . . . . . . . . . . . . . . . . . . . 161
6.7 Chapter Summary . . . . . . . . . . . . . . . . . . . . . . . . . . . . . . . . . . . . . . 162
7. An Entropic Tour of Astronomical Data Analysis . . . . . . . . . 165
7.1 Introduction . . . . . . . . . . . . . . . . . . . . . . . . . . . . . . . . . . . . . . . . . . . 165
7.2 The Concept of Entropy . . . . . . . . . . . . . . . . . . . . . . . . . . . . . . . . . 168
7.3 Multiscale Entropy . . . . . . . . . . . . . . . . . . . . . . . . . . . . . . . . . . . . . 174
7.3.1 Definition . . . . . . . . . . . . . . . . . . . . . . . . . . . . . . . . . . . . . . . 174
7.3.2 Signal and Noise Information . . . . . . . . . . . . . . . . . . . . . . 176
7.4 Multiscale Entropy Filtering . . . . . . . . . . . . . . . . . . . . . . . . . . . . . 179
7.4.1 Filtering . . . . . . . . . . . . . . . . . . . . . . . . . . . . . . . . . . . . . . . . 179
7.4.2 The Regularization Parameter . . . . . . . . . . . . . . . . . . . . . 179
7.4.3 Use of a Model . . . . . . . . . . . . . . . . . . . . . . . . . . . . . . . . . . . 181
7.4.4 The Multiscale Entropy Filtering Algorithm . . . . . . . . . 182
7.4.5 Optimization . . . . . . . . . . . . . . . . . . . . . . . . . . . . . . . . . . . . 183
7.4.6 Examples . . . . . . . . . . . . . . . . . . . . . . . . . . . . . . . . . . . . . . . 184
7.5 Deconvolution. . . . . . . . . . . . . . . . . . . . . . . . . . . . . . . . . . . . . . . . . . 188
7.5.1 The Principle . . . . . . . . . . . . . . . . . . . . . . . . . . . . . . . . . . . . 188
7.5.2 The Parameters . . . . . . . . . . . . . . . . . . . . . . . . . . . . . . . . . . 189
7.5.3 Examples . . . . . . . . . . . . . . . . . . . . . . . . . . . . . . . . . . . . . . . 189
7.6 Multichannel Data Filtering . . . . . . . . . . . . . . . . . . . . . . . . . . . . . 190
7.7 Background Fluctuation Analysis . . . . . . . . . . . . . . . . . . . . . . . . . 192
7.8 Relevant Information in an Image . . . . . . . . . . . . . . . . . . . . . . . . 195
7.9 Multiscale Entropy and Optimal Compressibility . . . . . . . . . . . 195
7.10 Conclusions and Chapter Summary . . . . . . . . . . . . . . . . . . . . . . . 196
8. Astronomical Catalog Analysis . . . . . . . . . . . . . . . . . . . . . . . . . . . 201
8.1 Introduction . . . . . . . . . . . . . . . . . . . . . . . . . . . . . . . . . . . . . . . . . . . 201
8.2 Two-Point Correlation Function . . . . . . . . . . . . . . . . . . . . . . . . . . 202
8.2.1 Introduction . . . . . . . . . . . . . . . . . . . . . . . . . . . . . . . . . . . . . 202
8.2.2 Determining the 2-Point Correlation Function . . . . . . . . 203
8.2.3 Error Analysis . . . . . . . . . . . . . . . . . . . . . . . . . . . . . . . . . . . 204
8.2.4 Correlation Length Determination . . . . . . . . . . . . . . . . . . 205
8.2.5 Creation of Random Catalogs . . . . . . . . . . . . . . . . . . . . . . 205
8.2.6 Examples . . . . . . . . . . . . . . . . . . . . . . . . . . . . . . . . . . . . . . . 206
8.3 Fractal Analysis . . . . . . . . . . . . . . . . . . . . . . . . . . . . . . . . . . . . . . . . 211
Table of Contents v
8.3.1 Introduction . . . . . . . . . . . . . . . . . . . . . . . . . . . . . . . . . . . . . 211
8.3.2 The Hausdorff and Minkowski Measures . . . . . . . . . . . . . 212
8.3.3 The Hausdorff and Minkowski Dimensions . . . . . . . . . . . 212
8.3.4 Multifractality . . . . . . . . . . . . . . . . . . . . . . . . . . . . . . . . . . . 213
8.3.5 Generalized Fractal Dimension . . . . . . . . . . . . . . . . . . . . . 214
8.3.6 Wavelet and Multifractality . . . . . . . . . . . . . . . . . . . . . . . . 215
8.4 Spanning Trees and Graph Clustering . . . . . . . . . . . . . . . . . . . . . 220
8.5 Voronoi Tessellation and Percolation . . . . . . . . . . . . . . . . . . . . . . 221
8.6 Model-Based Clustering . . . . . . . . . . . . . . . . . . . . . . . . . . . . . . . . . 222
8.6.1 Modeling of Signal and Noise . . . . . . . . . . . . . . . . . . . . . . 222
8.6.2 Application to Thresholding . . . . . . . . . . . . . . . . . . . . . . . 224
8.7 Wavelet Analysis . . . . . . . . . . . . . . . . . . . . . . . . . . . . . . . . . . . . . . . 224
8.8 Nearest Neighbor Clutter Removal . . . . . . . . . . . . . . . . . . . . . . . . 225
8.9 Chapter Summary . . . . . . . . . . . . . . . . . . . . . . . . . . . . . . . . . . . . . . 226
9. Multiple Resolution in Data Storage and Retrieval . . . . . . . 229
9.1 Introduction . . . . . . . . . . . . . . . . . . . . . . . . . . . . . . . . . . . . . . . . . . . 229
9.2 Wavelets in Database Management . . . . . . . . . . . . . . . . . . . . . . . 229
9.3 Fast Cluster Analysis . . . . . . . . . . . . . . . . . . . . . . . . . . . . . . . . . . . 231
9.4 Nearest Neighbor Finding on Graphs . . . . . . . . . . . . . . . . . . . . . . 233
9.5 Cluster-Based User Interfaces . . . . . . . . . . . . . . . . . . . . . . . . . . . . 234
9.6 Images from Data . . . . . . . . . . . . . . . . . . . . . . . . . . . . . . . . . . . . . . 235
9.6.1 Matrix Sequencing. . . . . . . . . . . . . . . . . . . . . . . . . . . . . . . . 235
9.6.2 Filtering Hypertext . . . . . . . . . . . . . . . . . . . . . . . . . . . . . . . 239
9.6.3 Clustering Document-Term Data . . . . . . . . . . . . . . . . . . . 240
9.7 Chapter Summary . . . . . . . . . . . . . . . . . . . . . . . . . . . . . . . . . . . . . . 245
10. Towards the Virtual Observatory . . . . . . . . . . . . . . . . . . . . . . . . . 247
10.1 Data and Information . . . . . . . . . . . . . . . . . . . . . . . . . . . . . . . . . . . 247
10.2 The Information Handling Challenges Facing Us . . . . . . . . . . . . 249
References . . . . . . . . . . . . . . . . . . . . . . . . . . . . . . . . . . . . . . . . . . . . . . . . . . . . 250
Appendix A: A Trous Wavelet Transform . . . . . . . . . . . . . . . . . . . . . 269
Appendix B: Picard Iteration . . . . . . . . . . . . . . . . . . . . . . . . . . . . . . . . . 275
Appendix C: Wavelet Transform using the Fourier Transform 277
Appendix D: Derivative Needed for the Minimization . . . . . . . . 281
Appendix E: Generalization of the Derivative Needed for the
Minimization . . . . . . . . . . . . . . . . . . . . . . . . . . . . . . . . . . . . . . . . . . . . . 285
Appendix F: Software and Related Developments . . . . . . . . . . . . . 287
vi Table of Contents
Index . . . . . . . . . . . . . . . . . . . . . . . . . . . . . . . . . . . . . . . . . . . . . . . . . . . . . . . . . 289
Preface
When we consider the ever increasing amount of astronomical data available
to us, we can well say that the needs of modern astronomy are growing by
the day. Ever better observing facilities are in operation. The fusion of infor-
mation leading to the coordination of observations is of central importance.
The methods described in this book can provide effective and efficient
ripostes to many of these issues. Much progress has been made in recent
years on the methodology front, in line with the rapid pace of evolution of
our technological infrastructures.
The central themes of this book are information and scale. The approach is
astronomy-driven, starting with real problems and issues to be addressed. We
then proceed to comprehensive theory, and implementations of demonstrated
efficacy.
The field is developing rapidly. There is little doubt that further important
papers, and books, will follow in the future.
Colleagues we would like to acknowledge include: Alexandre Aussem, Al-
bert Bijaoui, Fran¸cois Bonnarel, Jonathan G. Campbell, Ghada Jammal,
Ren´e Gastaud, Pierre-Fran¸cois Honor´e, Bruno Lopez, Mireille Louys, Clive
Page, Eric Pantin, Philippe Querre, Victor Racine, J´erˆome Rodriguez, and
Ivan Valtchanov.
The cover image is from Jean-Charles Cuillandre. It shows a five minute
exposure (five 60-second dithered and stacked images), R filter, taken with
CFH12K wide field camera (100 million pixels) at the primary focus of
the CFHT in July 2000. The image is from an extremely rich zone of our
Galaxy, containing star formation regions, dark nebulae (molecular clouds
and dust regions), emission nebulae (H
α
), and evolved stars which are scat-
tered throughout the field in their two-dimensional projection effect. This
zone is in the constellation of Saggitarius.
Jean-Luc Starck
Fionn Murtagh
viii Preface
1. Introduction to Applications and Methods
1.1 Introduction
“May you live in interesting times!” ran the old Chinese wish. The early
years of the third millennium are interesting times for astronomy, as a result
of the tremendous advances in our computing and information processing
environment and infrastructure. The advances in signal and image processing
methods described in this book are of great topicality as a consequence.
Let us look at some of the overriding needs of contemporary observational
astronomical.
Unlike in Earth observation or meteorology, astronomers do not want to
interpret data and, having done so, delete it. Variable objects (supernovae,
comets, etc.) bear witness to the need for astronomical data to be available
indefinitely. The unavoidable problem is the sheer overwhelming quantity
of data which is now collected. The only basis for selective choice for what
must be kept long-term is to associate more closely the data capture with
the information extraction and knowledge discovery processes. We have got
to understand our scientific knowledge discovery mechanisms better in or-
der to make the correct selection of data to keep long-term, including the
appropriate resolution and refinement levels.
The vast quantities of visual data collected now and in the future present
us with new problems and opportunities. Critical needs in our software sys-
tems include compression and progressive transmission, support for differen-
tial detail and user navigation in data spaces, and “thinwire” transmission
and visualization. The technological infrastructure is one side of the picture.
Another side of this same picture, however, is that our human ability to
interpret vast quantities of data is limited. A study by D. Williams, CERN,
has quantified the maximum possible volume of data which can conceivably
be interpreted at CERN. This points to another more fundamental justifica-
tion for addressing the critical technical needs indicated above. This is that
selective and prioritized transmission, which we will term intelligent stream-
ing, is increasingly becoming a key factor in human understanding of the
real world, as mediated through our computing and networking base. We
need to receive condensed, summarized data first, and we can be aided in
our understanding of the data by having more detail added progressively. A
hyperlinked and networked world makes this need for summarization more
2 1. Introduction to Applications and Methods
and more acute. We need to take resolution scale into account in our infor-
mation and knowledge spaces. This is a key aspect of an intelligent streaming
system.
A further area of importance for scientific data interpretation is that of
storage and display. Long-term storage of astronomical data, we have al-
ready noted, is part and parcel of our society’s memory (a formulation due
to Michael Kurtz, Center for Astrophysics, Smithsonian Institute). With the
rapid obsolescence of storage devices, considerable efforts must be undertaken
to combat social amnesia. The positive implication is the ever-increasing
complementarity of professional observational astronomy with education and
public outreach.
Astronomy’s data centers and image and catalog archives play an im-
portant role in our society’s collective memory. For example, the SIMBAD
database of astronomical objects at Strasbourg Observatory contains data on
3 million objects, based on 7.5 million object identifiers. Constant updating
of SIMBAD is a collective cross-institutional effort. The MegaCam camera at
the Canada-France-Hawaii Telescope (CFHT), Hawaii, is producing images of
dimensions 16000 ×16000, 32-bits per pixel. The European Southern Obser-
vatory’s VLT (Very Large Telescope) is beginning to produce vast quantities
of very large images. Increasingly, images of size 1 GB or 2 GB, for a single
image, are not exceptional. CCD detectors on other telescopes, or automatic
plate scanning machines digitizing photographic sky surveys, produce lots
more data. Resolution and scale are of key importance, and so also is region
of interest. In multiwavelength astronomy, the fusion of information and data
is aimed at, and this can be helped by the use of resolution similar to our
human cognitive processes. Processing (calibration, storage and transmission
formats and approaches) and access have not been coupled as closely as they
could be. Knowledge discovery is the ultimate driver.
Many ongoing initiatives and projects are very relevant to the work de-
scribed in later chapters.
Image and Signal Processing. The major areas of application of image
and signal processing include the following.
– Visualization: Seeing our data and signals in a different light is very often
a revealing and fruitful thing to do. Examples of this will be presented
throughout this book.
– Filtering: A signal in the physical sciences rarely exists independently of
noise, and noise removal is therefore a useful preliminary to data inter-
pretation. More generally, data cleaning is needed, to bypass instrumental
measurement artifacts, and even the inherent complexity of the data. Image
and signal filtering will be presented in Chapter 2.
– Deconvolution: Signal “deblurring” is used for reasons similar to filter-
ing, as a preliminary to signal interpretation. Motion deblurring is rarely
important in astronomy, but removing the effects of atmospheric blurring,
or quality of seeing, certainly is of importance. There will be a wide-ranging
1.1 Introduction 3
discussion of the state of the art in deconvolution in astronomy in Chapter
3.
– Compression: Consider three different facts. Long-term storage of astro-
nomical data is important. A current trend is towards detectors accom-
modating ever-larger image sizes. Research in astronomy is a cohesive but
geographically distributed activity. All three facts point to the importance
of effective and efficient compression technology. In Chapter 5, the state of
the art in astronomical image compression will be surveyed.
– Mathematical morphology: Combinations of dilation and erosion op-
erators, giving rise to opening and closing operations, in boolean images
and in greyscale images, allow for a truly very esthetic and immediately
practical processing framework. The median function plays its role too in
the context of these order and rank functions. Multiple scale mathematical
morphology is an immediate generalization. There is further discussion on
mathematical morphology below in this chapter.
– Edge detection: Gradient information is not often of central importance
in astronomical image analysis. There are always exceptions of course.
– Segmentation and pattern recognition: These are discussed in Chap-
ter 4, dealing with object detection. In areas outside astronomy, the term
feature selection is more normal than object detection.
– Multidimensional pattern recognition: General multidimensional
spaces are analyzed by clustering methods, and by dimensionality mapping
methods. Multiband images can be taken as a particular case. Such meth-
ods are pivotal in Chapter 6 on multichannel data, 8 on catalog analysis,
and 9 on data storage and retrieval.
– Hough and Radon transforms, leading to 3D tomography and
other applications: Detection of alignments and curves is necessary for
many classes of segmentation and feature analysis, and for the building
of 3D representations of data. Gravitational lensing presents one area of
potential application in astronomy imaging, although the problem of faint
signal and strong noise is usually the most critical one. In the future we
will describe how the ridgelet and curvelet transforms offer powerful gen-
eralizations of current state of the art ways of addressing problems in these
fields.
A number of outstanding general texts on image and signal processing
are available. These include Gonzalez and Woods (1992), Jain (1990), Pratt
(1991), Parker (1996), Castleman (1995), Petrou and Bosdogianni (1999),
Bovik (2000). A text of ours on image processing and pattern recognition
is available on-line (Campbell and Murtagh, 2001). Data analysis texts of
importance include Bishop (1995), and Ripley (1995).
4 1. Introduction to Applications and Methods
1.2 Transformation and Data Representation
Many different transforms are used in data processing, – Haar, Radon,
Hadamard, etc. The Fourier transform is perhaps the most widely used.
The goal of these transformations is to obtain a sparse representation of the
data, and to pack most information into a small number of samples. For
example, a sine signal f(t) = sin(2πνt), defined on N pixels, requires only
two samples (at frequencies −ν and ν) in the Fourier domain for an exact
representation. Wavelets and related multiscale representations pervade all
areas of signal processing. The recent inclusion of wavelet algorithms in JPEG
2000 – the new still-picture compression standard – testifies to this lasting
and significant impact. The reason for the success of wavelets is due to the
fact that wavelet bases represent well a large class of signals. Therefore this
allows us to detect roughly isotropic elements occurring at all spatial scales
and locations. Since noise in the physical sciences is often not Gaussian,
modeling in wavelet space of many kind of noise – Poisson noise, combination
of Gaussian and Poisson noise components, non-stationary noise, and so on
– has been a key motivation for the use of wavelets in scientific, medical, or
industrial applications. The wavelet transform has also been extensively used
in astronomical data analysis during the last ten years. A quick search with
ADS (NASA Astrophysics Data System, adswww.harvard.edu) shows that
around 500 papers contain the keyword “wavelet” in their abstract, and this
holds for all astrophysical domains, from study of the sun through to CMB
(Cosmic Microwave Background) analysis:
– Sun: active region oscillations (Ireland et al., 1999; Blanco et al., 1999),
determination of solar cycle length variations (Fligge et al., 1999), fea-
ture extraction from solar images (Irbah et al., 1999), velocity fluctuations
(Lawrence et al., 1999).
– Solar system: asteroidal resonant motion (Michtchenko and Nesvorny,
1996), classification of asteroids (Bendjoya, 1993), Saturn and Uranus ring
analysis (Bendjoya et al., 1993; Petit and Bendjoya, 1996).
– Star studies: Ca II feature detection in magnetically active stars (Soon
et al., 1999), variable star research (Szatmary et al., 1996).
– Interstellar medium: large-scale extinction maps of giant molecular clouds
using optical star counts (Cambr´esy, 1999), fractal structure analysis in
molecular clouds (Andersson and Andersson, 1993).
– Planetary nebula detection: confirmation of the detection of a faint plan-
etary nebula around IN Com (Brosch and Hoffman, 1999), evidence for
extended high energy gamma-ray emission from the Rosette/Monoceros
Region (Jaffe et al., 1997).
– Galaxy: evidence for a Galactic gamma-ray halo (Dixon et al., 1998).
– QSO: QSO brightness fluctuations (Schild, 1999), detecting the non-
Gaussian spectrum of QSO Ly
α
absorption line distribution (Pando and
Fang, 1998).
– Gamma-ray burst: GRB detection (Kolaczyk, 1997; Norris et al., 1994)
and GRB analysis (Greene et al., 1997; Walker et al., 2000).
1.2 Transformation and Data Representation 5
– Black hole: periodic oscillation detection (Steiman-Cameron et al., 1997;
Scargle, 1997)
– Galaxies: starburst detection (Hecquet et al., 1995), galaxy counts (Aus-
sel et al., 1999; Damiani et al., 1998), morphology of galaxies (Weistrop
et al., 1996; Kriessler et al., 1998), multifractal character of the galaxy
distribution (Martinez et al., 1993).
– Galaxy cluster: sub-structure detection (Pierre and Starck, 1998; Krywult
et al., 1999; Arnaud et al., 2000), hierarchical clustering (Pando et al.,
1998a), distribution of superclusters of galaxies (Kalinkov et al., 1998).
– Cosmic Microwave Background: evidence for scale-scale correlations in
the Cosmic Microwave Background radiation in COBE data (Pando et al.,
1998b), large-scale CMB non-Gaussian statistics (Popa, 1998; Aghanim
et al., 2001), massive CMB data set analysis (Gorski, 1998).
– Cosmology: comparing simulated cosmological scenarios with observations
(Lega et al., 1996), cosmic velocity field analysis (Rauzy et al., 1993).
This broad success of the wavelet transform is due to the fact that astro-
nomical data generally gives rise to complex hierarchical structures, often
described as fractals. Using multiscale approaches such as the wavelet trans-
form, an image can be decomposed into components at different scales, and
the wavelet transform is therefore well-adapted to the study of astronomical
data.
This section reviews briefly some of the existing transforms.
1.2.1 Fourier Analysis
The Fast Fourier Transform. The Fourier transform of a continuous func-
tion f (t) is defined by:
ˆ
f(ν) =
+∞
−∞
f(t)e
−i2πνt
dt (1.1)
and the inverse Fourier transform is:
f(t) =
+∞
−∞
ˆ
f(ν)e
i2πνt
du (1.2)
The discrete Fourier transform is given by:
ˆ
f(u) =
1
N
+∞
k=−∞
f(k)e
−i2π
uk
N
(1.3)
and the inverse discrete Fourier transform is:
ˆ
f(k) =
+∞
u=−∞
f(u)e
i2π
uk
N
(1.4)
In the case of images (two variables), this is:
6 1. Introduction to Applications and Methods
ˆ
f(u, v) =
1
MN
+∞
l=−∞
+∞
k=−∞
f(k, l)e
−2iπ(
uk
M
+
vl
N
)
f(k, l) =
+∞
u=−∞
+∞
v=−∞
ˆ
f(u, v)e
2iπ(
uk
M
+
vl
N
)
(1.5)
Since
ˆ
f(u, v) is generally complex, this can be written using its real and
imaginary parts:
ˆ
f(u, v) = Re[
ˆ
f(u, v)] + iIm[
ˆ
f(u, v)] (1.6)
with:
Re[
ˆ
f(u, v)] =
1
MN
+∞
l=−∞
+∞
k=−∞
f(k, l) cos(2π
uk
M
+
vl
N
)
Im[
ˆ
f(u, v)] = −
1
MN
+∞
l=−∞
+∞
k=−∞
f(k, l) sin(2π
uk
M
+
vl
N
) (1.7)
It can also be written using its modulus and argument:
ˆ
f(u, v) = |
ˆ
f(u, v) | e
i arg
ˆ
f(u,v)
(1.8)
|
ˆ
f(u, v) |
2
is called the power spectrum, and
Θ(u, v) = arg
ˆ
f(u, v) the phase.
Two other related transforms are the cosine and the sine transforms. The
discrete cosine transform is defined by:
DCT(u, v) =
1
√
2N
c(u)c(v)
N−1
k=0
N−1
l=0
f(k, l) cos
(2k + 1)uπ
2N
cos
(2l + 1)vπ
2N
IDCT(k, l) =
1
√
2N
N−1
u=0
N−1
v=0
c(u)c(v)DCT(u, v) cos
(2k + 1)uπ
2N
cos
(2l + 1)vπ
2N
with c(i) =
1
√
2
when i = 0 and 1 otherwise.
1.2.2 Time-Frequency Representation
The Wigner-Ville Transform. The Wigner-Ville distribution (Wigner,
1932; Ville, 1948) of a signal s(t) is
W (t, ν) =
1
2π
s
∗
(t −
1
2
τ)s(t +
1
2
τ)e
−iτ2πν
dτ (1.9)
where s
∗
is the conjugate of s. The Wigner-Ville transform is always real
(even for a complex signal). In practice, its use is limited by the existence
of interference terms, even if they can be attenuated using specific averaging
approaches. More details can be found in (Cohen, 1995; Mallat, 1998).
1.2 Transformation and Data Representation 7
The Short-Term Fourier Transform. The Short-Term Fourier Transform
of a 1D signal f is defined by:
ST F T (t, ν) =
+∞
−∞
e
−j2πντ
f(τ)g(τ − t)dτ (1.10)
If g is the Gaussian window, this corresponds to the Gabor transform.
The energy density function, called the spectrogram, is given by:
SP EC(t, ν) =| STFT(t, ν) |
2
=|
+∞
−∞
e
−j2πντ
f(τ)g(τ − t)dτ |
2
(1.11)
Fig. 1.1 shows a quadratic chirp s(t) = sin(
πt
3
3N
2
), N being the number of
pixels and t ∈ {1, , N}, and its spectrogram.
Fig. 1.1. Left, a quadratic chirp and, right, its spectrogram. The y-axis in the
sp ectrogram represents the frequency axis, and the x-axis the time. In this example,
the instantaneous frequency of the signal increases with the time.
The inverse transform is obtained by:
f(t) =
+∞
−∞
g(t − τ )
+∞
−∞
e
j2πντ
ST F T (τ, ν)dνdτ (1.12)
Example: QPO analysis. Fig. 1.2, top, shows an X-ray light curve from
a galactic binary system, formed from two stars of which one has collapsed
to a compact object, very probably a black hole of a few solar masses. Gas
from the companion star is attracted to the black hole and forms an accretion
disk around it. Turbulence occurs in this disk, which causes the gas to accrete
slowly to the black hole. The X-rays we see come from the disk and its corona,
heated by the energy released as the gas falls deeper into the potential well of
the black hole. The data were obtained by RXTE, an X-ray satellite dedicated
to the observation of this kind of source, and in particular their fast variability
8 1. Introduction to Applications and Methods
Fig. 1.2. Top, QPO X-ray light curve, and bottom its spectrogram.
which gives us information on the processes in the disk. In particular they
show sometimes a QPO (quasi-periodic oscillation) at a varying frequency of
the order of 1 to 10 Hz (see Fig. 1.2, bottom), which probably corresponds
to a standing feature rotating in the disk.
1.2.3 Time-Scale Representation: The Wavelet Transform
The Morlet-Grossmann definition (Grossmann et al., 1989) of the continuous
wavelet transform for a 1-dimensional signal f(x) ∈ L
2
(R), the space of all
1.2 Transformation and Data Representation 9
square integrable functions, is:
W (a, b) =
1
√
a
+∞
−∞
f(x)ψ
∗
x −b
a
dx (1.13)
where:
– W (a, b) is the wavelet coefficient of the function f(x)
– ψ(x) is the analyzing wavelet
– a (> 0) is the scale parameter
– b is the position parameter
The inverse transform is obtained by:
f(x) =
1
C
χ
+∞
0
+∞
−∞
1
√
a
W (a, b)ψ
x −b
a
da db
a
2
(1.14)
where:
C
ψ
=
+∞
0
ˆ
ψ
∗
(ν)
ˆ
ψ(ν)
ν
dν =
0
−∞
ˆ
ψ
∗
(ν)
ˆ
ψ(ν)
ν
dν (1.15)
Reconstruction is only possible if C
ψ
is defined (admissibility condition)
which implies that
ˆ
ψ(0) = 0, i.e. the mean of the wavelet function is 0.
-4 -2 0 2 4
-0.4 -0.2 0.0 0.2 0.4 0.6 0.8 1.0
Fig. 1.3. Mexican hat function.
Fig. 1.3 shows the Mexican hat wavelet function, which is defined by:
g(x) = (1 − x
2
)e
−x
2
/2
(1.16)
This is the second derivative of a Gaussian. Fig. 1.4 shows the continuous
wavelet transform of a 1D signal computed with the Mexican Hat wavelet.
This diagram is called a scalogram. The y-axis represents the scale.
10 1. Introduction to Applications and Methods
Fig. 1.4. Continuous wavelet transform of a 1D signal computed with the Mexican
Hat wavelet.
The Orthogonal Wavelet Transform. Many discrete wavelet transform
algorithms have been developed (Mallat, 1998; Starck et al., 1998a). The
most widely-known one is certainly the orthogonal transform, proposed by
Mallat (1989) and its bi-orthogonal version (Daubechies, 1992). Using the
orthogonal wavelet transform, a signal s can be decomposed as follows:
s(l) =
k
c
J,k
φ
J,l
(k) +
k
J
j=1
ψ
j,l
(k)w
j,k
(1.17)
with φ
j,l
(x) = 2
−j
φ(2
−j
x − l) and ψ
j,l
(x) = 2
−j
ψ(2
−j
x − l), where φ and
ψ are respectively the scaling function and the wavelet function. J is the
number of resolutions used in the decomposition, w
j
the wavelet (or detail)
coefficients at scale j, and c
J
is a coarse or smooth version of the original
1.2 Transformation and Data Representation 11
signal s. Thus, the algorithm outputs J + 1 subband arrays. The indexing
is such that, here, j = 1 corresponds to the finest scale (high frequencies).
Coefficients c
j,k
and w
j,k
are obtained by means of the filters h and g:
c
j+1,l
=
k
h(k − 2l)c
j,k
w
j+1,l
=
k
g(k −2l)c
j,k
(1.18)
where h and g verify:
1
2
φ(
x
2
) =
k
h(k)φ(x −k)
1
2
ψ(
x
2
) =
k
g(k)φ(x − k) (1.19)
and the reconstruction of the signal is performed with:
c
j,l
= 2
k
[
˜
h(k + 2l)c
j+1,k
+ ˜g(k + 2l)w
j+1,k
] (1.20)
where the filters
˜
h and ˜g must verify the conditions of dealiasing and exact
reconstruction:
ˆ
h
ν +
1
2
ˆ
˜
h(ν) + ˆg
ν +
1
2
ˆ
˜g(ν) = 0
ˆ
h(ν)
ˆ
˜
h(ν) + ˆg(ν)
ˆ
˜g(ν) = 1 (1.21)
The two-dimensional algorithm is based on separate variables leading to
prioritizing of horizontal, vertical and diagonal directions. The scaling func-
tion is defined by φ(x, y) = φ(x)φ(y), and the passage from one resolution to
the next is achieved by:
c
j+1
(k
x
, k
y
) =
+∞
l
x
=−∞
+∞
l
y
=−∞
h(l
x
− 2k
x
)h(l
y
− 2k
y
)f
j
(l
x
, l
y
) (1.22)
The detail signal is obtained from three wavelets:
– vertical wavelet : ψ
1
(x, y) = φ(x)ψ(y)
– horizontal wavelet: ψ
2
(x, y) = ψ(x)φ(y)
– diagonal wavelet: ψ
3
(x, y) = ψ(x)ψ(y)
which leads to three wavelet subimages at each resolution level. For three di-
mensional data, seven wavelet subcubes are created at each resolution level,
corresponding to an analysis in seven directions. Other discrete wavelet trans-
forms exist. The `a trous wavelet transform which is very well-suited for as-
tronomical data is discussed in the next chapter, and described in detail in
Appendix A.
12 1. Introduction to Applications and Methods
1.2.4 The Radon Transform
The Radon transform of an object f is the collection of line integrals indexed
by (θ, t) ∈ [0, 2π) × R given by
Rf(θ, t) =
f(x
1
, x
2
)δ(x
1
cos θ + x
2
sin θ −t) dx
1
dx
2
, (1.23)
where δ is the Dirac distribution. The two-dimensional Radon transform maps
the spatial domain (x, y) to the Radon domain (θ, t), and each point in the
Radon domain corresponds to a line in the spatial domain. The transformed
image is called a sinogram (Liang and Lauterbur, 2000).
A fundamental fact about the Radon transform is the projection-slice
formula (Deans, 1983):
ˆ
f(λ cos θ, λ sin θ) =
Rf(t, θ)e
−iλt
dt.
This says that the Radon transform can be obtained by applying the one-
dimensional inverse Fourier transform to the two-dimensional Fourier trans-
form restricted to radial lines going through the origin.
This of course suggests that approximate Radon transforms for digital
data can be based on discrete fast Fourier transforms. This is a widely used
approach, in the literature of medical imaging and synthetic aperture radar
imaging, for which the key approximation errors and artifacts have been
widely discussed. See (Toft, 1996; Averbuch et al., 2001) for more details
on the different Radon transform and inverse transform algorithms. Fig. 1.5
shows an image containing two lines and its Radon transform. In astronomy,
the Radon transform has been proposed for the reconstruction of images
obtained with a rotating Slit Aperture Telescope (Touma, 2000), for the
BATSE experiment of the Compton Gamma Ray Observatory (Zhang et al.,
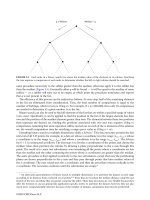
1993), and for robust detection of satellite tracks (Vandame, 2001). The
Hough transform, which is closely related to the Radon transform, has been
used by Ballester (1994) for automated arc line identification, by Llebaria
(1999) for analyzing the temporal evolution of radial structures on the solar
corona, and by Ragazzoni and Barbieri (1994) for the study of astronomical
light curve time series.
1.3 Mathematical Morphology
Mathematical morphology is used for nonlinear filtering. Originally devel-
oped by Matheron (1967; 1975) and Serra (1982), mathematical morphology
is based on two operators: the infimum (denoted ∧) and the supremum (de-
noted ∨). The infimum of a set of images is defined as the greatest lower
bound while the supremum is defined as the least upper bound. The basic
morphological transformations are erosion, dilation, opening and closing. For
grey-level images, they can be defined in the following way:
1.3 Mathematical Morphology 13
Fig. 1.5. Left, image with two lines and Gaussian noise. Right, its Radon transform.
– Dilation consists of replacing each pixel of an image by the maximum of
its neighbors.
δ
B
(f) =
b∈B
f
b
where f stands for the image, and B denotes the structuring element,
typically a small convex set such as a square or disk.
The dilation is commonly known as “fill”, “expand”, or “grow.” It can
be used to fill “holes” of a size equal to or smaller than the structuring
element. Used with binary images, where each pixel is either 1 or 0, dilation
is similar to convolution. At each pixel of the image, the origin of the
structuring element is overlaid. If the image pixel is nonzero, each pixel
of the structuring element is added to the result using the “or” logical
operator.
– Erosion consists of replacing each pixel of an image by the minimum of its
neighbors:
ǫ
B
(f) =
b∈B
f
−b
where f stands for the image, and B denotes the structuring element.
Erosion is the dual of dilation. It does to the background what dilation
does to the foreground. This operator is commonly known as “shrink” or
“reduce”. It can be used to remove islands smaller than the structuring
element. At each pixel of the image, the origin of the structuring element
is overlaid. If each nonzero element of the structuring element is contained
in the image, the output pixel is set to one.
– Opening consists of doing an erosion followed by a dilation.
α
B
= δ
B
ǫ
B
and α
B
(f) = f ◦B
14 1. Introduction to Applications and Methods
– Closing consists of doing a dilation followed by an erosion.
β
B
= ǫ
B
δ
B
and β
B
(f) = f •B
In a more general way, opening and closing refer to morphological filters
which respect some specific properties (Breen et al., 2000). Such morpho-
logical filters were used for removing “cirrus-like” emission from far-infrared
extragalactic IRAS fields (Appleton et al., 1993), and for astronomical image
compression (Huang and Bijaoui, 1991).
The skeleton of an object in an image is a set of lines that reflect the shape
of the object. The set of skeletal pixels can be considered to be the medial axis
of the object. More details can be found in (Soille, 1999; Breen et al., 2000).
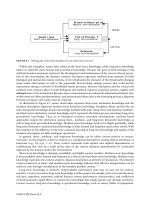
Fig. 1.6 shows an example of the application of the morphological operators
Fig. 1.6. Application of the morphological operators with a square binary structur-
ing element. Top, from left to right, original image and images obtained by erosion
and dilation. Bottom, images obtained respectively by the opening, closing and
skeleton operators.
with a square binary structuring element.
Undecimated Multiscale Morphological Transform. Mathematical mor-
phology has been up to now considered as another way to analyze data, in
competition with linear methods. But from a multiscale point of view (Starck
et al., 1998a; Goutsias and Heijmans, 2000; Heijmans and Goutsias, 2000),
mathematical morphology or linear methods are just filters allowing us to go
from a given resolution to a coarser one, and the multiscale coefficients are
then analyzed in the same way.
By choosing a set of structuring elements B
j
having a size increasing with
j, we can define an undecimated morphological multiscale transform by
1.4 Edge Detection 15
c
j+1,l
= M
j
(c
j
)(l)
w
j+1,l
= c
j,l
− c
j+1,l
(1.24)
where M
j
is a morphological filter (erosion, opening, etc.) using the struc-
turing element B
j
. An example of B
j
is a box of size (2
j
+ 1) ×(2
j
+ 1). Since
the detail signal w
j+1
is obtained by calculating a simple difference between
the c
j
and c
j+1
, the reconstruction is straightforward, and is identical to the
reconstruction relative to the “`a trous” wavelet transform (see Appendix A).
An exact reconstruction of the image c
0
is obtained by:
c
0,l
= c
J,l
+
J
j=1
w
j,l
(1.25)
where J is the number of scales used in the decomposition. Each scale has
the same number N of samples as the original data. The total number of
pixels in the transformation is (J + 1)N.
1.4 Edge Detection
An edge is defined as a local variation of image intensity. Edges can be de-
tected by the computation of a local derivative operator.
Fig. 1.7. First and second derivative of G
σ
∗ f. (a) Original signal, (b) signal
convolved by a Gaussian, (c) first derivative of (b), (d) second derivative of (b).
Fig. 1.7 shows how the inflection point of a signal can be found from its
first and second derivative. Two methods can be used for generating first
order derivative edge gradients.