Cs224W 2018 96
Bạn đang xem bản rút gọn của tài liệu. Xem và tải ngay bản đầy đủ của tài liệu tại đây (6.13 MB, 9 trang )
Network Analysis of Coordinated Iranian Tweets
Keshav Santhanam
Lakshmi Manoharan
Nishit Asnani
Abstract
The widespread impact of social media in shaping public
opinion makes platforms such as Twitter and Facebook the
primary targets of foreign actors seeking to affect electoral
outcomes and policy changes. To enable further research
on these efforts, Twitter has released a dataset of tweets
posted by potentially state-backed Iranian influencers. In
this project we analyze the Iranian tweets dataset to determine how information spreads through a network of such
users. We identify the characteristics of these users, how
they interact and coordinate attacks to spread information,
and what issues they target to shape public opinion. We find
that the Iranian operation functioned as a mechanism by
which tweets that supported the Iranian agenda, originated
by both reputable news outlets as well as suspected state
actors, were amplified through coordinated activity.
1. Introduction
Recent elections across the world have been heavily scrutinized due to allegations of foreign influence in the form of
coordinated social media disruption. As a result, researchers
in the field of network analysis have begun to study how
these operations were able to affect voters. In parallel, Facebook, Twitter and their peers have also been actively analyzing their own data of social feeds to determine how misinformation and polarizing content originates and spreads through
their networks. Therefore researchers and outside observers
alike have developed widespread interest in understanding
targeted influence campaigns, spurred by the convergence
of relevant technology and events of worldwide impact to
provide context to such analysis.
To accelerate research on foreign influence on elections,
Twitter has released a dataset of tweets authored by the
Russia-linked Internet Research Agency as well as Iranian
operatives. These datasets present an opportunity to study indepth the coordinated efforts put forth by these agencies to
advance foreign agendas. In this paper, we perform several
analyses on the Iranian tweet dataset to answer the following
questions:
1. Can we characterize Iranian users linked to the state-
backed campaigns in a twitter user / tweet network?
2. How do these actors spread information and promote
their agenda?
3. What are the issues that these actors care about and how
does the relevance of these issues vary over time?
To address the above, we use several network analysis
techniques including structural analysis to identify major
node roles and cascade exploration and k-core decomposition to study the spread of information through the network.
Ultimately we find that the Iranian operation used its influence to shape discussion on its preferred policy objectives.
The rest of this paper proceeds as follows. § 2 examines
previous efforts to characterize network phenomena pertaining to the spread of polarizing and controversial social media
content. § 3 introduces the Iranian tweet dataset and highlights notable properties. § 4 details the graph algorithms we
use to conduct our analyses. § 5 presents the key findings of
our study, and § 6 concludes.
2. Previous Work
This section provides a brief overview of previous work
that have tried to identify or characterize political influencers
on Twitter or quantify controversy.
2.1. Scope and Operational Characteristics in Twitter Data
A recent study by Griffin et al. [4] uses unsupervised
methods to analyze a Twitter dataset (acquired form NBC)
of alleged Russian trolls claimed to be attempting to influence the 2016 US Presidential elections. They analyze the
contents of the tweets, the language in which they are posted
and the posting behavior of the most active tweets using
natural language techniques, Fourier analysis and manifold
learning on the tweet data. While their study reports finding
user communities that are potential trolls, it does not distinguish between trolls and merely politically inclined Twitter
users.
2.2. Quantifying Controversy
Garimella et al. discuss methods for quantifying controversy among Twitter users [3]. They propose modeling a
conversation graph, where the nodes represent Twitter users
and the edges represent interactions between the users, including tweets, retweets and replies. The authors argue that
such a conversation graph involving a controversy would
have a highly clustered structured, leading to two strongly
clustered subgraphs with weak interconnections. They suggest that this cohesive structure within the community could
be due to the echo chamber effect by which proponents of
each side of the controversy amplify each others’ argument.
2.3. Dynamics of Political Hashtags
Barash et al. [2] study the diffusion of contagious phenomena in the context of political and news-related hashtags
among Russian-speaking Twitter users between 2007-11.
Their study explores the problem of contagion diffusion in
two different dimensions: (1) dynamics: the temporal properties of hashtags and (2) dispersion: the propagation of
the hashtag across the different communities in their population of interest. They have used several metrics that aid
in visualizing the propagation of hashtags among the chosen population. These include, but are not limited to: (1)
peakedness: whether there are sudden spikes in the number
of people using a specific hashtag, indicating a short-lived
contagious phenomenon (2) commitment: average number
of subsequent mentions and the average time different between the first and last mention of the phenomenon among
the adopting users.
3. Dataset
In October 2018, Twitter released a dataset comprised
of 1,122,935 tweets made by 660 accounts potentially connected to state-backed Iranian operations. We present an
overview of the Iran data in the section below.
3.1. Background
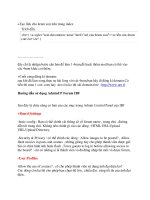
108 E
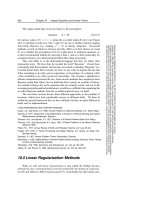
In degree distr of user graph. G(254422, 319201). 6925 (0.0272) nodes with indeg
> avg deg (2.5), 2118 (0.0083)
with >2'avg.deg
T
T——T—T—TT
TT]
T
Ex.xxnann
VA,
oe
ỦNh
F
8
`4Way
109
\
¢
oe
2
œ pưấ|
:
|
10!
In-degree
]
f
il
|
think
UA
102
Figure 1. In degree distribution of the user graph (log-log)
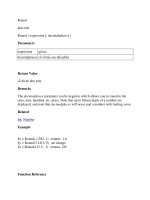
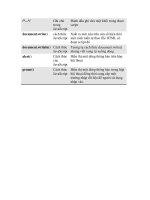
Out degree distr of user graph. G(254422, 319201), 558 (0.0022) nodes with out-deg > avg deg (2.5), 501 (0.0020) with >2"avg.deg
TTT
TTT
TTT
TTT]
T—TTTTTTỊ
10?
109
°
pol
104
cv
it l
_}
105
Figure 2. Out degree distribution of the user graph (log-log)
ized by any interaction. We also note that the number of
interactions between Iranian users known to be potentially
state-linked (/.) and other users(O) is greater than that between two state-linked users (KK — IX), as expected. Here,
3.2. Preliminary Data Analysis
a state-linked user refers to one who has at least one tweet in
the dataset attributed to them, and thus identified by Twitter
as being a part of the Iranian influence operation.
The log-log plots of in-degree (Fig 1) and out-degree
(Fig 2) distributions are approximately as one would expect
(linear, sloping down). The out-degree plot has much more
variance from this expected behavior though, since the outdegrees of nodes that are bots / intentional miscreants are
exceptionally high since they reply to / retweet a lot of the
tweets that they detect to serve their purpose.
Interestingly, most users in the dataset use French as
the language of their tweets, closely followed by English
4. Methods and Techniques
Messages on Twitter can be classified in several different
ways [1]. This dataset specifies the following tweet types:
general tweets, replies, retweets, and quote tweets. General tweets are a comprehensive label for any type of tweet.
Replies refer to tweets that are in direct response to another
tweet. A retweet is a direct copy of another tweet. A quoted
tweet combines a reference to a tweet with an additional
response.
and Arabic. Furthermore, most tweets reference France as
the user-reported location. For our analysis we focus on
English tweets as these are most relevant to US politics.
Figures 18, 19 in the appendix provide more information.
Figure 20 (Appendix) illustrates the number of tweets
by tweet-type. Most tweets are isolated, i.e. not character-
4.1. Graph Construction
We construct two directed graphs using the Iranian tweet
dataset - a user graph and a tweet graph. The user graph
maps the interactions between individual users in the dataset.
There is an edge from user V; to V2 if V; replied to, quoted,
or retweeted a tweet from user V2. The tweet graph instead
directly maps the relation between individual tweets in the
dataset. As with the user graph, there is an edge from tweet
V, to tweet V2 if Vj is in reply to, quoting, or retweeting V2.
For the tweet graph, we only consider tweets that contain
one of the fifty most common hashtags present in the dataset.
Furthermore, we only consider English tweets so that we can
interpret their text. This restricts the content we analyze to
276,946 state-linked tweets and 424 distinct users.
4.2. Structural Role Extraction
Structural roles of nodes in graphs can be found using
structural role extraction
algorithms
like RolX[5].
Each
node is represented as a feature vector, comprised of information that is deemed important, including the number of
neighbors, number of triangle motifs a node participates in,
etc. RolX then uses a structural feature discovery algorithm
that recursively aggregates egonet-based features, until no
new information can be added. Examples of recursive features include number of within-egonet edges and average
neighbor degree. Henderson et al. propose to use soft clustering in the structural feature space (where each node has a
mixed-membership across various discovered roles) for role
discovery.
Specifically, they use an automatic version of nonnegative matrix factorization. They find matrices G and
F to satisfy: argming,r||V — GF||fro, G > 0, F > 0.
They propose to use the Minimum Description Length criterion [6] to choose the model size r that results in the best
compression.
4.3. Cascades Exploration
We compute node centrality (‘-core) to determine
whether the starters of the largest tweet graphs are more
central in the graph. This works as follows: nodes with one
edge or more belong to the 1-core; when the nodes with just
one edge are removed from the graph, the nodes with two
edges belong to the 2-core and so on.
We validate if statistics associated with the cascade sizes
and the users starting them follow the inverse distribution
that we expect. We also compute activation thresholds for
each node and observe if they follow the expected uniform
distribution.
4.4. Temporal Popularity of Hashtags
Hashtags roughly indicate the themes and the associated
sentiments that the Iranian users tried to amplify during the
timeframe captured by this dataset (2014-2018). We plot
how the popularity of some of the most common hashtags
varied through the spectrum of this timeframe, and attempt
to provide reasoning for the trends observed, if any. We
do this by sorting the hashtags containing certain words of
interest (like “‘Trump‘) by frequency, and then picking the
most popular ones and plotting their occurrence against time
to observe these trends.
4.5. Most Targeted Tweet Content
Having developed an intuition for the roles occupied by
these users in the graph, their involvement in spreading information, and the type of information being spread at what
time, we finally turn to the question of figuring out the mechanisms of spreading this information. Here, we select the
largest tweet clusters (a tweet cluster is defined as being a
weakly connected component of the tweet graph), map each
tweet to the user who posted it, and observe the structure
of each user-tweet cluster thus obtained. Using this information, for every such large cluster, we look at the content
of the tweet that originated that cluster, thus uncovering the
ideas and policies these Iranian actors aimed to spread.
5. Results and Discussion
We describe our findings on using the above methods by
relating them to the questions that we set out to answer in § 1.
That is, we seek to characterize the roles of the Iranian users,
understand how they spread information, and identify the
issues they care about.
5.1. Characterization of the Iranian Users
5.1.1
Graph Structure
Figure 3 presents a visualization of the user graph generated
using the Graphviz library. As noted in § 4.1, we restrict the
user graph to only users with tweets in English so that we
could analyze the tweet content. Each red node represents a
user included in the dataset (i.e. a known state-linked user responsible for at least one tweet in the dataset), and each blue
node represents a user outside the dataset (only referenced
by a retweet, reply, or quoted tweet). The graph visualization
reveals several notable characteristics of the dataset. First, it
shows that a handful of key state-linked users played central
roles in spreading influence, interacting with hundreds of
other Twitter users. These users acted in isolation, avoiding
interaction with other known state-linked actors.
In addi-
tion to these central users, the dataset also contains a pocket
of state-linked users that interacted with both known statelinked and other users. This pocket comprises the majority
of the state-linked users. Finally, there are some state-linked
users on the periphery of the graph that interacted with very
few or even zero users. We speculate that the first type of
state-linked users are automated bots, while the second and
third type are possibly human influencers.
We present a randomly constructed subgraph of the Iran
user interaction for better visualization in Figure 5. As the
dataset captures tweets from state-linked user accounts only,
the graph structure primarily involves a huge fraction of the
outgoing edges from the state-linked nodes (red) to other
_Ƒ__Ầ.
eo
"oo
a
users (blue). We also present the largest strongly connected
group of the state-linked accounts in Figure 4.
ese
tì
M
“
P=^
es
=
-
Figure 4. Maximum SCC of the Iranian Nodes
In Figure 6, we observe that the farness centrality of
most users is low, implying that the length of the shortest
paths between nodes in a connected components is usually
short. This is indeed the case, as most state-linked nodes are
central in disseminating controversial information and hence
are one-hop away from a normal Twitter user.
Figure 5. Random Subgraph of the Iran User Interaction Graph
5.1.2
Structural Roles in the Iranian dataset
Upon using the RolX algorithm [ 4.2] to identify structural
roles within the Iranian user network, we observed that the
Farness Centrality vs Number of Hostile Users
350
Number of users
300
250
200
150
100
50
0
0
10000
20000
30000
40000
50000
Farness Centrality
60000
70000
Figure 6. Farness Centrality vs Number of state-linked Users
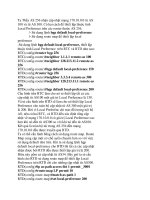
Simitar Users
Figure 8. Echo Node: Query node is colored Red.
similar to the query node are colored Blue.
Nodes most
Similar Users to Node 92
Figure 7. Source Node: Query node is colored Red. Nodes most
similar to the query node are colored Blue.
nodes could be identified with three major functions:
1. Source nodes, that have many incoming edges. These
are the users whose tweets are most often re-tweeted or
Similar Users to Nowe 14983
Figure 9. Isolated Node: Query node is colored Red. Nodes most
similar to the query node are colored Blue.
replied to.
2. Echo nodes, that mostly respond (re-tweet or reply) to
the tweets by source nodes.
3. Isolated nodes, that tweet but do not interact with other
nodes in the network.
We also present visualizations of instances of each type of
role. 7 illustrates an instance of a source node and the nodes
found to be most similar to it by the algorithm. 8 illustrates
an instance of an echo node (colored Red). 9 illustrates an
instance of an isolated node (colored Red).
5.2. Mechanisms for the Spread of Information
5.2.1
Cascades Exploration
The tweet graph represents many connected components,
mutually disconnected from each other, each representing
a cluster of tweets that build upon replies / retweets on the
original tweet. This is constructed by taking the most common 50 hashtags in English from the original dataset, since
these hashtags represent some of the most politically charged
conversations during this period.
This allows us to understand how information spreads
through
the network,
both
among
Iranian
tweeters,
and
among Iranian tweeters and other Twitter users.
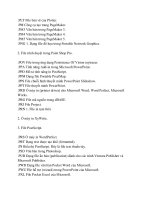
As can be seen from Figure 10, most tweet clusters are
small in size (< 10 tweets springing up from the original)
and only a few are larger. In fact, out of about 41,000 tweet
clusters (number of weakly connected components in the
tweet graph), over 27,000 just had one tweet, and only about
1200 had 4 or more tweets. 41 of these (about a thousandth
of the total number of clusters) had 25 or more tweets. The
largest cluster has 149 tweets (building up from retweets /
replies on one original tweet).
We then examine the ‘leaders’, i.e. the users that started
the most successful cascades. We then observe that 15 of the
wa
6w
number of leaders of large cascades
Ma
`.
109
101
uw
"
s
"=
a
⁄
N°
Number of clusters
2
2
10? 4
102
Tweet Cluster size
5.0
7.5
10.0
12.5
kcore
15.0
17.5
20.0
22.5
Figure 12. Number of leaders of large clusters belonging to each
core in a K-core decomposition
Figure 10. Tweet cluster sizes
number of users
eoBR
KR&@
6&
&6ö
BP
HF
4B&B
KN
B6Š
Number of nodes in k-core
top 18 largest tweet cascades are started by a single node,
and 3 of the largest 20 are started by another node. This
serves as strong evidence for some nodes being extremely
influential as compared to the rest.
10?
¡m1
S$
ở
10°
value of k
101
°
M
ờ
Figure 13. Users belonging to each core in a #C core decomposifion
(log-log plot)
250
500
750
1000
1250
1500
number of tweet clusters started
1750
2000
Figure 11. Number of original tweets vs Number of users
We observe, perhaps unsurprisingly, that most users who
start tweet clusters only start a few of them (Figure 11).
Most leaders start only | or 2 tweet clusters in the entire time
frame captured by this dataset, and only a few start over one
thousand tweet clusters.
It is natural to expect these influential nodes (starters of
huge clusters) to be central in the user graph, i.e. connected
to a lot of users and subgraphs in the user graph. As can be
seen from Figure 12, many of the starters of the 50 largest
tweet clusters belong to K cores with very high ’K’s. This
indicates that most of the users that are able to exert their
influence on a wide user base are the ones that are more
central, or more connected with the rest of the users in the
graph.
The significance of this becomes even
when one looks at the plot of the number of
to each core in a K’-core decomposition. As
(log-log plot), this goes down very quickly
in Kk.
more apparent
nodes belonging
Figure 13 shows
with an increase
Thus, the distribution of the most influential nodes
against Ix values is indeed very unlike the distribution across
all the nodes in the graph.
How does this influence spread? We look at ways to
quantify how the nodes in this graph become ”active”, which
is defined by a node starting to propagate tweets with one of
the above chosen hashtags. This is calculated by figuring out
how many of the node’s existing neighbors became active
before the node itself did.
This is the k,/k;,, ratio, and is
plotted for our user graph in Figure 14.
number of users
0
0.0
02
04
0.6
activation ratio
08
10
Figure 14. Activation ratios for the nodes in the graph that actually
started tweets
This illustrates that most users who become active (start
the most. The latter included the Yemen war, the Iran nuclear
posting political content, as covered by the 50 most popular
hashtags, as opposed to just watching as people comment
on their tweets) do so without any social pressure from their
immediate connections. This is contrary to the uniform distribution expected from a general graph with cascades, which
shows that most active users are actually Iranian tweeters
/ bots, who spontaneously become active in the campaign,
and not because they see their friends become active.
This analysis on activation ratios is limited as well, since
our dataset does not capture interactions among normal users
of Twitter that may have been sparked by state-linked activity
which precludes us from including their activation numbers
in Figure 14.
deal, the Israel Palestine conflict and the displacement of the
Rohingya in Myanmar.
5.3. Identifying the Issues of Interest
since the beginning of the frame, #Save Yemen shot up in
early 2018 and so did #Yemen. Similarly, #SaveRohingya
and #DeleteIsrael had their own peaks and stagnations at
various stages in this timeframe, mostly in 2017 and 2018.
5.3.1
Temporal Popularity of Hashtags
——
1200 4
1000 4
It can be observed from the graphs that while Mr. Trump
remained a popular figure throughout the duration of this
campaign, #DonaldTrump gained in its usage after his election, and many other related (and mostly negative) hashtags
were born and soared in popularity post-election as well.
The second graph is more interesting in this regard, as it
shows how various issues surfaced and died down, as new
and important issues emerged in the discourse supported by
the Iranian users.
For instance, mentions of the Iran deal
surged just before the US elections and withered off after
that (in 2016). While Yemen has been a topic of discussion
AntiTrump
——
ImpeachTrump
——
DonaldTrump
——
TrumpSupporters
5.3.2
Most Targeted Tweet Content
We found that the largest tweet clusters all appear to be
structurally similar. Each such cluster has one user who
posts the original tweet while the rest retweet, reply to, or
quote the original tweet.
800 +
600 +
heed
2
vŠ ®
2Ý”
St
AW
0
WO
por
9®
Ww!
02
W 0%
gor”
St
0 or
yy
v6
Figure 15. Cumulative counts of hashtags related to President
Trump over the years
——
5000 7 ——
—
40004
SaveYemen
IranDeal
Yemen
—
SaveRohingya
——
Deletelsrael
Figure 17. Recurring structure of the large tweet clusters
Furthermore, we examined the contents of some of these
3000 4
original (source) tweets and found that many of them were
2000 4
concerning
1000 4
co
we
ww?
a!
xe
Figure 16. Cumulative counts of hashtags related to socio-political
issues over time
We examined the popularity
pertaining to President Trump
the tweeters) and those related
political issues that the Iranian
of the most frequent hashtags
(for political inclinations of
to some of the popular sociotweeters seemed to care about
the Iran nuclear deal, the war in Yemen,
the
Rohingya refugee crisis, and the Israel - Palestine conflict,
criticizing President Trump’s stance on these issues. These
are issues that concern Iran politically, socially or militarily, and the US administration’s policies on these issues
have a deep impact on how they proceed. Therefore, it appears that the state-linked Iranian users were trying to push
forward a worldview in direct alignment with the Iranian
political agenda as opposed to inciting controversy surrounding United States-specific issues. In this way, they hoped to
shape public opinion by emotionally stimulating the public
regarding these issues concerning international politics.
6. Conclusion
In this paper we analyzed a Twitter dataset of potentially
state-linked Iranian users in order to be able to characterize
such users, identify the issues they care about, and understand how they spread information perpetrating their view
of these issues. Our takeaways are as follows:
e There have been potentially deliberate efforts by the
Iranian network in spreading viral information, as suggested by the out-degree distribution plot 2 and 0 activation ratio of most nodes.
Some of the nodes in the Iranian network are potentially
bots, given that they retweet a majority of the tweets
they are exposed to. The users can be segmented into
three distinct roles, each with their own part to play in
spreading the information.
Most of the information cascades follow the source-
echo structure 17, validating our hypothesis of a potential leader-follower mode of operation by the Iranian users in spreading viral information. The cascade
starters are more central than other nodes, and the same
set of nodes start most of the cascades.
The major issues that the Iranian users care about primarily concern Iranian politics rather than United States
affairs, and the popularity of these issues varies with
the geopolitical events of the time.
References
[1]
[2]
About different types of tweets.
V. Barash and J. Kelly. Salience vs. commitment: Dynamics
of political hashtags in russian twitter. 2012.
[3]
K.
[4]
[5]
[6]
Garimella,
G. D.
F. Morales,
A.
Gionis,
and M.
Math-
ioudakis. Quantifying controversy on social media. ACM
Transactions on Social Computing, 1(1):3, 2018.
C. Griffin and B. Bickel. Unsupervised machine learning
of open source russian twitter data reveals global scope and
operational characteristics. arXiv preprint arXiv: 1810.01466,
2018.
K. Henderson, B. Gallagher, T. Eliassi-Rad, H. Tong, S. Basu,
L. Akoglu, D. Koutra, C. Faloutsos, and L. Li. Rolx: structural
role extraction & mining in large graphs. In Proceedings of the
18th ACM SIGKDD international conference on Knowledge
discovery and data mining, pages 1231-1239. ACM, 2012.
J. Rissanen. Modeling by shortest data description. Automatica,
14(5):465-471, 1978.
A. Appendix:
Analysis
Graphs from Preliminary Data
300000 +
o
8=
200000 +
a
Number of users
250000 +
100000 +
50000 +
Language
Figure 18. Number of users by Language
250000
p
'6
e
2naono.
5
100000
3
3
z
150000
50000
0
so
đ 8
=sse8
es
> oe
Êy
ứ
0c0
55855852
SủĐÊấE
38a
85ấESĐ
?s
&
<3PFroaeexvg
ese
3 Â
2 gs *eeuy
s
#
abe
s
đ
E5
a2
3
oằ
s
*
Ê
5
E
se
83
S
a5
Đa
c=
ô
5
s
a
a
W
g
ơ
E
K
a
a
User Reported Location
Figure 19. Number of users by Region
1000000
§
Ễ
.
‘S
800000
600000
3
5
Z
400000
200000
0
8
Ễ
5
x
5
v
°
a
Tweet Type
š
?
w
x
Figure 20. Number of users by Tweet Type