mathematics in action. algebraic, graphical, and trigonometric problem solving
Bạn đang xem bản rút gọn của tài liệu. Xem và tải ngay bản đầy đủ của tài liệu tại đây (4.63 MB, 785 trang )
Mathematics
in Action
Algebraic, Graphical, and Trigonometric
Problem Solving
Fourth Edition
The Consortium for Foundation Mathematics
Ralph Bertelle Columbia-Greene Community College
Judith Bloch University of Rochester
Roy Cameron SUNY Cobleskill
Carolyn Curley Erie Community College—South Campus
Ernie Danforth Corning Community College
Brian Gray Howard Community College
Arlene Kleinstein SUNY Farmingdale
Kathleen Milligan Monroe Community College
Patricia Pacitti SUNY Oswego
Rick Patrick Adirondack Community College
Renan Sezer LaGuardia Community College
Patricia Shuart Polk State College—Winter Haven, Florida
Sylvia Svitak Queensborough Community College
Assad J.Thompson LaGuardia Community College
Addison-Wesley
Boston Columbus Indianapolis New York San Francisco Upper Saddle River
Amsterdam Cape Town Dubai London Madrid Milan Munich Paris Montréal Toronto
Delhi Mexico City São Paulo Sydney Hong Kong Seoul Singapore Taipei Tokyo
Editorial Director, Mathematics: Christine Hoag
Editor in Chief: Maureen O’Connor
Content Editor: Courtney Slade
Assistant Editor: Mary St. Thomas
Senior Managing Editor: Karen Wernholm
Production Project Manager: Beth Houston
Senior Designer/Cover Designer: Barbara Atkinson
Interior Designer: Studio Montage
Digital Assets Manager: Marianne Groth
Production Coordinator: Katherine Roz
Associate Producer: Christina Maestri
Associate Marketing Manager: Tracy Rabinowitz
Marketing Coordinator: Alicia Frankel
Senior Author Support/Technology Specialist: Joe Vetere
Rights and Permissions Advisor: Michael Joyce
Senior Manufacturing Buyer: Carol Melville
Production Management/Composition: PreMediaGlobal
Cover photo: Eric Michaud/iStockphoto
Many of the designations used by manufacturers and sellers to distinguish their
products are claimed as trademarks. Where those designations appear in this book,
and Addison-Wesley was aware of a trademark claim, the designations have been
printed in initial caps or all caps.
Library of Congress Cataloging-in-Publication Data
Mathematics in action: Algebraic, graphical, and trigonometric problem
solving / the Consortium for Foundation Mathematics. — 4th ed.
p. cm.
Includes index.
ISBN-13: 978-0-321-69861-2 (student ed.)
ISBN-10: 0-321-69861-4 (student ed.)
ISBN-13: 978-0-321-69290-0 (instructor ed.)
ISBN-10: 0-321-69290-X (instructor ed.)
1. Algebra—Textbooks. I. Consortium for Foundation Mathematics.
II. Title: Algebraic, graphical, and trigonometric problem solving.
QA152.3.M38 2012
512—dc22 2009052062
Copyright © 2012, 2008, 2004, 2001 Pearson Education, Inc.
All rights reserved. No part of this publication may be reproduced, stored in a retrieval system, or transmitted,
in any form or by any means, electronic, mechanical, photocopying, recording, or otherwise, without the prior
written permission of the publisher. Printed in the United States of America. For information on obtaining per-
mission for use of material in this work, please submit a written request to Pearson Education, Inc., Rights and
Contracts Department, 75 Arlington Street, Suite 300, Boston, MA 02116, fax your request to 617-848-7047,
or e-mail at />1 2 3 4 5 6 7 8 9 10—EB—14 13 12 11 10
NOTICE:
This work is
protected by U.S.
copyright laws and
is provided solely for
the use of college
instructors in review-
ing course materials
for classroom use.
Dissemination or sale
of this work, or any
part (including on the
World Wide Web),
will destroy the
integrity of the work
and is not permitted.
The work and materi-
als from it should
never be made avail-
able to students
except by instructors
using the accompany-
ing text in their
classes. All recipi-
ents of this work are
expected to abide by
these restrictions
and to honor the
intended pedagogical
purposes and the
needs of other
instructors who rely
on these materials.
iii
Contents
Preface xiv
To the Student xx
CHAPTER 1 Function Sense 1
Cluster 1 Modeling with Functions 1
Activity 1.1 Parking Problems 1
Objectives: 1. Identify input and output in situations involving two variable quantities.
2. Identify a functional relationship between two variables.
3. Identify the independent and dependent variables.
4. Use a table to numerically represent a functional relationship between
two variables.
5. Write a function using function notation.
Activity 1.2 Fill ’er Up 11
Objectives: 1. Determine the equation (symbolic representation) that defines
a function.
2. Determine the domain and range of a function.
3. Identify the independent and the dependent variables of a function.
Activity 1.3 Graphically Speaking 18
Objectives: 1. Represent a function verbally, symbolically, numerically, and graphically.
2. Distinguish between a discrete function and a continuous function.
3. Graph a function using technology.
Activity 1.4 Stopping Short 28
Objectives: 1. Use a function as a mathematical model.
2. Determine when a function is increasing, decreasing, or constant.
3. Use the vertical line test to determine if a graph represents a function.
Activity 1.5 Graphs Tell Stories 37
Objectives: 1. Describe in words what a graph tells you about a given situation.
2. Sketch a graph that best represents the situation described in words.
3. Identify increasing, decreasing, and constant parts of a graph.
4. Identify minimum and maximum points on a graph.
What Have I Learned? 44
How Can I Practice? 46
Cluster 2 Linear Functions 51
Activity 1.6 Walking for Fitness 51
Objective: 1. Determine the average rate of change.
Activity 1.7 Depreciation 58
Objectives: 1. Interpret slope as an average rate of change.
2. Use the formula to determine slope.
3. Discover the practical meaning of vertical and horizontal intercepts.
4. Develop the slope-intercept form of an equation of a line.
5. Use the slope-intercept formula to determine vertical and
horizontal intercepts.
6. Determine the zeros of a function.
Activity 1.8 A New Computer 69
Objectives: 1. Write a linear equation in the slope-intercept form, given the initial
value and the average rate of change.
2. Write a linear equation given two points, one of which is the
vertical intercept.
3. Use the point-slope form to write a linear equation given two points,
neither of which is the vertical intercept.
4. Compare slopes of parallel lines.
Activity 1.9 Skateboard Heaven 80
Objectives: 1. Write an equation of a line in standard form
2.Write the slope-intercept form of a linear equation given the
standard form.
3. Determine the equation of a horizontal line.
4. Determine the equation of a vertical line.
Activity 1.10 College Tuition 88
Objectives: 1. Construct scatterplots from sets of data pairs.
2. Recognize when patterns of points in a scatterplot have a linear form.
3. Recognize when the pattern in the scatterplot shows that the two
variables are positively related or negatively related.
4. Estimate and draw a line of best fit through a set of points in a
scatterplot.
5. Use a graphing calculator to determine a line of best fit by the
least-squares method.
Ax + By = C.
iv Contents
6. Measure the strength of the correlation (association) by a
correlation coefficient.
7. Recognize that a strong correlation does not necessarily imply a linear
or a cause-and-effect relationship.
What Have I Learned? 99
How Can I Practice? 100
Cluster 3 Systems of Linear Equations, Inequalities, and Absolute
Value Functions 105
Activity 1.11 Moving Out 105
Objectives: 1. Solve a system of linear equations numerically and graphically.
2. Solve a system of linear equations using the substitution method.
3. Solve an equation of the form for x.
Activity 1.12 Healthy Lifestyle 117
Objectives: 1. Solve a linear system algebraically using the substitution
method and the addition method.
2. Solve equations containing parentheses.
Activity 1.13 Manufacturing Cell Phones 124
Objective: 1. Solve a linear system of equations.
Activity 1.14 Earth Week 129
Objective: 1. Solve a linear system of equations using matrices.
Activity 1.15 How Long Can You Live? 136
Objectives: 1. Solve linear inequalities in one variable numerically
and graphically.
2. Use properties of inequalities to solve linear inequalities in one
variable algebraically.
3. Solve compound inequalities algebraically.
4. Use interval notation to represent a set of real numbers described
by an inequality.
Activity 1.16 Sales Commission 147
Objectives: 1. Graph a piecewise linear function.
2.Write a piecewise linear function to represent a given situation.
3. Graph a function defined by
What Have I Learned? 157
How Can I Practice? 158
Chapter 1 Summary 162
Chapter 1 Gateway Review 167
y =
ƒ
x - c
ƒ
.
3 * 3
2 * 2
ax + b = cx + d
2 * 2
2 * 2
Contents v
CHAPTER 2 The Algebra of Functions 177
Cluster 1 Addition, Subtraction, and Multiplication of Polynomial Functions 177
Activity 2.1 Spending and Earning Money 177
Objectives: 1. Identify a polynomial expression.
2. Identify a polynomial function.
3. Add and subtract polynomial expressions.
4. Add and subtract polynomial functions.
Activity 2.2 The Dormitory Parking Lot 188
Objectives: 1. Multiply two binomials using the FOIL method.
2. Multiply two polynomial functions.
3. Apply the property of exponents to multiply powers having the same base.
Activity 2.3 Stargazing 199
Objectives: 1. Convert scientific notation to decimal notation.
2. Convert decimal notation to scientific notation.
3. Apply the property of exponents to divide powers having the same base.
4. Apply the property of exponents , where
5. Apply the property of exponents , where and n is any
real number.
Activity 2.4 The Cube of a Square 207
Objectives: 1. Apply the property of exponents to simplify an expression involving
a power to a power.
2. Apply the property of exponents to expand the power of a product.
3. Determine the nth root of a real number.
4.Write a radical as a power having a rational exponent and write a base
to a rational exponent as a radical.
What Have I Learned? 216
How Can I Practice? 217
Cluster 2 Composition and Inverses of Functions 223
Activity 2.5 Inflated Balloons 223
Objectives: 1. Determine the composition of two functions.
2. Explore the relationship between and
Activity 2.6 Finding a Bargain 228
Objective: 1. Solve problems using the composition of functions.
Activity 2.7 Study Time 232
Objectives: 1. Determine the inverse of a function represented by a table of values.
2. Use the notation to represent an inverse function.f
-1
g1 f1x22.f1g1x22
a Z 0.a
-n
=
1
a
n
a Z 0.a
0
= 1
vi Contents
3. Use the property to recognize inverse functions.
4. Determine the domain and range of a function and its inverse.
Activity 2.8 Temperature Conversions 238
Objectives: 1. Determine the equation of the inverse of a function represented
by an equation.
2. Describe the relationship between graphs of inverse functions.
3. Determine the graph of the inverse of a function represented by a graph.
4. Use the graphing calculator to produce graphs of an inverse function.
What Have I Learned? 247
How Can I Practice? 248
Chapter 2 Summary 252
Chapter 2 Gateway Review 255
CHAPTER 3 Exponential and Logarithmic Functions 261
Cluster 1 Exponential Functions 261
Activity 3.1 The Summer Job 261
Objectives: 1. Determine the growth factor of an exponential function.
2. Identify the properties of the graph of an exponential function
defined by , where
3. Graph an increasing exponential function.
Activity 3.2 Half-Life of Medicine 269
Objectives: 1. Determine the decay factor of an exponential function.
2. Graph a decreasing exponential function.
3. Identify the properties of an exponential function defined by ,
where and
Activity 3.3 Cell Phones 277
Objectives: 1. Determine the growth and decay factor for an exponential function
represented by a table of values or an equation.
2. Graph an exponential function defined by , where
and ,
3. Determine the doubling and halving time.
Activity 3.4 Population Growth 289
Objectives: 1. Determine the annual growth or decay rate of an exponential function
represented by a table of values or an equation.
2. Graph an exponential function having equation
Activity 3.5 Time Is Money 297
Objective: 1. Apply the compound interest and continuous compounding formulas
to a given situation.
y = a11 + r2
x
Z 0.
a Z 0.b Z 1
b 7 0y = ab
x
b Z 1.b 7 0
y = b
x
b 7 1.y = b
x
f1 f
-1
1x22= f
-1
f1x22= x
Contents vii
Activity 3.6 Continuous Growth and Decay 305
Objectives: 1. Discover the relationship between the equations of exponential
functions defined by and the equations of continuous growth
and decay exponential functions defined by
2. Solve problems involving continuous growth and decay models.
3. Graph base e exponential functions.
Activity 3.7 Bird Flu 314
Objectives: 1. Determine the regression equation of an exponential function that best
fits the given data.
2. Make predictions using an exponential regression equation.
3. Determine whether a linear or exponential model best fits the data.
What Have I Learned? 322
How Can I Practice? 323
Cluster 2 Logarithmic Functions 329
Activity 3.8 The Diameter of Spheres 329
Objectives: 1. Define logarithm.
2.Write an exponential statement in logarithmic form.
3.Write a logarithmic statement in exponential form.
4. Determine log and ln values using a calculator.
Activity 3.9 Walking Speed of Pedestrians 337
Objectives: 1. Determine the inverse of the exponential function.
2. Identify the properties of the graph of a logarithmic function.
3. Graph the natural logarithmic function.
Activity 3.10 Walking Speed of Pedestrians, continued 344
Objectives: 1. Compare the average rate of change of increasing logarithmic, linear,
and exponential functions.
2. Determine the regression equation of a natural logarithmic function
having the equation ln x that best fits a set of data.
Activity 3.11 The Elastic Ball 354
Objectives: 1. Apply the log of a product property.
2. Apply the log of a quotient property.
3. Apply the log of a power property.
4. Discover change-of-base formula.
Activity 3.12 Prison Growth 363
Objective: 1. Solve exponential equations both graphically and algebraically.
What Have I Learned? 370
How Can I Practice? 372
Chapter 3 Summary 375
Chapter 3 Gateway Review 378
y = a + b
y = ae
kt
.
y = ab
t
viii Contents
CHAPTER 4 Quadratic and Higher-Order
Polynomial Functions 385
Cluster 1 Introduction to Quadratic Functions 385
Activity 4.1 Baseball and the Willis Tower 385
Objectives: 1. Identify functions of the form as quadratic
functions.
2. Explore the role of c as it relates to the graph of .
3. Explore the role of a as it relates to the graph of .
4. Explore the role of b as it relates to the graph of .
Note: in Objectives 1–4.
Activity 4.2 The Shot Put 395
Objectives: 1. Determine the vertex or turning point of a parabola.
2. Identify the vertex as the maximum or minimum.
3. Determine the axis of symmetry of a parabola.
4. Identify the domain and range.
5. Determine the y-intercept of a parabola.
6. Determine the x-intercept(s) of a parabola using technology.
7. Interpret the practical meaning of the vertex and intercepts in a
given problem.
Activity 4.3 Per Capita Personal Income 406
Objectives: 1. Solve quadratic equations graphically.
2. Solve quadratic equations numerically.
3. Solve quadratic inequalities graphically.
Activity 4.4 Sir Isaac Newton 412
Objectives: 1. Factor expressions by removing the greatest common factor.
2. Factor trinomials using trial and error.
3. Use the Zero-Product principle to solve equations.
4. Solve quadratic equations by factoring.
Activity 4.5 Price of Gold 419
Objective: 1. Solve quadratic equations by the quadratic formula.
Activity 4.6 Heat Index 428
Objectives: 1. Determine quadratic regression models using a graphing calculator.
2. Solve problems using quadratic regression models.
Activity 4.7 Complex Numbers 433
Objectives: 1. Identify the imaginary unit
2. Identify a complex number.
3. Determine the value of the discriminant
b
2
- 4ac.
i = 1- 1
.
a Z 0
f1x2= ax
2
+ bx + c
f1x2= ax
2
+ bx + c
f1x2= ax
2
+ bx + c
f1x2= ax
2
+ bx + c
Contents ix
4. Determine the types of solutions to a quadratic equation.
5. Solve a quadratic equation in the complex number system.
What Have I Learned? 440
How Can I Practice? 443
Cluster 2 Curve Fitting and Higher-Order Polynomial Functions 449
Activity 4.8 The Power of Power Functions 449
Objectives: 1. Identify a direct variation function.
2. Determine the constant of variation.
3. Identify the properties of graphs of power functions defined by ,
where n is a positive integer,
Activity 4.9 Volume of a Storage Tank 456
Objectives: 1. Identify equations that define polynomial functions.
2. Determine the degree of a polynomial function.
3. Determine the intercepts of the graph of a polynomial function.
4. Identify the properties of the graphs of polynomial functions.
Activity 4.10 Recycling 462
Objective: 1. Determine the regression equation of a polynomial function that
best fits the data.
What Have I Learned? 466
How Can I Practice? 468
Chapter 4 Summary 471
Chapter 4 Gateway Review 475
CHAPTER 5 Rational and Radical Functions 481
Cluster 1 Rational Functions 481
Activity 5.1 Speed Limits 481
Objectives: 1. Determine the domain and range of a function defined by , where
k is a nonzero real number.
2. Determine the vertical and horizontal asymptotes of a graph of
3. Sketch a graph of functions of the form
4. Determine the properties of graphs having equation
Activity 5.2 Loudness of Sound 489
Objectives: 1. Graph an inverse variation function defined by an equation of the form
,where n is any positive integer and k is a nonzero real number,
2. Describe the properties of graphs having equation ,
3. Determine the constant of proportionality (also called the constant
of variation).
x Z 0.y =
k
n
x
x Z 0.y =
k
n
x
y =
k
x
.
y =
k
x
.
y =
k
x
.
y =
k
x
k Z 0.
y = kx
n
x Contents
Activity 5.3 Percent Markup 501
Objectives: 1. Determine the domain of a rational function defined by an equation
of the form , where k is a nonzero constant and is a
first-degree polynomial.
2. Identify the vertical and horizontal asymptotes of
3. Sketch graphs of rational functions defined by
Activity 5.4 Blood-Alcohol Levels 510
Objectives: 1. Solve an equation involving a rational expression using an
algebraic approach.
2. Solve an equation involving a rational expression using a
graphing approach.
3. Determine horizontal asymptotes of the graph , where
and are first-degree polynomials.
Activity 5.5 Traffic Flow 523
Objectives: 1. Determine the least common denominator (LCD) of two or more
rational expressions.
2. Solve an equation involving rational expressions using an
algebraic approach.
3. Solve a formula for a specific variable.
Activity 5.6 Electrical Circuits 531
Objectives: 1. Multiply and divide rational expressions.
2. Add and subtract rational expressions.
3. Simplify a complex fraction.
What Have I Learned? 537
How Can I Practice? 538
Cluster 2 Radical Functions 543
Activity 5.7 Sky Diving 543
Objectives: 1. Determine the domain of a radical function defined by ,
where is a polynomial.
2. Graph functions having an equation and
3. Identify properties of the graph of and
Activity 5.8 Falling Objects 555
Objective: 1. Solve an equation involving a radical expression using a graphical and
algebraic approach.
Activity 5.9 Propane Tank 563
Objectives: 1. Determine the domain of a function defined by an equation of the form
, where n is a positive integer and is a polynomial.
2. Graph
3. Identify the properties of graphs of y = 2
n
g1x2.
y = 2
n
g1x2.
g1x2y = 2
n
g1x2
y =-2g1x2.y = 2g1x2
y =-2g1x2.y = 2g1x2
g1x2
y = 2g1x2
g1x2
f1x2y =
f1x2
g1x2
y =
k
g1x2
.
y =
k
g1x2
.
g1x2y =
k
g1x2
Contents xi
4. Solve radical equations that contain radical expressions with an index
other than 2.
What Have I Learned? 571
How Can I Practice? 572
Chapter 5 Summary 573
Chapter 5 Gateway Review 577
CHAPTER 6 An Introduction to the Trigonometric
Functions 585
Cluster 1 Introducing the Sine, Cosine, and Tangent Functions 585
Activity 6.1 The Leaning Tower of Pisa 585
Objectives: 1. Identify the sides and corresponding angles of a right triangle.
2. Determine the length of the sides of similar right triangles
using proportions.
3. Determine the sine, cosine, and tangent of an angle using a right triangle.
4. Determine the sine, cosine, and tangent of an acute angle by using the
graphing calculator.
Activity 6.2 A Gasoline Problem 597
Objectives: 1. Identify complementary angles.
2. Demonstrate that the sine of one of the complementary angles equals
the cosine of the other.
Activity 6.3 The Sidewalks of New York 603
Objectives: 1. Determine the inverse tangent of a number.
2. Determine the inverse sine and cosine of a number using the
graphing calculator.
3. Identify the domain and range of the inverse sine, cosine, and
tangent functions.
Activity 6.4 Solving a Murder 609
Objective: 1. Determine the measure of all sides and angles of a right triangle.
Project Activity 6.5 How Stable Is That Tower? 614
Objectives: 1. Solve problems using right-triangle trigonometry.
2. Solve optimization problems using right-triangle trigonometry with
a graphing approach.
What Have I Learned? 622
How Can I Practice? 625
Cluster 2 Why Are the Trigonometric Functions Called Circular Functions? 627
Activity 6.6 Learn Trig or Crash! 627
Objectives: 1. Determine the coordinates of points on a unit circle using sine and
cosine functions.
xii Contents
2. Sketch the graph of and
3. Identify the properties of the graphs of the sine and cosine functions.
Activity 6.7 It Won’t Hertz 637
Objectives: 1. Convert between degree and radian measure.
2. Identify the period and frequency of a function defined by
or using the graph.
Activity 6.8 Get in Shape 644
Objectives: 1. Determine the amplitude of the graph of and
2. Determine the period of the graph of and
using a formula.
Activity 6.9 The Carousel 653
Objective: 1. Determine the displacement of and
using a formula.
Activity 6.10 Texas Temperatures 658
Objectives: 1. Determine the equation of a sine function that best fits the given data.
2. Make predictions using a sine regression equation.
What Have I Learned? 662
How Can I Practice? 663
Chapter 6 Summary 665
Chapter 6 Gateway Review 668
APPENDIXES
Appendix A: Concept Review A-1
Appendix B: Trigonometry A-23
Appendix C: Getting Started with the TI-83/TI-84 Plus
Family of Calculators A-35
Selected Answers A-51
Glossary A-79
Index I-1
y = a cos 1bx + c2
y = a sin 1bx + c2
y = a cos 1bx2y = a sin 1bx2
y = a cos 1bx2.
y = a sin 1bx2
y = a cos 1bx2y = a sin 1bx2
y = cos x.y = sin x
Contents xiii
xiv
Preface
Our Vision
Mathematics in Action: Algebraic, Graphical, and Trigonometric Problem Solving, Fourth
Edition, is intended to help college mathematics students gain mathematical literacy in the
real world and simultaneously help them build a solid foundation for future study in mathe-
matics and other disciplines.
Our team of fourteen faculty, primarily from the State University of New York and the City
University of New York systems, used the AMATYC Crossroads standards to develop this three-
book series to serve a very large population of college students at the pre-precalculus level. Many
of our students have had previous exposure to mathematics at this level. It became apparent to us
that teaching the same content in the same way to students who have not previously compre-
hended it is not effective, and this realization motivated us to develop a new approach.
Mathematics in Action is based on the principle that students learn mathematics best by
doing mathematics within a meaningful context. In keeping with this premise, students
solve problems in a series of realistic situations from which the crucial need for mathemat-
ics arises. Mathematics in Action guides students toward developing a sense of indepen-
dence and taking responsibility for their own learning. Students are encouraged to construct,
reflect on, apply, and describe their own mathematical models, which they use to solve
meaningful problems. We see this as the key to bridging the gap between abstraction and
application and as the basis for transfer learning. Appropriate technology is integrated
throughout the books, allowing students to interpret real-life data verbally, numerically,
symbolically, and graphically.
We expect that by using the Mathematics in Action series, all students will be able to achieve
the following goals:
• Develop mathematical intuition and a relevant base of mathematical knowledge.
• Gain experiences that connect classroom learning with real-world applications.
• Prepare effectively for further college work in mathematics and related disciplines.
• Learn to work in groups as well as independently.
• Increase knowledge of mathematics through explorations with appropriate technology.
• Develop a positive attitude about learning and using mathematics.
• Build techniques of reasoning for effective problem solving.
• Learn to apply and display knowledge through alternative means of assessment, such as
mathematical portfolios and journal writing.
Our vision for you is to join the growing number of students using our approaches who dis-
cover that mathematics is an essential and learnable survival skill for the 21st century.
Pedagogical Features
The pedagogical core of Mathematics in Action is a series of guided-discovery activities in
which students work in groups to discover mathematical principles embedded in realistic sit-
uations. The key principles of each activity are highlighted and summarized at the activity’s
conclusion. Each activity is followed by exercises that reinforce the concepts and skills
revealed in the activity.
The activities are clustered within each chapter. Each cluster contains regular activities along
with project activities that relate to particular topics. The lab activities require more than just
paper, pencil, and calculator; they also require measurements and data collection and are
ideal for in-class group work. The project activities are designed to allow students to explore
specific topics in greater depth, either individually or in groups. These activities are usually
self-contained and have no accompanying exercises. For specific suggestions on how to use
the three types of activities, we strongly encourage instructors to refer to the Instructor’s
Resource Manual with Tests that accompanies this text.
Each cluster concludes with two sections: What Have I Learned? and How Can I Practice? The
What Have I Learned? exercises are designed to help students pull together the key concepts of
the cluster. The How Can I Practice? exercises are designed primarily to provide additional
work with the numeric and algebraic skills of the cluster. Taken as a whole, these exercises give
students the tools they need to bridge the gaps between abstraction, skills, and application.
Additionally, each chapter ends with a Summary that contains a brief description of the con-
cepts and skills discussed in the chapter, plus examples illustrating these concepts and skills.
The concepts and skills are also cross-referenced to the activity in which they appear, making
the format easier to follow for those students who are unfamiliar with our approach. Each chap-
ter also ends with a Gateway Review, providing students with an opportunity to check their
understanding of the chapter’s concepts and skills.
Changes from the Third Edition
The fourth edition retains all the features of the previous edition, with the following content
changes:
• All data-based activities and exercises have been updated to reflect the most recent
information and/or replaced with more relevant topics.
• The language in many activities is now clearer and easier to understand.
• Activities 1.1 and 1.2 were expanded to three activities to ensure students get a solid
introduction to functions.
• New problem situations were added in Activities 1.9, 1.13, 1.16, 2.2, 4.5, 4.6, and 5.7.
• A new activity, Activity 1.14: Earth Week, was added on solving linear systems using
matrix methods.
• Chapter 2 was rearranged so that exponents are covered separately from composition and
inverse functions. All exponent material is now found in Activities 2.3 and 2.4.
• The coverage of exponential growth and decay was split into two activities. Activity 3.1:
The Summer Job covers exponential growth, and Activity 3.2: Half-Life of Medicine
covers exponential decay.
• Chapter 4 was rearranged from three clusters to two. Activity 4.7: Complex Numbers is
now at the end of Cluster 1.
• The discussion of trigonometric values of special angles is now included in Activity 6.1:
The Leaning Tower of Pisa.
• Several activities have moved to the Instructor’s Resource Manual with Tests and
MyMathLab to streamline the course without loss of content.
• Several activities have incorporated web-based exercises into the exercise sets.
Preface xv
Supplements
Instructor Supplements
Annotated Instructor’s Edition
ISBN-13 978-0-321-69290-0
ISBN-10 0-321-69290-X
This special version of the student text provides answers to all exercises directly beneath each
problem.
Instructor’s Resource Manual with Tests
ISBN-13 978-0-321-69291-7
ISBN-10 0-321-69291-8
This valuable teaching resource includes the following materials:
• Sample syllabi suggesting ways to structure the course around core and supplemental
activities and within different credit-hour options.
• Sample course outlines containing time lines for covering topics.
• Teaching notes for each chapter, specifically for those using the Mathematics in Action
approach for the first time.
• Skills worksheets for topics with which students typically have difficulty.
• Sample chapter tests and final exams for individual and group assessment.
• Sample journal topics for each chapter.
• Learning in groups with questions and answers for instructors using collaborative learn-
ing for the first time.
• Incorporating technology, including sample graphing calculator assignments.
TestGen
®
ISBN-13 978-0-321-70560-0
ISBN-10 0-321-70560-2
TestGen enables instructors to build, edit, print, and administer tests using a computerized
bank of questions developed to cover all the objectives of the text. TestGen is algorithmically
based, allowing instructors to create multiple but equivalent versions of the same question or
test with the click of a button. Instructors can also modify test bank questions or add new
questions. The software and testbank are available for download from Pearson Education’s
online catalog.
Instructor’s Training Video on CD
ISBN-13 978-0-321-69279-5
ISBN-10 0-321-69279-9
This innovative video discusses effective ways to implement the teaching pedagogy of the
Mathematics in Action series, focusing on how to make collaborative learning, discovery
learning, and alternative means of assessment work in the classroom.
Student Supplements
Worksheets for Classroom or Lab Practice
ISBN-13 978-0-321-73835-6
ISBN-10 0-321-73835-7
xvi Preface
• Extra practice exercises for every section of the text with ample space for students to
show their work.
• These lab- and classroom-friendly workbooks also list the learning objectives and key
vocabulary terms for every text section, along with vocabulary practice problems.
• Concept Connection exercises, similar to the “What Have I Learned?” exercises found in
the text, assess students’ conceptual understanding of the skills required to complete
each worksheet.
MathXL
®
Tutorials on CD
ISBN-13 978-0-321-69292-4
ISBN-10 0-321-69292-6
This interactive tutorial CD-ROM provides algorithmically generated practice exercises that
are correlated at the objective level to the exercises in the textbook. Every practice exercise is
accompanied by an example and a guided solution designed to involve students in the solu-
tion process. The software provides helpful feedback for incorrect answers and can generate
printed summaries of students’ progress.
InterAct Math Tutorial Web site www.interactmath.com
Get practice and tutorial help online! This interactive tutorial Web site provides algorithmi-
cally generated practice exercises that correlate directly to the exercises in the textbook.
Students can retry an exercise as many times as they like with new values each time for un-
limited practice and mastery. Every exercise is accompanied by an interactive guided solu-
tion that provides helpful feedback for incorrect answers, and students can also view a
worked-out sample problem that steps them through an exercise similar to the one they’re
working on.
Pearson Math Adjunct Support Center
The Pearson Math Adjunct Support Center ( />mathadjunct.html) is staffed by qualified instructors with more than 100 years of combined
experience at both the community college and university levels. Assistance is provided for
faculty in the following areas:
• Suggested syllabus consultation
• Tips on using materials packed with your book
• Book-specific content assistance
• Teaching suggestions, including advice on classroom strategies
Supplements for Instructors and Students
MathXL
®
Online Course (access code required)
MathXL
®
is a powerful online homework, tutorial, and assessment system that accompanies
Pearson Education’s textbooks in mathematics or statistics. With MathXL, instructors can:
• Create, edit, and assign online homework and tests using algorithmically generated exer-
cises correlated at the objective level to the textbook.
• Create and assign their own online exercises and import TestGen tests for added flexibility.
• Maintain records of all student work tracked in MathXL’s online gradebook.
With MathXL, students can:
• Take chapter tests in MathXL and receive personalized study plans and/or personalized
homework assignments based on their test results.
Preface xvii
• Use the study plan and/or the homework to link directly to tutorial exercises for the
objectives they need to study.
• Access supplemental animations and video clips directly from selected exercises.
MathXL is available to qualified adopters. For more information, visit our Web site at
www.mathxl.com, or contact your Pearson representative.
MyMathLab
®
Online Course (access code required)
MyMathLab
®
is a text-specific, easily customizable online course that integrates interactive
multimedia instruction with textbook content. MyMathLab gives you the tools you need to
deliver all or a portion of your course online, whether your students are in a lab setting or
working from home.
• Interactive homework exercises, correlated to your textbook at the objective level, are
algorithmically generated for unlimited practice and mastery. Most exercises are free-
response and provide guided solutions, sample problems, and tutorial learning aids for
extra help.
• Personalized homework assignments that you can design to meet the needs of your
class. MyMathLab tailors the assignment for each student based on their test or quiz
scores. Each student receives a homework assignment that contains only the problems
he or she still needs to master.
• Personalized Study Plan, generated when students complete a test or quiz or home-
work, indicates which topics have been mastered and links to tutorial exercises for topics
students have not mastered. You can customize the Study Plan so that the topics avail-
able match your course content.
• Multimedia learning aids, such as video lectures and podcasts, animations, and a com-
plete multimedia textbook, help students independently improve their understanding and
performance. You can assign these multimedia learning aids as homework to help your
students grasp the concepts.
• Homework and Test Manager lets you assign homework, quizzes, and tests that are
automatically graded. Select just the right mix of questions from the MyMathLab exer-
cise bank, instructor-created custom exercises, and/or TestGen
®
test items.
• Gradebook, designed specifically for mathematics and statistics, automatically tracks
students’ results, lets you stay on top of student performance, and gives you control over
how to calculate final grades. You can also add offline (paper-and-pencil) grades to the
gradebook.
• MathXL Exercise Builder allows you to create static and algorithmic exercises for your
online assignments. You can use the library of sample exercises as an easy starting point,
or you can edit any course-related exercise.
• Pearson Tutor Center (www.pearsontutorservices.com) access is automatically in-
cluded with MyMathLab. The Tutor Center is staffed by qualified math instructors who
provide textbook-specific tutoring for students via toll-free phone, fax, e-mail, and inter-
active Web sessions.
Students do their assignments in the Flash
®
-based MathXL Player, which is compatible with
almost any browser (Firefox
®
, Safari™, or Internet Explorer
®
) on almost any platform
(Macintosh
®
or Windows
®
). MyMathLab is powered by CourseCompass™, Pearson
Education’s online teaching and learning environment, and by MathXL
®
, our online home-
work, tutorial, and assessment system. MyMathLab is available to qualified adopters. For
more information, visit www.mvmathlab.com or contact your Pearson representative.
xviii Preface
Acknowledgments
The Consortium would like to acknowledge and thank the following people for their invalu-
able assistance in reviewing and testing material for this text:
Rogelio Briones, Los Medanos College
April D. Strom, Scottsdale Community College
Mary Kay Abbey, Montgomery College
Barbara Burke, Hawai’i Pacific University
Edward (Ted) Coe, Scottsdale Community College
Jennifer Dollar, Grand Rapids Community College
Irene Duranczyk, University of Minnesota
Ernest East, Northwestern Michigan College
Maryann B. Faller, Adirondack Community College
John R. Furino, Foothill College
Linda Green, Santa Fe Community College
Teresa Hodge, University of the Virgin Islands
Maria Ilia, Clarke College
Ashok Kumar, Valdosta State University
David Lynch, Prince George’s Community College
J. Robert Malena, Community College of Allegheny County—South Campus
Raquel Mesa, Xavier University of Louisiana
Beverly K. Michael, University of Pittsburgh
Paula J. Mikowicz, Howard Community College
Adam Parr, University of the Virgin Islands
Debra Pharo, Northwestern Michigan College
Kathy Potter, St. Ambrose University
Dennis Risher, Loras College
Sandra Spears, Jefferson Community College
Christopher Teixeira, Rhode Island College
Kurt Verderber, SUNY Cobleskill
Lynn Wolfmeyer, Western Illinois University
We would also like to thank our accuracy checkers, Shannon d’Hemecourt, Diane E. Cook,
Jon Weerts, and James Lapp.
Finally, a special thank-you to our families for their unwavering support and sacrifice, which
enabled us to make this text a reality.
The Consortium for Foundation Mathematics
Acknowledgments xix
xx
To the Student
The book in your hands is most likely very different from any mathematics textbook you have
seen before. In this book, you will take an active role in developing the important ideas of
arithmetic and beginning algebra. You will be expected to add your own words to the text.
This will be part of your daily work, both in and out of class. It is the belief of the authors
that students learn mathematics best when they are actively involved in solving problems that
are meaningful to them.
The text is primarily a collection of situations drawn from real life. Each situation leads to
one or more problems. By answering a series of questions and solving each part of the prob-
lem, you will be using and learning one or more ideas of introductory college mathematics.
Sometimes, these will be basic skills that build on your knowledge of arithmetic. Other times,
they will be new concepts that are more general and far-reaching. The important point is that
you won’t be asked to master a skill until you see a real need for that skill as part of solving a
realistic application.
Another important aspect of this text and the course you are taking is the benefit gained by
collaborating with your classmates. Much of your work in class will result from being a
member of a team. Working in small groups, you will help each other work through a prob-
lem situation. While you may feel uncomfortable working this way at first, there are several
reasons we believe it is appropriate in this course. First, it is part of the learning-by-doing
philosophy. You will be talking about mathematics, needing to express your thoughts in
words. This is a key to learning. Secondly, you will be developing skills that will be very
valuable when you leave the classroom. Currently, many jobs and careers require the ability
to collaborate within a team environment. Your instructor will provide you with more spe-
cific information about this collaboration.
One more fundamental part of this course is that you will have access to appropriate technol-
ogy at all times. You will have access to calculators and some form of graphics tool—either a
calculator or computer. Technology is a part of our modern world, and learning to use tech-
nology goes hand in hand with learning mathematics. Your work in this course will help pre-
pare you for whatever you pursue in your working life.
This course will help you develop both the mathematical and general skills necessary in
today’s workplace, such as organization, problem solving, communication, and collaborative
skills. By keeping up with your work and following the suggested organization of the text,
you will gain a valuable resource that will serve you well in the future. With hard work and
dedication, you will be ready for the next step.
The Consortium for Foundation Mathematics
Park It
1
Chapter
Function Sense
1
1
Cluster 1
Modeling with Functions
Introduction
A key step in the problem-solving process is to look for relationships and connections between
the variable quantities in a given situation. Problems encountered in the world around us, in-
cluding the environment, medicine, economics, and the Internet, are often very complicated
and contain several variables. In this text, you will primarily deal with situations that contain
two variables. In many of these situations, the variables will have a special relationship called
a function.
Function
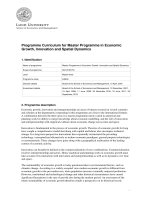
Did you have trouble finding a parking space this morning? Was the time that you arrived on
campus a factor? As part of a reconstruction project at a small community college, the num-
ber of cars in the parking lot was counted each hour from 7:00
A.M. to 10:00 P.M. on a partic-
ular day. The results are shown in the following table.
Activity 1.1
Parking Problems
Objectives
1. Identify input and output
in situations involving two
variable quantities.
2. Identify a functional
relationship between two
variables.
3. Identify the independent
and dependent variables.
4. Use a table to numerically
represent a functional
relationship between two
variables.
5. Write a function using
function notation.
TIME OF DAY NUMBER OF CARS
7 A.M.24
8 A.M. 212
9
A.M. 384
10 A.M. 426
11
A.M. 538
12 P.M. 497
1
P.M. 384
2 P.M. 337
3
P.M. 285
4 P.M. 278
5
P.M. 302
6 P.M. 427
7
P.M. 384
8 P.M. 315
9
P.M. 187
10 P.M. 56
3. Explain how the data in the Park It table fits the description of a function.
A functional relationship is stated as follows: “The output variable is a function of the input
variable.” Using x for the input variable and y for the output variable, the functional relation-
ship is stated “y is a function of x.” Because the input for the parking lot function is the time
of day and the output is the number of cars in the lot at that time, you write that the number
of cars in the parking lot is a function of the time of day.
2 Chapter 1 Function Sense
Definition
A function is a correspondence between an input variable and an output variable that
assigns a single output value to each input value. Therefore, for a function, any given
input value has exactly one corresponding output value. If x represents the input variable
and y represents the output variable, then the function assigns a single, unique y-value to
each x-value.
Example 1 Consider the following table listing the official high temperature
(in °F) in the village of Lake Placid, New York, during the first week
of January. Note that the date has been designated the input and the
high temperature on that date the output. Is the high temperature a
function of the date?
Date (Input)
1234567
Temperature (Output)
25 30 32 24 23 27 30
Almost Freezing
32
This situation involves two variables, the time of day and the number of cars in the parking
lot. A variable, usually represented by a letter, is a quantity that may change in value from
one particular instance to another. Typically, one variable is designated as the input and the
other is called the output. The input is the value given first, and the output is the value that
corresponds to, or is determined by, the given input value.
1. In the parking lot situation, identify the input variable and the output variable.
2. a. For an input of 10:00
A.M., how many cars are in the parking lot (output)?
b. For an input of 5:00
P.M., how many cars are in the parking lot (output)?
c. For each value of input (time of day), how many different outputs (number of cars)
are there?
The set of data in the Park It table is an example of a mathematical function.
TEMPERATURE
(INPUT)
DATE
(OUTPUT)
25 1
30 2
32 3
24 4
23 5
27 6
7
Activity 1.1 Parking Problems
3
If the input and output in Example 1 are switched (see table below), the daily high tempera-
ture becomes the input and the date becomes the output. The date is not a function of the high
temperature. The input value 30 has two output values, 2 and 7.
4. Interchange the input and the output in the parking lot situation. Let the number of cars
in the lot be the input and the time of day be the output. Is the time of day a function of
the number of cars in the lot? Write a sentence explaining why this switch does or does
not fit the description of a function.
DATE
(INPUT)
TEMPERATURE
(OUTPUT)
1 25
2 30
3 32
4 24
5 23
6 27
7 30
SOLUTION
From this table, you observe that the high temperature is a function of the date. For each date
there is exactly one high temperature. The relationships in this example can be visualized as
follows:
If d represents the input (date), and T represents the output (temperature), then T is a function
of d.
4 Chapter 1 Function Sense
6. The independent variable in Example 1 is the date. The dependent variable is the tem-
perature. Identify the independent and dependent variables in Example 2.
Defining Functions Numerically
The input/output pairing in the parking lot function on page 1 is presented as a table of
matched pairs. In such a situation, the function is defined numerically. Another way to
define a function numerically is as a set of ordered pairs.
Definition
If the relationship between two variables is a function, the input variable is called the
independent variable, and the output variable is called the dependent variable. If x
represents the input variable, and y represents the output variable, then x is the independent
variable and y is the dependent variable.
5. Determine whether or not each situation describes a function. Give a reason for your answer.
a. The amount of property tax you have to pay is a function of the assessed value of
the house.
b. The weight of a letter in ounces is a function of the postage paid for mailing the letter.
c. The speed at which a free-falling baseball strikes the ground is a function of the
height from which it was dropped.
d. The amount of your savings account is a function of your salary.
Example 2 Determine whether or not the following situation describes a function.
Give a reason for your answer.
The amount of postage for a letter is a function of the weight of the letter.
SOLUTION
Yes, this statement does describe a function. The weight of the letter is the input, and the
amount of postage is the output. Each letter has one weight. This weight determines the
postage necessary for the letter. There is only one amount of postage for each letter. Therefore,
for each value of input (weight of the letter) there is one output (postage). Note that if w
represents the input (weight of the letter), and p represents the output (postage), then p is a
function of w.