- Trang chủ >>
- Khoa Học Tự Nhiên >>
- Vật lý
review surface science
Bạn đang xem bản rút gọn của tài liệu. Xem và tải ngay bản đầy đủ của tài liệu tại đây (5.05 MB, 177 trang )
The surface science of titanium dioxide
Ulrike Diebold
*
Department of Physics, Tulane University, New Orleans, LA 70118, USA
Manuscript received in final form 7 October 2002
Abstract
Titanium dioxide is the most investigated single-crystalline system in the surface science of metal oxides, and
the literature on rutile (1 1 0), (1 0 0), (0 0 1), and anatase surfaces is reviewed. This paper starts with a summary
of the wide variety of technical ®elds where TiO
2
is of importance. The bulk structure and bulk defects (as far as
relevant to the surface properties) are brie¯y reviewed. Rules to predict stable oxide surfaces are exempli®ed on
rutile (1 1 0). The surface structure of rutile (1 1 0) is discussed in some detail. Theoretically predicted and
experimentally determined relaxations of surface geometries are compared, and defects (step edge orientations,
point and line defects, impurities, surface manifestations of crystallographic shear planesÐCSPs) are discussed,
as well as the image contrast in scanning tunneling microscopy (STM). The controversy about the correct model
for the (1 Â2) reconstruction appears to be settled. Different surface preparation methods, such as reoxidation of
reduced crystals, can cause a drastic effect on surface geometries and morphology, and recommendations for
preparing different TiO
2
(1 1 0) surfaces are given. The structure of the TiO
2
(1 0 0)-(1 Â1) surface is discussed
and the proposed models for the (1 Â 3) reconstruction are critically reviewed. Very recent results on anatase
(1 0 0) and (1 0 1) surfaces are included.
The electronic structure of stoichiometric TiO
2
surfaces is now well understood. Surface defects can be
detected with a variety of surface spectroscopies. The vibrational structure is dominated by strong Fuchs±Kliewer
phonons, and high-resolution electron energy loss spectra often need to be deconvoluted in order to render useful
information about adsorbed molecules.
The growth of metals (Li, Na, K, Cs, Ca, Al, Ti, V, Nb, Cr, Mo, Mn, Fe, Co, Rh, Ir, Ni, Pd, Pt, Cu, Ag, Au) as
well as some metal oxides on TiO
2
is reviewed. The tendency to `wet' the overlayer, the growth morphology, the
epitaxial relationship, and the strength of the interfacial oxidation/reduction reaction all follow clear trends across
the periodic table, with the reactivity of the overlayer metal towards oxygen being the most decisive factor. Alkali
atoms form ordered superstructures at low coverages. Recent progress in understanding the surface structure of
metals in the `strong-metal support interaction' (SMSI) state is summarized.
Literature is reviewed on the adsorption and reaction of a wide variety of inorganic molecules (H
2
,O
2
,H
2
O,
CO, CO
2
,N
2
,NH
3
,NO
x
, sulfur- and halogen-containing molecules, rare gases) as well as organic molecules
(carboxylic acids, alcohols, aldehydes and ketones, alkynes, pyridine and its derivates, silanes, methyl halides).
Surface Science Reports 48 (2003) 53±229
0167-5729/02/$ ± see front matter # 2002 Elsevier Science B.V. All rights reserved.
PII: S 0167-5729(02)00100-0
*
Tel.: 1-504-862-8279; fax: 1-504-862-8702.
E-mail address: (U. Diebold).
The application of TiO
2
-based systems in photo-active devices is discussed, and the results on UHV-based
photocatalytic studies are summarized.
The review ends with a brief conclusion and outlook of TiO
2
-based surface science for the future.
# 2002 Elsevier Science B.V. All rights reserved.
Keywords: Titanium oxide; Scanning tunneling microscopy; Single-crystalline surfaces; Adhesion; Catalysis; Chemisorption;
Epitaxy; Growth; Interface states; Photochemistry; Surface relaxation and reconstruction; Surface structure; Morphology;
Roughness; Topography
Contents
1. Introduction . . . . . . . . . . . . . . . . . . . . . . . . . . . . . . . . . . . . . . . . . . . . . . . . . . . . . . . . . . . . . . 57
1.1. Motivation . . . . . . . . . . . . . . . . . . . . . . . . . . . . . . . . . . . . . . . . . . . . . . . . . . . . . . . . . . . 57
1.2. Applications of TiO
2
59
1.3. Outline of this review . . . . . . . . . . . . . . . . . . . . . . . . . . . . . . . . . . . . . . . . . . . . . . . . . . . 64
2. The structure of TiO
2
surfaces . . . . . . . . . . . . . . . . . . . . . . . . . . . . . . . . . . . . . . . . . . . . . . . . . 65
2.1. Bulk structure . . . . . . . . . . . . . . . . . . . . . . . . . . . . . . . . . . . . . . . . . . . . . . . . . . . . . . . . 66
2.1.1. Bulk defects . . . . . . . . . . . . . . . . . . . . . . . . . . . . . . . . . . . . . . . . . . . . . . . . . . . . 68
2.2. The structure of the rutile TiO
2
(1 1 0) surface . . . . . . . . . . . . . . . . . . . . . . . . . . . . . . . . . . 70
2.2.1. The (1Â1) surface . . . . . . . . . . . . . . . . . . . . . . . . . . . . . . . . . . . . . . . . . . . . . . . . 70
2.2.1.1. Bulk truncation . . . . . . . . . . . . . . . . . . . . . . . . . . . . . . . . . . . . . . . . . . . 70
2.2.1.2. Relaxations . . . . . . . . . . . . . . . . . . . . . . . . . . . . . . . . . . . . . . . . . . . . . . 72
2.2.1.3. Appearance in STM and AFM . . . . . . . . . . . . . . . . . . . . . . . . . . . . . . . . 74
2.2.1.4. Surface defects . . . . . . . . . . . . . . . . . . . . . . . . . . . . . . . . . . . . . . . . . . . 78
2.2.1.4.1. Step edges . . . . . . . . . . . . . . . . . . . . . . . . . . . . . . . . . . . . . . . 78
2.2.1.4.2. Oxygen vacancies created by annealing . . . . . . . . . . . . . . . . . . . 81
2.2.1.4.3. Oxygen vacancies created by other means . . . . . . . . . . . . . . . . . 84
2.2.1.4.4. Line defects . . . . . . . . . . . . . . . . . . . . . . . . . . . . . . . . . . . . . . 84
2.2.1.4.5. Impurities . . . . . . . . . . . . . . . . . . . . . . . . . . . . . . . . . . . . . . . . 84
2.2.1.4.6. Crystallographic shear planes . . . . . . . . . . . . . . . . . . . . . . . . . . 85
2.2.2. Reconstructions . . . . . . . . . . . . . . . . . . . . . . . . . . . . . . . . . . . . . . . . . . . . . . . . . . 88
2.2.2.1. Reconstruction under reducing conditions: the structure(s) of the
(1Â2) phase . . . . . . . . . . . . . . . . . . . . . . . . . . . . . . . . . . . . . . . . . . . . . 88
2.2.2.2. Restructuring under oxidizing conditions . . . . . . . . . . . . . . . . . . . . . . . . . 89
2.2.3. Recommendations for surface preparation . . . . . . . . . . . . . . . . . . . . . . . . . . . . . . . 92
2.3. The structure of the rutile (1 0 0) surface . . . . . . . . . . . . . . . . . . . . . . . . . . . . . . . . . . . . . 93
2.3.1. The TiO
2
(1 0 0)-(1 Â1) surface . . . . . . . . . . . . . . . . . . . . . . . . . . . . . . . . . . . . . . 93
2.3.2. Reconstructions . . . . . . . . . . . . . . . . . . . . . . . . . . . . . . . . . . . . . . . . . . . . . . . . . . 95
2.3.2.1. The microfacet model of the rutile TiO
2
(1 0 0)-(1Â3) surface. . . . . . . . . . . 95
2.3.2.2. Is the simple microfacet model valid? . . . . . . . . . . . . . . . . . . . . . . . . . . . 96
2.4. Rutile (0 0 1) . . . . . . . . . . . . . . . . . . . . . . . . . . . . . . . . . . . . . . . . . . . . . . . . . . . . . . . . . 96
2.5. Vicinal and other rutile surfaces . . . . . . . . . . . . . . . . . . . . . . . . . . . . . . . . . . . . . . . . . . . . 99
2.6. Anatase surfaces. . . . . . . . . . . . . . . . . . . . . . . . . . . . . . . . . . . . . . . . . . . . . . . . . . . . . . . 99
2.6.1. Anatase (1 0 1) . . . . . . . . . . . . . . . . . . . . . . . . . . . . . . . . . . . . . . . . . . . . . . . . . . 100
2.6.2. Anatase (0 0 1) . . . . . . . . . . . . . . . . . . . . . . . . . . . . . . . . . . . . . . . . . . . . . . . . . . 102
2.6.3. Other anatase surfaces . . . . . . . . . . . . . . . . . . . . . . . . . . . . . . . . . . . . . . . . . . . . . 103
2.7. Conclusion. . . . . . . . . . . . . . . . . . . . . . . . . . . . . . . . . . . . . . . . . . . . . . . . . . . . . . . . . . . 103
54 U. Diebold / Surface Science Reports 48 (2003) 53±229
3. Electronic and vibrational structure of TiO
2
surfaces. . . . . . . . . . . . . . . . . . . . . . . . . . . . . . . . . . 105
3.1. Stoichiometric TiO
2
surfaces . . . . . . . . . . . . . . . . . . . . . . . . . . . . . . . . . . . . . . . . . . . . . . 105
3.2. Reduced TiO
2
surfaces . . . . . . . . . . . . . . . . . . . . . . . . . . . . . . . . . . . . . . . . . . . . . . . . . . 109
3.2.1. Defect states . . . . . . . . . . . . . . . . . . . . . . . . . . . . . . . . . . . . . . . . . . . . . . . . . . . . 109
3.2.2. Band bending . . . . . . . . . . . . . . . . . . . . . . . . . . . . . . . . . . . . . . . . . . . . . . . . . . . 110
3.2.3. Identi®cation of the reduction state with spectroscopic techniques . . . . . . . . . . . . . . . 110
3.3. Vibrational structure . . . . . . . . . . . . . . . . . . . . . . . . . . . . . . . . . . . . . . . . . . . . . . . . . . . . 111
4. Growth of metal and metal oxide overlayers on TiO
2
112
4.1. Overview and trends . . . . . . . . . . . . . . . . . . . . . . . . . . . . . . . . . . . . . . . . . . . . . . . . . . . . 112
4.1.1. Interfacial reactions . . . . . . . . . . . . . . . . . . . . . . . . . . . . . . . . . . . . . . . . . . . . . . . 112
4.1.2. Growth morphology (thermodynamic equilibrium). . . . . . . . . . . . . . . . . . . . . . . . . . 115
4.1.3. Growth kinetics, nucleation, and defects. . . . . . . . . . . . . . . . . . . . . . . . . . . . . . . . . 121
4.1.4. Film structure and epitaxial relationships . . . . . . . . . . . . . . . . . . . . . . . . . . . . . . . . 122
4.1.5. Thermal stability of metal overlayers on TiO
2
-SMSI . . . . . . . . . . . . . . . . . . . . . . . . 122
4.1.6. Chemisorption properties . . . . . . . . . . . . . . . . . . . . . . . . . . . . . . . . . . . . . . . . . . . 124
4.2. Metals and metal oxides on TiO
2
124
4.2.1. Lithium . . . . . . . . . . . . . . . . . . . . . . . . . . . . . . . . . . . . . . . . . . . . . . . . . . . . . . . 124
4.2.2. Sodium . . . . . . . . . . . . . . . . . . . . . . . . . . . . . . . . . . . . . . . . . . . . . . . . . . . . . . . 124
4.2.3. Potassium . . . . . . . . . . . . . . . . . . . . . . . . . . . . . . . . . . . . . . . . . . . . . . . . . . . . . . 125
4.2.4. Cesium. . . . . . . . . . . . . . . . . . . . . . . . . . . . . . . . . . . . . . . . . . . . . . . . . . . . . . . . 126
4.2.5. Calcium . . . . . . . . . . . . . . . . . . . . . . . . . . . . . . . . . . . . . . . . . . . . . . . . . . . . . . . 127
4.2.6. Aluminum . . . . . . . . . . . . . . . . . . . . . . . . . . . . . . . . . . . . . . . . . . . . . . . . . . . . . 127
4.2.7. Titanium. . . . . . . . . . . . . . . . . . . . . . . . . . . . . . . . . . . . . . . . . . . . . . . . . . . . . . . 127
4.2.8. Hafnium . . . . . . . . . . . . . . . . . . . . . . . . . . . . . . . . . . . . . . . . . . . . . . . . . . . . . . . 128
4.2.9. Vanadium . . . . . . . . . . . . . . . . . . . . . . . . . . . . . . . . . . . . . . . . . . . . . . . . . . . . . . 128
4.2.10. Vanadia . . . . . . . . . . . . . . . . . . . . . . . . . . . . . . . . . . . . . . . . . . . . . . . . . . . . . . . 129
4.2.11. Niobium . . . . . . . . . . . . . . . . . . . . . . . . . . . . . . . . . . . . . . . . . . . . . . . . . . . . . . . 130
4.2.12. Chromium . . . . . . . . . . . . . . . . . . . . . . . . . . . . . . . . . . . . . . . . . . . . . . . . . . . . . 132
4.2.13. Molybdenum. . . . . . . . . . . . . . . . . . . . . . . . . . . . . . . . . . . . . . . . . . . . . . . . . . . . 132
4.2.14. Molybdena . . . . . . . . . . . . . . . . . . . . . . . . . . . . . . . . . . . . . . . . . . . . . . . . . . . . . 133
4.2.15. Manganese . . . . . . . . . . . . . . . . . . . . . . . . . . . . . . . . . . . . . . . . . . . . . . . . . . . . . 133
4.2.16. Manganese oxide. . . . . . . . . . . . . . . . . . . . . . . . . . . . . . . . . . . . . . . . . . . . . . . . . 133
4.2.17. Iron . . . . . . . . . . . . . . . . . . . . . . . . . . . . . . . . . . . . . . . . . . . . . . . . . . . . . . . . . . 133
4.2.18. Ruthenium . . . . . . . . . . . . . . . . . . . . . . . . . . . . . . . . . . . . . . . . . . . . . . . . . . . . . 135
4.2.19. Ruthenium oxide . . . . . . . . . . . . . . . . . . . . . . . . . . . . . . . . . . . . . . . . . . . . . . . . . 135
4.2.20. Cobalt . . . . . . . . . . . . . . . . . . . . . . . . . . . . . . . . . . . . . . . . . . . . . . . . . . . . . . . . 135
4.2.21. Rhodium . . . . . . . . . . . . . . . . . . . . . . . . . . . . . . . . . . . . . . . . . . . . . . . . . . . . . . 136
4.2.22. Iridium. . . . . . . . . . . . . . . . . . . . . . . . . . . . . . . . . . . . . . . . . . . . . . . . . . . . . . . . 137
4.2.23. Nickel . . . . . . . . . . . . . . . . . . . . . . . . . . . . . . . . . . . . . . . . . . . . . . . . . . . . . . . . 137
4.2.24. Palladium . . . . . . . . . . . . . . . . . . . . . . . . . . . . . . . . . . . . . . . . . . . . . . . . . . . . . . 138
4.2.25. Platinum. . . . . . . . . . . . . . . . . . . . . . . . . . . . . . . . . . . . . . . . . . . . . . . . . . . . . . . 139
4.2.26. Copper . . . . . . . . . . . . . . . . . . . . . . . . . . . . . . . . . . . . . . . . . . . . . . . . . . . . . . . . 142
4.2.27. Silver . . . . . . . . . . . . . . . . . . . . . . . . . . . . . . . . . . . . . . . . . . . . . . . . . . . . . . . . . 143
4.2.28. Gold . . . . . . . . . . . . . . . . . . . . . . . . . . . . . . . . . . . . . . . . . . . . . . . . . . . . . . . . . 144
4.3. Conclusion. . . . . . . . . . . . . . . . . . . . . . . . . . . . . . . . . . . . . . . . . . . . . . . . . . . . . . . . . . . 147
5. Surface chemistry of TiO
2
148
5.1. Inorganic molecules . . . . . . . . . . . . . . . . . . . . . . . . . . . . . . . . . . . . . . . . . . . . . . . . . . . . 148
U. Diebold / Surface Science Reports 48 (2003) 53±229 55
5.1.1. Hydrogen . . . . . . . . . . . . . . . . . . . . . . . . . . . . . . . . . . . . . . . . . . . . . . . . . . . . . . 148
5.1.2. Water . . . . . . . . . . . . . . . . . . . . . . . . . . . . . . . . . . . . . . . . . . . . . . . . . . . . . . . . . 148
5.1.3. Oxygen . . . . . . . . . . . . . . . . . . . . . . . . . . . . . . . . . . . . . . . . . . . . . . . . . . . . . . . 155
5.1.4. Carbon monoxide and carbon dioxide . . . . . . . . . . . . . . . . . . . . . . . . . . . . . . . . . . 156
5.1.4.1. CO. . . . . . . . . . . . . . . . . . . . . . . . . . . . . . . . . . . . . . . . . . . . . . . . . . . . 156
5.1.4.2. CO
2
159
5.1.5. Nitrogen-containing molecules (N
2
, NO, NO
2
,N
2
O, NH
3
) 159
5.1.5.1. N
2
(Table 12) . . . . . . . . . . . . . . . . . . . . . . . . . . . . . . . . . . . . . . . . . . . . 159
5.1.5.2. NO. . . . . . . . . . . . . . . . . . . . . . . . . . . . . . . . . . . . . . . . . . . . . . . . . . . . 161
5.1.5.3. N
2
O 161
5.1.5.4. NO
2
161
5.1.5.5. NH
3
163
5.1.6. Sulfur-containing molecules (SO
2
,H
2
S, S
n
) 163
5.1.6.1. SO
2
163
5.1.6.1.1. TiO
2
(110) 163
5.1.6.1.2. TiO
2
(100) 164
5.1.6.2. H
2
S 165
5.1.6.3. Elemental sulfur (S
n
, n ! 2) 165
5.1.7. Halogen-containing molecules (Cl
2
, CrO
2
Cl
2
,HI) 167
5.1.7.1. Cl
2
167
5.1.7.2. Other halogen-containing molecules. . . . . . . . . . . . . . . . . . . . . . . . . . . . . 169
5.1.8. Rare gases (Ar, Xe) . . . . . . . . . . . . . . . . . . . . . . . . . . . . . . . . . . . . . . . . . . . . . . . 170
5.2. Adsorption and reaction of organic molecules . . . . . . . . . . . . . . . . . . . . . . . . . . . . . . . . . . 170
5.2.1. Carboxylic acids (formic acid, acetic acid, propanoic acid, acrylic acid, benzoic
acid, bi-isonicotinic acid, oxalic acid, glycine, maleic anhydride) . . . . . . . . . . . . . . . 179
5.2.1.1. Formic acid (HCOOH) . . . . . . . . . . . . . . . . . . . . . . . . . . . . . . . . . . . . . . 179
5.2.1.2. Formate: adsorption geometry and structure . . . . . . . . . . . . . . . . . . . . . . . 180
5.2.1.2.1. TiO
2
(1 1 0)-(1Â1) 180
5.2.1.2.2. TiO
2
(1 1 0)-(1Â2) 181
5.2.1.2.3. Modi®ed TiO
2
(1 1 0) surfaces. . . . . . . . . . . . . . . . . . . . . . . . . . 181
5.2.1.2.4. Other TiO
2
surfaces . . . . . . . . . . . . . . . . . . . . . . . . . . . . . . . . . 183
5.2.1.2.5. Anatase . . . . . . . . . . . . . . . . . . . . . . . . . . . . . . . . . . . . . . . . . 183
5.2.1.3. Reaction of formic acid . . . . . . . . . . . . . . . . . . . . . . . . . . . . . . . . . . . . . 183
5.2.1.4. Formic acidÐconclusion . . . . . . . . . . . . . . . . . . . . . . . . . . . . . . . . . . . . 187
5.2.1.5. Acetic acid (CH
3
COOH) . . . . . . . . . . . . . . . . . . . . . . . . . . . . . . . . . . . . 187
5.2.1.6. Propanoic acid (C
2
H
5
COOH) . . . . . . . . . . . . . . . . . . . . . . . . . . . . . . . . . 189
5.2.1.7. Acrylic acid (CH
2
=CHCOOH) . . . . . . . . . . . . . . . . . . . . . . . . . . . . . . . . 189
5.2.1.8. Benzoic acid (C
6
H
5
COOH). . . . . . . . . . . . . . . . . . . . . . . . . . . . . . . . . . . 189
5.2.1.9. Bi-isonicotinic acid . . . . . . . . . . . . . . . . . . . . . . . . . . . . . . . . . . . . . . . . 189
5.2.1.10. Oxalic acid (HOOC±COOH) . . . . . . . . . . . . . . . . . . . . . . . . . . . . . . . . . . 190
5.2.1.11. Glycine (NH
2
CH
2
COOH) 190
5.2.1.12. Maleic anhydride . . . . . . . . . . . . . . . . . . . . . . . . . . . . . . . . . . . . . . . . . . 191
5.2.2. Alcohols (methanol, higher alcohols) . . . . . . . . . . . . . . . . . . . . . . . . . . . . . . . . . . . 191
5.2.2.1. Methanol . . . . . . . . . . . . . . . . . . . . . . . . . . . . . . . . . . . . . . . . . . . . . . . 191
5.2.2.1.1. Methanol on TiO
2
(110) 192
5.2.2.1.2. Methanol on TiO
2
(0 0 1) and TiO
2
(100) 192
5.2.2.2. Higher alcohols . . . . . . . . . . . . . . . . . . . . . . . . . . . . . . . . . . . . . . . . . . . 194
56 U. Diebold / Surface Science Reports 48 (2003) 53±229
5.2.3. Aldehydes (RCHO) and ketones (RCOCH
3
) (formaldehyde, acetaldehyde,
benzaldehyde, acetone, acetophenone, p-benzoquinone, cyclohexanone,
cyclohexenone) . . . . . . . . . . . . . . . . . . . . . . . . . . . . . . . . . . . . . . . . . . . . . . . . . . 194
5.2.3.1. Formaldehyde . . . . . . . . . . . . . . . . . . . . . . . . . . . . . . . . . . . . . . . . . . . . 195
5.2.3.2. Acetaldehyde. . . . . . . . . . . . . . . . . . . . . . . . . . . . . . . . . . . . . . . . . . . . . 195
5.2.3.3. Benzaldehyde . . . . . . . . . . . . . . . . . . . . . . . . . . . . . . . . . . . . . . . . . . . . 196
5.2.3.4. Acetone and acetophenone . . . . . . . . . . . . . . . . . . . . . . . . . . . . . . . . . . . 196
5.2.3.5. Cyclic ketones . . . . . . . . . . . . . . . . . . . . . . . . . . . . . . . . . . . . . . . . . . . . 196
5.2.4. Cyclo-trimerization of alkynes (RCBCH) on reduced TiO
2
surfaces
and related reactions . . . . . . . . . . . . . . . . . . . . . . . . . . . . . . . . . . . . . . . . . . . . . . 196
5.2.5. STM of pyridine, its derivates, and other aromatic molecules
(pyridine, 4-methylpyridine, benzene, m-xylene, phenol) . . . . . . . . . . . . . . . . . . . . . 198
5.2.6. Adsorption and reaction of silanes (RSiX
3
) (TEOS, diethyldiethoxysilane,
vinyltriethoxysilane, aminopropyltriethoxysilane,
(3,3,3-tri¯uoropropyl)-trimethoxysilane) . . . . . . . . . . . . . . . . . . . . . . . . . . . . . . . . . 199
5.3. Photocatalysis on TiO
2
200
5.3.1. Heterogeneous photocatalysis . . . . . . . . . . . . . . . . . . . . . . . . . . . . . . . . . . . . . . . . 201
5.3.2. Photovoltaic cells . . . . . . . . . . . . . . . . . . . . . . . . . . . . . . . . . . . . . . . . . . . . . . . . 202
5.3.3. Photocatalysis on single-crystalline TiO
2
204
5.3.3.1. Oxygen, water, CO, and CO
2
204
5.3.3.2. Alcohols . . . . . . . . . . . . . . . . . . . . . . . . . . . . . . . . . . . . . . . . . . . . . . . . 205
5.3.3.3. CHX
3
(X Cl,Br,I) 205
6. Summary and outlook . . . . . . . . . . . . . . . . . . . . . . . . . . . . . . . . . . . . . . . . . . . . . . . . . . . . . . . 206
6.1. What has been learned and what is missing? . . . . . . . . . . . . . . . . . . . . . . . . . . . . . . . . . . . 206
6.2. TiO
2
in relation to other transition metal oxides. . . . . . . . . . . . . . . . . . . . . . . . . . . . . . . . . 207
6.3. TiO
2
Ðmixed and doped . . . . . . . . . . . . . . . . . . . . . . . . . . . . . . . . . . . . . . . . . . . . . . . . . 209
6.4. Nanostructured TiO
2
209
6.5. Going beyond single crystal and UHV studies . . . . . . . . . . . . . . . . . . . . . . . . . . . . . . . . . . 211
6.6. Concluding remarks . . . . . . . . . . . . . . . . . . . . . . . . . . . . . . . . . . . . . . . . . . . . . . . . . . . . 212
Acknowledgements . . . . . . . . . . . . . . . . . . . . . . . . . . . . . . . . . . . . . . . . . . . . . . . . . . . . . . . . . . . . 212
References . . . . . . . . . . . . . . . . . . . . . . . . . . . . . . . . . . . . . . . . . . . . . . . . . . . . . . . . . . . . . . . . . . 212
1. Introduction
1.1. Motivation
The surface science of metal oxides is a relatively young ®eld that enjoys a rapidly increasing
interest. The general trend to take the `next step' in surface scienceÐto move on to more realistic and
complex model systemsÐlets many researchers to develop an interest in oxide surfaces. This is
motivated by the desire to contribute to the numerous applications where oxide surfaces play a role;
after all, most metals are oxidized immediately when exposed to the ambient.
The knowledge of well-characterized single-crystalline metal oxide surfaces is reviewed extensively
by Henrich and Cox [1] in 1993. This excellent book (which has become a classic in the ®eld) starts by
showing the number of publications per year on fundamental surface-science studies on all metal
oxides. The number of papers culminates with around 100 articles in 1991, the last year reviewed. A
U. Diebold / Surface Science Reports 48 (2003) 53±229 57
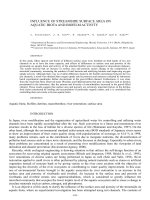
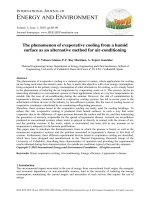
similar analysis (Fig. 1) of (experimental) papers on single-crystalline TiO
2
surfaces shows that more
than 70 articles were published on the TiO
2
(1 1 0) surface alone in the year 2000.
What is the reason for the popularity of this system? One driving force for pursuing research on
single-crystalline TiO
2
surfaces is the wide range of its applications and the expectation that insight into
surface properties on the fundamental level will help to improve materials and device performance in
many ®elds. Titanium dioxide is a preferred system for experimentalists because it is well-suited for
many experimental techniques. Polished crystals with a high surface quality can be purchased from
various vendors. They can be reduced easily, which conveniently prevents charging of this wide band
gap semiconductor. One also should not underestimate the `self-promoting' effect of popularityÐnew
phenomena are studied most easily on well-characterized, often tested systems, and TiO
2
, especially the
most stable rutile (1 1 0) surface, falls certainly into this category. All these factors have contributed in
making TiO
2
the model system in the surface science of metal oxides.
Despite this high interest, a comprehensive review of the surface science of TiO
2
is lacking at this
point. Several excellent reviews of different aspects of single-crystalline metal oxide surfaces were
written in recent years [1±10], and TiO
2
surfaces are considered in almost all of them. Still, the time
may be ripe to review the wealth of knowledge on TiO
2
itself, and an attempt is made in this paper. It is
intended to give the interested reader an introduction into TiO
2
, and clarify some confusing and
con¯icting results, e.g. on the structure of TiO
2
surfaces as observed with scanning tunneling
microscopy (STM), the adsorption of test molecules such as water and formic acid, and the rich body of
literature on metal growth on TiO
2
surfaces. There is also a hope that the insights obtained on this
model oxide can be transferred, at least in part, to other systems. The focus is on the more recent
literature (>1990). While an attempt was made to include most of the single-crystalline work on TiO
2
Fig. 1. Number of publications on single-crystalline TiO
2
surfaces/year. Courtesy of M.A. Henderson, Paci®c Northwest
National Laboratory.
58 U. Diebold / Surface Science Reports 48 (2003) 53±229
surfaces, the sheer number of papers excludes comprehensiveness, and apologies are extended to any
authors whose work was unfortunately not represented.
1.2. Applications of TiO
2
Before dwelling on actual surface science results, a brief glimpse on the applications of TiO
2
(which,
after all are the deeper motivation for most of the performed work) is in order. Titanium dioxide is used
in heterogeneous catalysis, as a photocatalyst, in solar cells for the production of hydrogen and electric
energy, as gas sensor, as white pigment (e.g. in paints and cosmetic products), as a corrosion-protective
coating, as an optical coating, in ceramics, and in electric devices such as varistors. It is important in
earth sciences, plays a role in the biocompatibility of bone implants, is being discussed as a gate
insulator for the new generation of MOSFETS and as a spacer material in magnetic spin-valve systems,
and ®nds applications in nanostructured form in Li-based batteries and electrochromic devices.
A better understanding and improvement of catalytic reactions is one main driving force for surface
investigations on TiO
2
. Because most heterogeneous catalysts consist of small metal clusters on an
oxide support, many growth studies of metals on TiO
2
were performed. These metal/TiO
2
systems often
serve as a model for other metal/oxide surfaces. Traditionally, TiO
2
is a component in mixed vanadia/
titania catalysts used for selective oxidation reactions [11]. The surface science of vanadium and
vanadia/TiO
2
systems was addressed by several groups [12±15].TiO
2
is not suitable as a structural
support material, but small additions of titania can modify metal-based catalysts in a profound way. The
so-called strong-metal support interaction (SMSI) is, at least in part, due to encapsulation of the metal
particles by an reduced TiO
x
overlayer (see review by Haller and Resasco [16]). Recently, this
phenomenon was revisited using surface science techniques [17±20]. The discovery that ®nely
dispersed Au particles supported on TiO
2
and other reducible metal oxides oxidize CO at low
temperature [21] has spurred some excitement in the surface science community. Many experiments
that may clarify the underlying phenomena leading to this processes are still underway [22±24].
The photoelectric and photochemical properties of TiO
2
are another focus of active research. The
initial work by Fujishima and Honda [25] on the photolysis of water on TiO
2
electrodes without an
external bias, and the thought that surface defect states may play a role in the decomposition of water
into H
2
and O
2
, has stimulated much of the early work on TiO
2
[26±28]. Unfortunately, TiO
2
has a low
quantum yield for the photochemical conversion of solar energy. The use of colloidal suspensions with
the addition of dye molecules has been shown to improve ef®ciency of solar cells [29], and has moved
TiO
2
-based photoelectrochemical converters into the realm of economic competitiveness [30].
By far, the most actively pursued applied research on titania is its use for photo-assisted degradation
of organic molecules. TiO
2
is a semiconductor and the electron±hole pair that is created upon
irradiation with sunlight may separate and the resulting charge carriers might migrate to the surface
where they react with adsorbed water and oxygen to produce radical species. These attack any adsorbed
organic molecule and can, ultimately, lead to complete decomposition into CO
2
and H
2
O. The
applications of this process range from puri®cation of wastewaters [31]; desinfection based on the
bactericidal properties of TiO
2
[32] (for example, in operating rooms in hospitals); use of self-cleaning
coatings on car windshields [33], to protective coatings of marble (for preservation of ancient Greek
statues against environmental damage [34]). It was even shown that subcutaneous injection of a TiO
2
slurry in rats, and subsequent near-UV illumination, could slow or halt the development of tumor cells
[35±37]. Several review papers discuss the technical and scienti®c aspects of TiO
2
photocatalysis
U. Diebold / Surface Science Reports 48 (2003) 53±229 59
[31,38±42]. An extensive review of the surface science aspects of TiO
2
photocatalysis has been given
by Linsebigler et al. [43], and some of these more recent results are discussed in Section 5.3.3.
Semiconducting metal oxides may change their conductivity upon gas adsorption. This change in the
electrical signal is used for gas sensing [44].TiO
2
is not used as extensively as SnO
2
and ZnO, but it has
received some attention as an oxygen gas sensor, e.g. to control the air/fuel mixture in car engines
[45,46]. Two different temperature regimes are distinguished [47]. At high temperatures, TiO
2
can be
used as a thermodynamically controlled bulk defect sensor to determine oxygen over a large range of
partial pressures. The intrinsic behavior of the defects responsible for the sensing mechanism can be
controlled by doping with tri- and pentavalent ions. At low temperatures, addition of Pt leads to the
formation of a Schottky-diode and a high sensitivity against oxygen [47].
The sheer volume of TiO
2
pigments produced world-wideÐcurrently ca. 4 million tons per yearÐis
stunning [48].TiO
2
pigment is used in virtually every kind of paint because of its high refractive index.
(See Table 1 for a summary of bulk properties of TiO
2
. A more detailed resource on rutile was given in
[49].) The surface properties play a role even in these wide-spread applications, e.g. the photocatalytic
degradation of binder in paints is a major problem for the paint industry. TiO
2
is non-toxic and safe, and
can be dispersed easily [48]. In pure form it is also used as a food additive [50], in pharmaceuticals, and
in cosmetic products [51].
Titanium dioxide is used extensively in thin-®lm optical-interference coatings [52]. Such coatings are
based on the interference effects between light re¯ected from both the upper and lower interface of a
thin ®lm. (The same effect gives rise to the different colors of an oil ®lm on water.) The relative ratios
between transmission and re¯ection of light are governed by the index of refraction of the thin ®lm and
the surrounding media. By depositing a stack of layers with the appropriate optical index, the
refraction/transmission properties of a stack of thin layers on a glass substrate can be designed to meet a
great number of applications. Examples for such devices include antire¯ective coatings, dielectric
mirrors for lasers, metal mirrors with enhanced re¯ection, and ®lters [52]. For most ®lms a combination
of materials with indices as high and as low as possible is an advantage. Titanium dioxide has the
highest index of all oxides (see Table 1), making it ideally suited for this application.
One of the `hot' issues currently debated in materials science is the search for the best dielectric gate
material for replacing SiO
2
MOSFET devices [53]. It appears that the limit for miniaturization, when
electric tunneling through ever thinner SiO
2
®lms becomes signi®cant, will be reached in the very near
future. Ultrathin metal oxide ®lms might be well-suited as the gate material of the future, and TiO
2
,
with its high dielectric constant (Table 1), would be an attractive candidate for this application. A new
kind of gate oxide must meet very stringent requirementsÐno surface states, virtually pin-hole free,
stoichiometric ultrathin ®lms, good interface formation with the Si substrate, etc. [53].TiO
2
could be a
viable approach to dielectrics whose oxide equivalent thickness is less than 2.0 nm. CVD-grown TiO
2
®lms on Si show excellent electric characteristics, but a low resistivity layer, probably SiO
2
, forms at
the interface [54]. Interestingly, modi®ed TiO
2
®lms are also promising materials for spintronics
applications, although TiO
2
itself is not a magnetic material. When anatase TiO
2
®lms are doped with a
few percent of Co, they become ferromagnetic [55,56]. Such ®lms are optically transparent,
semiconducting, and ferromagnetic at room temperature, and might be ideal candidates for spin-based
electronic devices.
Nanostructured TiO
2
electrodes have received quite a bit of attention. One particularly interesting
application is the implementation of nanocrystalline TiO
2
®lms in electrochromic devices [57]. Such
devices control light transmission in windows or light re¯ection in mirrors and displays. They are based
60 U. Diebold / Surface Science Reports 48 (2003) 53±229
Table 1
Bulk properties of titanium dioxide
a
Atomic radius (nm)
O 0.066 (covalent)
Ti 0.146 (metallic)
Ionic radius (nm)
O(À2) 0.14
Ti(4) 0.064
Crystal structure System Space group Lattice constants (nm)
abcc/a
rutile Tetragonal D
14
4h
-P4
2
/mnm 0.4584 ± 0.2953 0.644
anatase Tetragonal D
19
4h
-I4
1
/amd 0.3733 ± 0.937 2.51
brookite Rhombohedral D
15
2h
-Pbca 0.5436 0.9166 0.5135 0.944
Density (kg/m
3
)
rutile 4240
anatase 3830
brookite 4170
Melting point (8C)
(decomposes)
(rutile)
Boiling point (8C)
(at pressure
pO
2
101.325 kPa)
1870 2927
Standard heat capacity, C
0
p
, 298.15 J/(mol 8C)
55.06 (rutile)
55.52 (anatase)
Heat capacity,
C
p
(J/kg K) (rutile)
Temperature (K)
±10
243 25
1788 50
6473 100
10718 150
14026 200
18255 298.15
Temperature (K) Thermal conductivity
(W/(m K)) (rutile)
373 6.531
473 4.995
673 3.915
873 3.617
1073 3.391
1273 3.307
1473 3.307
U. Diebold / Surface Science Reports 48 (2003) 53±229 61
Table 1 (Continued )
Linear coefficient of
thermal expansion
(a  10
À6
, 8C
À1
), rutile
Temperature (8C)
8.19 0±500
Anisotropy of linear coefficient of thermal
expansion (a  10
À6
, 8C
À1
), rutile
Parallel to c-axis Perpendicular to
c-axis
Temperature
(8C)
a 8:816 Â 10
À6
3:653 Â10
À9
 T
6:329 Â10
À12
 T
2
a 7:249 Â 10
À6
2:198 Â10
À9
 T
1:198 Â10
À12
 T
2
30±650
Modulus of normal
elasticity E (GPa) (rutile)
Density (kg/m
3
)
244.0 4000
254.5 4100
273.0 4200
284.2 4250
289.4
Hardness on mineralogical
scale (Mohs scale)
5±6.5
Microhardness (MPa) Load P Â 10
À5
N
6001.88 98070 rutile
7845.66±1961.40 49035±98070 rutile,
398±923 K
Compressibility coefficient,
b,10
À11
m
2
/N, rutile
Pressure, p,
10
11
m
2
(N Pa)
Temperature
(K)
0.59 125 273
Electrical resistance (rutile)
Temperature (K) Resistivity (O m)
773 3 Â10
5
1073 1:2 Â 10
2
1473 8:50 Â 10
2
Thermoelectric properties (rutile)
Temperature (K) Thermo-emf
coefficient (mV/K)
400 0.75
600 À2.75
800 À6
1000 À9
1200 À12
62 U. Diebold / Surface Science Reports 48 (2003) 53±229
Table 1 (Continued )
Galvanometric properties (rutile)
Hall constant (m
3
/c) (rutile) Temperature (K)
2 Â 10
À6
500
Electron mobility, m (cm
2
/V s)
TiO
2
Ã
(rutile) $1 [209]
TiO
2
ÃÃ
(anatase) $10 [209]
Dielectric properties
Frequency (Hz) Temperature (K) Dielectric
constant
rutile, perpendicular
to optical axis
10
8
290±295 86
rutile, parallel to
optical axis
± 290±295 170
rutile, perpendicular
to c-axis
10
4
298 160
rutile, along c-axis 10
7
303 100
Band gap (eV)
rutile 3.0 (indirect) [209]
anatase 3.2 (indirect) [209]
Refractive index
n
g
n
m
n
p
a-TiO
2
(rutile) 2.908 ± 2.621
b-TiO
2
(anatase) 2.488 ± 2.561
g-TiO
2
(brookite) 2.7004 2.5843 2.5831
TiO
2
(rutile) 2.9467 ± 2.6506
TiO
2
(anatase) 2.5688 ± 2.6584
TiO
2
(brookite) 2.809 ± 2.677
Integral normal emissivity,
e
Æ
(smooth surface) (rutile)
Temperature (K)
0.82 400
0.83 500
0.84 600
0.85 700
0.86 800
0.87 900
0.875 1000
0.88 1100
0.89 1200
0.90 1300
Monochromatic normal
emissivity, e
ln
(powder) (rutile)
Wavelength,
l (nm)
Temperature
(K)
0.27 1.0 1223
0.15 2.0 1223
U. Diebold / Surface Science Reports 48 (2003) 53±229 63
on two complementary electrodes (TiO
2
and WO
3
in the case of [57]), which change their color upon
reduction/oxidation cycles induced by an electrical current.
Polycrystalline ZnO, TiO
2
and SnO
2
, exhibit a high non-linearity between the current density and the
electric ®eld and are thus suitable as `varistors' for the suppression of high transient voltages [58].
Doped TiO
2
ceramics have useful varistor properties with non-linearity coef®cient (a) values in the
range a 3À12, a being de®ned by the relationship I KV
a
, where I is the current, V the voltage, and
K the proportionality constant. The presence of this potential barrier is due to the creation of defects
formed during sintering of TiO
2
systems. A potential barrier associated with a double space charge
distribution can originate at these defects. This phenomenon establishes variable resistance as a
function of the applied electric ®eld to the solid.
Metallic implants in the human body have a signi®cant economic and clinical impact in the
biomaterials ®eld [59]. `Commercially pure' (CP) titanium (ASTM F67) and `extra-low interstitial'
(ELI) Ti±6Al±4V alloy (ASTM F136) are the two most common implant biomaterials. There is an
increasing interest in the chemical and physical nature of the oxide layer on the surface of both
materials [60]. The oxide provides corrosion resistance and may also contribute to the biological
performance of Ti at molecular and tissue levels, as suggested in the literature on osseointegrated oral
and maxillofacial implants by Branemark, Kasemo and co-workers [61] in Sweden.
1.3. Outline of this review
The geometric structure of various TiO
2
surfaces is discussed in Section 2. A detailed knowledge of
the surface structure is the crucial ®rst step in obtaining a detailed knowledge of reaction mechanisms
Table 1 (Continued )
0.20 3.0 1223
0.30 4.0 1223
0.32 5.0 1223
0.50 6.0 1223
0.67 7.0 1223
0.76 8.0 1223
0.80 9.0 1223
0.84 10.0 1223
0.85 11.0 1223
0.86 12.0 1223
0.87 13.0 1223
0.88 14.0 1223
0.89 15.0 1223
Refractive index, n,of
rutile single crystal
for ordinary (1) and
extraordinary (2) rays
in visible and IR
regions of spectrum,
at 298 K
a
Data from [65] unless noted otherwise. A more detailed compendium of bulk properties of rutile is given in [49].
64 U. Diebold / Surface Science Reports 48 (2003) 53±229
on the molecular scale. Metal oxide surfaces are prime examples of the close relationship between
structure and reactivity [6], as local non-stochiometries or geometric defects directly affect the
electronic structure. Well-tested models are available for both, `perfect' surfaces as well as surface
defects on TiO
2
. Titanium dioxide crystallizes in three crystallographic phases, and the surfaces of the
rutile phase have been investigated extensively. Surface science research on the technologically quite
important anatase phase is just starting. The structure and stability of metal oxide surfaces can be
predicted using the concept of autocompensation [5] or non-polarity [62]. Bulk-truncated models of
various rutile and anatase TiO
2
surfaces are derived using this concept, and are compared with ab initio
calculations and experimental results on surface geometrical models and relaxations. Recent scanning
probe microscopy results have given enormous insight into defect structures at TiO
2
surfaces, and have
provided some surprises as well.
Section 3 gives a brief summary of the electronic structure of TiO
2
. Most of the basic understanding
of the electronic structure of TiO
2
surfaces has been discussed in previous reviews [1], hence this
section is kept short. Surface defects that are related to oxygen de®ciencies can be identi®ed with most
electron spectroscopies, some of which are discussed in this section.
The growth of metal and metal oxide overlayers on TiO
2
substrates is reviewed in Section 4. This is a
very active and exciting area of research, and almost all metals across the periodic table have been
investigated on TiO
2
. Most of the current literature on metal/TiO
2
growth has been summarized in
Table 6. It is comforting to see that the basic trends for the propensity of interfacial reactions, growth
morphology, geometric structure, and thermal stability that have been identi®ed early on [63] are in
agreement with the more recent results.
The surface chemistry of TiO
2
is reviewed in Section 5. The adsorption of inorganic molecules is
discussed ®rst, and the results for each group of molecules is summarized in tables. Results on small
organic molecules is then reviewed. This section closes with a brief summary of photoinduced reactions
on TiO
2
surfaces. A summary and outlook is given at the end.
2. The structure of TiO
2
surfaces
Unraveling the relationship between atomic surface structure and other physical and chemical
properties is probably one of the most important achievements of surface science. Because of the mixed
ionic and covalent bonding in metal oxide systems, the surface structure has an even stronger in¯uence
on local surface chemistry as compared to metals or elemental semiconductors [6]. A great amount of
work has been performed on TiO
2
over the years, and has lead to an understanding that is
unprecedented for a metal oxide surface.
This section starts with a brief description of the bulk structure of titanium dioxide crystals, and their
stable crystal planes. Because bulk non-stoichiometries in¯uence the surface properties of TiO
2
in a
variety of ways, a short discussion of bulk defects is included as well. A substantial part of the section is
devoted to the rutile (1 1 0) surface. The (bulk-truncated) (1 Â 1) surface is known with a very high
accuracy from experimental as well as theoretical studies. Nevertheless, there are some puzzling
disagreements between theory and experiment in some aspects [64]. Surface defects are categorized in
step edges, oxygen vacancies, line defects (closely related to the (1 Â 2) reconstruction), common
impurities, and the manifestation of crystallographic shear planes (CSPs) at surfaces. The long-standing
argument of the structure of the (1 Â 2) phase seems to be settled, as discussed in Section 2.2.2. STM
U. Diebold / Surface Science Reports 48 (2003) 53±229 65
and, more recently, atomic force microscopy (AFM), studies have revealed the complexity of the
seemingly simple rutile (1 1 0) surface, hence the section on TiO
2
(1 1 0) commences with a
recommendation on the best way to prepare this surface. The two other low-index planes, rutile (1 0 0)
and (0 0 1) are described in Sections 2.3 and 2.4, respectively. Until fairly recently the (1 Â 3)
reconstruction of the rutile (1 0 0) seemed well understood, but inconsistencies in theoretical
calculations as well as new interpretations of X-ray diffraction data show that a closer look on the
structure of this phase may be needed (Section 2.3.2.2). New developments on structural investigations
of anatase samples are included at the end.
2.1. Bulk structure
Titanium dioxide crystallizes in three major different structures; rutile (tetragonal, D
14
4h
-P4
2
/mnm,
a b 4:584 A
Ê
, c 2:953 A
Ê
[49]), anatase (tetragonal, D
19
4h
-I4
1
/amd, a b 3:782 A
Ê
, c 9:502 A
Ê
)
and brookite (rhombohedrical, D
15
2h
-Pbca, a 5:436 A
Ê
, b 9:166 A
Ê
, c 5:135 A
Ê
) [65]. (Other
structures exist as well, for example, cotunnite TiO
2
has been synthesized at high pressures and is one
of the hardest polycrystalline materials known [66].) However, only rutile and anatase play any role in
the applications of TiO
2
and are of any interest here as they have been studied with surface science
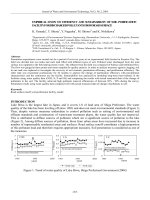
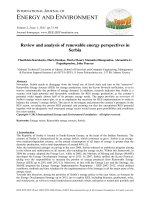
techniques. Their unit cells are shown in Fig. 2. In both structures, the basic building block consists of a
titanium atom surrounded by six oxygen atoms in a more or less distorted octahedral con®guration. In
each structure, the two bonds between the titanium and the oxygen atoms at the aspices of the
octahedron are slightly longer. A sizable deviation from a 908 bond angle is observed in anatase. In
rutile, neighboring octahedra share one corner along h110iÐtype directions, and are stacked with
their long axis alternating by 908 (see Fig. 2 as well as Fig. 6). In anatase the corner-sharing octahedra
form (0 0 1) planes. They are connected with their edges with the plane of octahedra below. In all three
TiO
2
structures, the stacking of the octahedra results in threefold coordinated oxygen atoms.
Rutile TiO
2
single crystals are widely available. They can be bought in cut and polished form from
companies such as Commercial Crystal Laboratories, USA; Kelpin Kristallhandel, Germany;
Goodfellow, UK; Earth Jewelry, Japan and many others. A very small roughness is achieved by
grinding the sample, and then polishing the surface for many hours with a chemo-mechanical treatment.
This is also referred to as epitaxial polish. Practical aspects of surface preparation and handling are
discussed in [67].
Ramamoorthy and Vanderbilt [68] calculated the total energy of periodic TiO
2
slabs using a self-
consistent ab initio method. The (1 1 0) surface has the lowest surface energy, and the (0 0 1) surface
the highest. This is also expected from considerations of surface stability, based on electrostatic and
dangling-bonds arguments discussed in Section 2.2.1.1. below. The thermodynamic stability of the
(1 0 0) surface was also considered, and was found to be stable with respect to forming (1 1 0) facets.
The (0 0 1) surface was almost unstable with respect to the formation of macroscopic (1 Â 1) (0 1 1)
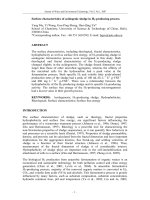
facets. From the calculated energies a three-dimensional (3D) Wulff plot was constructed, see Fig. 3.
The Wulff construction [69] gives the equilibrium crystal shape of a macroscopic crystal. For
comparison with experimental crystal shapes one has to take into account that only four planes were
considered and that the calculations are strictly valid only at zero temperature.
The experimental results on the three low-index rutile surfaces discussed below ®t rather well with
the stability expected from these calculations. For rutile, the (1 1 0), (0 0 1) and (1 0 0) surfaces have
been studied, with (1 1 0) being the most stable one. These three surfaces are discussed in this section.
66 U. Diebold / Surface Science Reports 48 (2003) 53±229
Fig. 2. Bulk structures of rutile and anatase. The tetragonal bulk unit cell of rutile has the dimensions, a b 4:587 A
Ê
,
c 2:953 A
Ê
, and the one of anatase a b 3:782 A
Ê
, c 9:502 A
Ê
. In both structures, slightly distorted octahedra are the
basic building units. The bond lengths and angles of the octahedrally coordinated Ti atoms are indicated and the stacking of
the octahedra in both structures is shown on the right side.
Fig. 3. The equilibrium shape of a macroscopic TiO
2
crystal using the Wulff construction and the calculated surface energies
of [68]. Taken from Ramamoorthy and Vanderbilt [68]. # 1994 The American Physical Society.
U. Diebold / Surface Science Reports 48 (2003) 53±229 67
The two approaches that are commonly used to predict the structure and stability of oxide surfaces are
exempli®ed in detail for the rutile (1 1 0) surface. For anatase, the (1 0 1) and the (1 0 0)/(0 1 0) surface
planes are found in powder materials, together with some (0 0 1). The (1 0 1) surface was calculated to
have the lowest surface energy, even lower than the rutile (1 1 0) surface [70]. First experimental results
on anatase (0 0 1) and (1 0 1) are discussed at the end of this section.
2.1.1. Bulk defects
The titanium±oxygen phase diagram is very rich with many stable phases with a variety of crystal
structures, see Fig. 4 [65]. Consequently, TiO
2
can be reduced easily. Bulk reduction and the resulting
color centers are re¯ected in a pronounced color change of TiO
2
single crystals from initially
transparent to light and, eventually, dark blue, see Fig. 5. These intrinsic defects result in n-type doping
and high conductivity, see Table 2. The high conductivity makes TiO
2
single crystals such a convenient
oxide system for experimentalists.
As has been pointed out recently [71], bulk defects play a major role in a variety of surface
phenomena where annealing to high temperatures is necessary, e.g. during the encapsulation of Pt
[18,20,72], in bulk-assisted reoxidation [73,74], in restructuring and reconstruction processes [75,76],
and adsorption of sulfur and other inorganic compounds [77]. The relationship between crystal color,
conductivity, bulk defects as characterized by EPR measurements, and surface structure of rutile (1 1 0)
has been investigated systematically by Li et al. [71], and the samples reproduced in Fig. 5 have been
used in this study. The electric properties in dependence on the bulk defect concentration has been
investigated in [78,79].
The bulk structure of reduced TiO
2Àx
crystals is quite complex with a various types of defects such as
doubly charged oxygen vacancies, Ti
3
and Ti
4
interstitials, and planar defects such as CSPs. The
defect structure varies with oxygen de®ciency which depends on temperature, gas pressure, impurities,
etc. Despite years of research, the question of which type of defect is dominant in which region of
oxygen de®ciency is still subject to debate [78,80]. It was shown that the dominant type are Ti
interstitials in the region from TiO
1.9996
to TiO
1.9999
(from 3:7 Â 10
18
to 1:3 Â 19
19
missing O atoms
Fig. 4. Phase diagram of the Ti±O system taken from Samsonov [65]. The region Ti
2
O
3
±TiO
2
contains Ti
2
O
3
,Ti
3
O
5
,seven
discrete phases of the homologous series Ti
n
O
2nÀ1
(Magneli phases), and TiO
2
. See [65] for a more detailed description.
68 U. Diebold / Surface Science Reports 48 (2003) 53±229
per cubic centimeter) [78]. CS planes precipitate on cooling crystals across the TiO
2Àx
(0 x 0:0035)
phase boundary [81]. They show a very strong dependence on the cooling history and are absent in
quenched specimen. The formation mechanism was reviewed by Smith et al. [81±83].SuchCSplanes
may extend all the way to the surface [84±88] and their appearance is discussed in Section 2.2.1.4.
Fig. 5. Color centers associated with bulk defects that are formed upon reduction of TiO
2
single crystals cause a change in
crystal color. (a) Photograph of rutile single crystals heated in a furnace to various temperatures: (cube 1) 19 h at 1273 K,
(cube 2) 21 h 40 min at 1450 K (was like cube 3) then reoxidized in air at 1450 K, (cube 3) 4 h 55 min at 1450 K, (cube 4)
35 min at 1450 K, (cube 5) 1 h 10 min at 1350 K. (b) Same samples after prolonged experiments on cubes 1, 3, and 4. The
samples were sputtered daily and annealed to 973 K for a total of 690 min. Adapted from Li and co-workers [71]. # 2000 The
American Chemical Society.
Table 2
Resistivity (O cm) at 300 K measured at room temperature of different TiO
2
samples
a
Cube 2 Cube 5 Cube 1 Cube 4 Cube 3
Resistivity 1835.0 108.24 46.76 24.06 8.94
a
The colors of cubes 1, 3, and 4 are shown in Fig. 5b; cubes 2 and 5 were additionally reduced. From [156].
U. Diebold / Surface Science Reports 48 (2003) 53±229 69
The diffusion mechanism for the various types of defects is quite different; oxygen migrates via a site
exchange (vacancy diffusion) mechanism, while excess Ti diffuses through the crystal as interstitial
atoms. The interstitial diffusion happens especially fast through the open channels along the (0 0 1)
direction (the crystallographic c-axis) [89,90], see Fig. 6a. A Ti interstitial located in these channels is
in an octahedral con®guration, similar to the regular Ti sites [91]. Consequently, the diffusing species in
oxidation reactions of reduced Ti
a
O
b
surfaces (where a > b=2 but probably less than b) produced by
sputtering and/or Ti deposition is the Ti atom and not the O vacancy, as has been shown in a series of
elegant experiments with isotopically labeled
18
O and
46
Ti by Henderson [73,74].
2.2. The structure of the rutile TiO
2
(1 1 0) surface
The rutile (1 1 0) surface is the most stable crystal face and simple guidelines can be used to
essentially predict the structure and the stability of TiO
2
(1 1 0)-(1 Â1). Because these concepts are
very useful for the other crystal faces of TiO
2
as well other oxide materials, they are exempli®ed for this
surface. The relaxations from the bulk-terminated coordinates are reviewed, and the types and
manifestations of defects are discussed. Although the TiO
2
(1 1 0) surface is very stable, it nevertheless
reconstructs and restructures at high temperatures under both oxidizing and reducing conditions.
2.2.1. The (1 Â 1) surface
2.2.1.1. Bulk truncation. Two concepts have been introduced to predict the stability of oxide structures.
Tasker [62] discussed the stability of ionic surfaces based on purely electrostatic considerations.
Fig. 6. (a) Ball-and-stick model of the rutile crystal structure. It is composed of slightly distorted octahedra, two of which are
indicated. Along the [1 1 0] direction these octahedra are stacked with their long axes alternating by 908. Open channels are
visible along the [0 0 1] direction. The dashed lines A and B enclose a charge-neutral repeat unit without a dipole moment
perpendicular to the [1 1 0]-direction (a `type 1' crystal plane according to the classi®cation in [62]). (b) The crystal is `cut'
along line A. The same number of Ti 3 O and O 3 Ti bonds are broken, and the surface is autocompensated [5]. The
resulting (1 1 0) surfaces are stable and overwhelming experimental evidence for such (1 Â1)-terminated TiO
2
(1 1 0) surfaces
exists.
70 U. Diebold / Surface Science Reports 48 (2003) 53±229
The second concept, autocompensation, was originally developed for surfaces of compound
semiconductors and applied to metal oxide surfaces by LaFemina [5]. The most stable surfaces are
predicted to be those which are autocompensated, which means that excess charge from cation-derived
dangling bonds compensates anion-derived dangling bonds. The net result is that the cation- (anion-)
derived dangling bonds are completely empty (full) on stable surfaces. This model allows for the partially
covalent character found in many metal oxides, including TiO
2
. Both concepts are used in a
complementary way, and represent a necessary (but not sufficient) condition for stable surface
terminations. Very often, stable metal oxide surfaces for which the structure is known are non-polar
[62] and fulfill the autocompensation criterion [5].
Tasker's and LaFemina's approaches are exempli®ed in creating a stable (1 1 0) surface (Fig. 6). In
Tasker's concept, the dipole moment of a repeat unit perpendicular to the surface must be zero in order
for the surface energy to converge. He introduced three categories for ionic (or partially ionic)
structures. Type 1 (neutral, with equal number of cations and anions on each plane parallel to the
surface) is stable. Type 2 (charged planes, but no dipole moment because of a symmetrical stacking
sequence) is stable as well. Type 3 surfaces (charged planes and a dipole moment in the repeat unit
perpendicular to the surface) will generally be unstable.
Consider, for example, the rutile structure as being composed of (1 1 0)-oriented planes such as
drawn in Fig. 6a. The top plane in Fig. 6a consists of the same number of Ti and O atoms. In a purely
ionic picture, the titanium and oxygen atoms have nominal charges of 4 and À2, respectively. Hence,
the top layer has a net positive charge. The next two layers consist of oxygen atoms, hence both of them
have a net negative charge. A Type 2 repeat unit is outlined by the dashed lines A and B in Fig. 6a. It
consists of a mixed Ti, O layer, sandwiched between two layers of oxygen atoms. The total unit does not
have a dipole moment (and from counting the charges it turns out that it is neutral as well). A crystal,
cut or cleaved
1
to expose a (1 1 0) surface, will naturally terminate with the surface created by cutting
along line A (or B) in Fig. 6a. In Fig. 6b, the top of the model is shifted along the (1 1 0) direction (cutting
the crystal in a `Gedankenexperiment'). The resulting surface is very corrugated because one `layer' of
oxygen atoms is left behind. As shown below, there is overwhelming evidence that the (1 Â 1) surface of
TiO
2
(1 1 0) closely resembles the `bulk-terminated' structure depicted in Fig. 6b.
The same surface structure is also predicted using the rules of autocompensation. In Fig. 6b, the same
number of oxygen-to-titanium bonds are broken as titanium-to-oxygen. Transferring electrons from the
dangling bonds on the Ti cations will just compensate the missing charge in the dangling bonds on the
O anions. Hence, the surface is autocompensated [5]. Note that only the longer bonds are broken when
the crystal is sliced in this way.
The rutile (1 1 0)-(1 Â1) surface in Fig. 6b contains two different kinds of titanium atoms. Along the
[0 0 1] direction, rows of sixfold coordinated Ti atoms (as in the bulk) alternate with ®vefold
coordinated Ti atoms with one dangling bond perpendicular to the surface. Two kinds of oxygen atoms
are created as well. Within the main surface plane, they are threefold coordinated as in the bulk. The so-
called bridging oxygen atoms miss one bond to the Ti atom in the removed layer and are twofold
coordinated. These bridging oxygen atoms are subject to much debate. Because of their coordinative
undersaturation, atoms from these rows are thought to be removed relatively easily by thermal
annealing. The resulting point defects (Section 2.2.1.4) affect the overall chemistry of the surface, even
in a macroscopic way [92].
1
Unfortunately, TiO
2
fractures and does not cleave well.
U. Diebold / Surface Science Reports 48 (2003) 53±229 71
A(1Â 1) LEED pattern is generally observed upon sputtering and annealing in UHV. To this
author's knowledge no quantitative LEED study has been reported, probably because of the defects are
easily created when the sample is bombarded with electrons which poses an additional complication
(see Section 2.2.1.4). A medium-energy electron diffraction (MEED) study of TiO
2
(1 1 0) employed an
ESDIAD optics with a channelplate; this setup is more sensitive than a conventional LEED apparatus,
and allows for very small electron currents to be used. The results of this study were consistent with the
(1 Â 1) structure depicted in Fig. 6b. X-ray photoelectron diffraction (XPD) spectra also ®t the expected
(1 Â 1) termination [93], as do the STM results discussed in Section 2.2.1.3.
2.2.1.2. Relaxations. Every surface relaxes to some extent. In recent years, the geometry of the
TiO
2
(1 1 0)-(1 Â1) surface has been studied in some detail both experimentally and theoretically.
The results of a surface X-ray diffraction (SXRD) experiment [94] and of several total-energy
calculations are listed in Table 3. The experimentally determined directions of atoms in the first
layers are sketched in Fig. 7. As is expected from symmetry, the main relaxations occur perpendicular to
the surface. Only the in-plane oxygens (4, 5 in Fig. 7) move laterally towards the fivefold coordinated Ti
atoms. (These relaxations are symmetric with respect to the row of fivefold coordinated Ti atoms, hence
do not increase the size of the surface unit cell.) The bridging oxygen atoms (labeled 3 in Fig. 7) are
measured to relax downwards considerably, and the sixfold coordinated Ti (1) atoms upwards. The
fivefold coordinated Ti atoms (2) move downwards and the neighboring threefold coordinated oxygen
Table 3
Displacements (A
Ê
) determined experimentally and theoretically by several groups using different computational techniques
a
Charlton,
SXRD,
experiment
Harrison,
FP-LAPW,
seven layers
Harrison,
LCAO,
seven layers
Rama-moorthy,
PW-PP-LDA,
five layers
Bates,
PW-GGA,
five layers
Lindan,
PW-PP-GGA,
three layers
Vogten-huber,
FP-LAPW,
three layers
Reinhardt,
HF-LCAO,
three layers
Ti(1) (sixfold) 0.12 Æ 0.05 0.08 0.23 0.13 0.23 0.09 À0.05 0.09
Ti(2) (®vefold) À0.16 Æ 0.05 À0.23 À0.17 À0.17 À0.11 À0.12 À0.18 À0.15
O(3) (bridging) À0.27 Æ 0.08 À0.16 À0.02 À0.06 À0.02 À0.09 À0.16 À0.14
O(4,5) [1 1 0] 0.05 Æ 0.05 0.09 0.03 0.12 0.18 0.11 À0.12 0.07
1
10Æ0.16 Æ 0.08 Æ0.06 Æ0.05 Æ0.04 Æ0.05 Æ0.05 Æ0.07 Æ0.08
O(6) 0.03 Æ 0.08 À0.09 0.02 À0.07 0.03 À0.05 ± À0.07
Ti(7) 0.07 Æ 0.04 0.07 0.14 0.06 0.12 ± ± ±
Ti(8) À0.09 Æ 0.04 À0.13 À0.10 À0.08 À0.06 ± ± ±
O(9) 0.00 Æ 0.08 À0.05 0.00 0.02 0.03 ± ± À0.02
O(10,11) [1 1 0] 0.02 Æ 0.06 À0.04 0.03 À0.03 0.00 ± ± ±
Æ0.07 Æ 0.06 Æ0.03 Æ0.03 Æ0.05 Æ0.02
O(12) À0.09 Æ 0.08 À0.04 À0.01 À0.01 0.03 ± ± ±
Ti(13) ± 0.02 0.05 ± ± ± ± ±
Ti(14) ± À0.08 À0.06 ± ± ± ± ±
O(15) À0.12 Æ 0.07 À0.07 0.01 ± ± ± ± ±
O(16,17) [1 1 0] ± À0.03 0.01 ± ± ± ± ±
[1±10] ± Æ0.02 Æ0.02
O(18) ± À0.02 0.01 ± ± ± ± ±
O(19) ± 0.02 À0.01 ± ± ± ± ±
a
The atomic labels and the directions of the experimentally determined relaxations are given in Fig. 7. The results are grouped by ®rst authors:
Charlton [94], Harrison [64], Ramamoorthy [68], Bates [249], Lindan [233], Vogtenhuber [100], and Reinhard [101]. Acronyms used are
SXRD (surface X-ray diffraction), FP-LAPW (full-potential linear augmented plane wave), LCAO (linear combination of atomic orbitals), HF
(Hartree±Fock), PW-PP (plane-wave pseudopotential), LDA (local density approximation), and GGA (generalized gradient approximation).
Indicated are the number of TiO
2
repeat units used for the various calculations. Expanded from a similar compendium given in [64].
72 U. Diebold / Surface Science Reports 48 (2003) 53±229
atoms (4, 5) upwards, causing a rumpled appearance of the surface. The relaxations in the second TiO
2
layer are approximately a factor of two smaller.
The most striking feature in the experimentally determined (relaxed) coordinates is the large
relaxation of the bridging oxygen atoms by À0.27 A
Ê
. The measured geometry would indicate a very
small bond length between the sixfold coordinated Ti atom (1) and the bridging oxygens (3) of only
1:71 Æ 0:07 A
Ê
instead of the 1.95 A
Ê
expected from the bulk structure. The relaxation results in vertical
distances of 0:89 Æ 0:13 and 1:16 Æ 0:05 A
Ê
from the sixfold (1) and ®vefold coordinated (2) Ti atoms,
respectively. This is in agreement with ion scattering measurements, where vertical distances of 87 and
1:05 Æ 0:05 A
Ê
were found [95,96]. (Another ion scattering study found the height of the bridging
oxygen atoms comparative to that of the bulk structure but the interlayer distance largely relaxed with
about À18 Æ4% [97].) Photoelectron diffraction results [98] are also in agreement with relaxations
from the X-ray diffraction work given in Table 3.
The results of total-energy calculations by several groups [64,68,99±102] are compared to the
measured relaxations in Table 3. Two complementary approaches were used, the linear combination of
atomic orbitals (LCAOs) and plane-wave techniques. Either periodic or free-standing supercells with
different numbers of layers (in the sense of Tasker's non-polar repeat units in Fig. 6a) were used. For
example, the con®guration drawn in Fig. 7 represents part of the upper half of the seven-layer slab used
by Harrison et al. [64]. Because of the localized nature of the Ti3d electrons in the TiO
2
structure,
plane-wave expansions are challenging. A rather high-energy cutoff needs to be used for convergence,
and the functional for the LDA- or GGA-based calculations may also in¯uence the results [103].In
addition, the thickness of the slab may play a role in the accuracy of the calculated geometry.
Fig. 7. Model of the TiO
2
(1 1 0)-(1 Â1) surface. The relaxations of surface atoms, determined with SRXD are indicated
[94]. The labels refer to the relaxations listed in Table 3. Redrawn from Charlton et al. [94]. # 1997 The American Physical
Society.
U. Diebold / Surface Science Reports 48 (2003) 53±229 73
The directions of the calculated relaxations agree in (almost) all the theoretical papers with the
experimentally determined coordinates. The quantitative agreement is not as good as one could expect
from state-of-the art ab initio calculations, however. As Harrison et al. [64] pointed out, the extensive
experience of calculations on bulk oxides which has been built up in recent years leads one to expect
that DFT and HF calculations will reproduce experimental bond lengths to somewhat better than 0.1 A
Ê
.
For example, the bulk structural parameters of TiO
2
rutile agree better than 0.06 A
Ê
using soft-core ab
initio pseudopotentials constructed within the LDA, and a plane-wave basis [104].
In particular, all the calculations ®nd a much smaller relaxation for the position of the bridging
oxygen atom. A possible reason for this disagreement was given by Harrison et al. [64]. All the
theoretical results listed in Table 3 are strictly valid only at zero temperature. It is conceivable that
strong anharmonic thermal vibrations at the TiO
2
(1 1 0) surface cause the discrepancy between
experimental and theoretical results. However, molecular dynamics simulations using the Carr±
Parinello approach [105] found that the average position in dynamic calculations is only relaxed by
0.05 A
Ê
rather than by 0.27 A
Ê
, discarding this explanation. Instead, it was suggested that the O atom
might relax laterally so that it is displaced into an asymmetric position.
Based on these theoretical results, the ®nite temperature has to be taken into account for a proper
evaluating diffraction results. Hopefully, future experiments will show whether a better agreement with
theoretically predicted relaxations can be achieved. When considering surface reactions, one also needs
to depart from a static picture of this and other oxide surfaces, and has to keep in mind the substantial
distortions and bond length changes that take place during such large-amplitude vibrations.
It is now well-known that adsorbates often have a signi®cant in¯uence on `re-relaxing' the surface.
Computational studies, e.g. the one given in [106] for the adsorption of Cl, clearly show strong effects
upon adsorption. Only a few experimental exist so far. For example, Cu overlayers on TiO
2
(1 1 0) cause
the Ti atoms at the Cu/TiO
2
(1 1 0) interface relax back to the original, bulk-like positions. The O atoms
relax even stronger, which was attributed to Cu±O bonding [107].
2.2.1.3. Appearance in STM and AFM. Naturally, scanning probe techniques are extremely useful tools
for studying atomic-scale structures at TiO
2
and other metal oxide surfaces, where local changes in
stoichiometry or structure can severely affect surface reactivity. On TiO
2
(1 1 0), STM and, more recently,
non-contact AFM, have been used by many different groups. These techniques have provided valuable
and very detailed insight into local surface structure. However, the interpretation of STM images of
oxides is somewhat challenging because of strong variations in the local electronic structure, and because
tips can easily `snatch' a surface oxygen atom, which can cause a change in tip states and result in
`artifacts' in STM images. There is now consensus among different groups on what is `really' observed
with STM, at least under `normal' operating conditions.
The dominant tunneling site on TiO
2
(1 1 0) surfaces has been subject to some debate in the past. In
principle, there is uncertainty as to whether the image contrast is governed by geometric or electronic-
structure effects. For TiO
2
, atomic-resolution STM is often only successful when imaging unoccupied
states (positive sample bias) on reduced (n-type) samples. In reduced TiO
2
crystals, the Fermi level is
close to the conduction-band minimum (CBM) in the 3 eV gap, and electronic conduction occurs
predominantly through high-lying donor states [78]. Under a typical bias of 2 V, electrons can thus
tunnel from the tip into states within $2 eV above the CBM, and be conducted away from the surface.
On the one hand, these CBM states have primarily cation 3d character (the valence band having
primarily O 2p character, see Section 3) so that one might expect to image the metal atoms as the
74 U. Diebold / Surface Science Reports 48 (2003) 53±229
``white'' features in STM topographs. On the other hand, the bridging oxygen atoms protrude above the
main surface plane and dominate the physical topography (see inset in Fig. 8). Hence it seems equally
plausible that geometrical considerations might dominate the contrast in STM images.
Fig. 8 shows an STM image of a stoichiometric (1 Â 1) surface. Bright and dark rows run along the
[0 0 1] direction in Fig. 8. The distance between the rows is 6:3 Æ 0:25 A
Ê
, in agreement with the unit
cell dimension of 6.5 A
Ê
along 1
10. At neighboring terraces they are staggered by half a unit cell. It is
not immediately obvious if these bright rows correspond to lines of bridging oxygen atoms or ®vefold
coordinated Ti
4
ions. The ``bridging oxygen'' rows protrude from the surface plane on a relaxed
TiO
2
(1 1 0) surface (see Table 3), so if STM were dominated by topographical effects, they would
appear as rows with high contrast in Fig. 8. There is strong evidence that, normally, this is not the case,
and that the Ti sites are imaged bright in this and similar images. Onishi and Iwasawa [108] have
observed formate ions (which are expected to adsorb to Ti sites) on top of the bright rows. This is now
con®rmed for many other adsorbates, e.g. chlorine [109] and sulfur [77] appear as bright spots on top of
bright or dark rows when adsorbed on Ti sites or oxygen sites, respectively, see Fig. 56 in Section 5.1.6.
Fig. 8. STM image of a stoichiometric TiO
2
(1 1 0)-(1 Â1) surface, 140 Ð Â140 A
Ê
. Sample bias 1.6 V, tunneling current
0.38 nA. The inset shows a ball-and-stick model of the unrelaxed TiO
2
(1 1 0)-(1 Â1) surface. There is now overwhelming
evidence that the contrast on this surface is normally electronic rather than topographic, and that the bright lines in STM
images normally correspond to the position of the Ti atoms rather than the bridging oxygen atoms. From Diebold et al. [116].
# 1998 The American Physical Society.
U. Diebold / Surface Science Reports 48 (2003) 53±229 75
A theoretical approach to determine the image contrast in STM is shown in Fig. 9. Pseudopotential
calculations were used to analyze the local density of states in the vacuum region above the surface
[110]. In rough correspondence with the experimental bias conditions, the charge density of
conduction-band states were summed up from 0 to 2 eV above the conduction-band minimum. This
quantity was then averaged over the [0 0 1] direction and plotted as a function of the other two
coordinates as shown in Fig. 9. Under constant-current tunneling conditions, the STM tip is expected to
follow roughly one of the equal-density contours several A
Ê
ngstroms above the surface. The plot in
Fig. 9a clearly shows that the charge-density contours extend higher above the ®vefold coordinated Ti
atoms when the tip is a few A
Ê
above the surface, in spite of the physical protrusion of the bridging
oxygen atoms. This con®rms that the STM is imaging the surface Ti atoms, i.e., that the apparent
corrugation is reversed from the physical one by electronic-structure effects. The slab in Fig. 9b has a
(1 Â 2) symmetry with every other bridging oxygen row missing. This con®guration has been proposed
originally to account for the (1 Â2) structure observed in LEED [111]. More recent experimental
evidence, resulting predominantly from STM measurements, has shown that this is not a likely structure
(see Section 2.2.2). However, the charge density contours in Fig. 9b indicate that single vacancies in the
bridging oxygen rows are expected to appear as bright features on the dark oxygen rows.
A different and computationally less expensive computational approach has been taken by Gu
È
lseren
et al. [112]. They have used a ®rst-principles atomic-orbital base scheme with limited self-consistency.
From analyzing the radial distributions of O and Ti wave functions, it was concluded that the STM tip
should sample electrons from different surface atoms, depending on the tip±sample separation. For
close distances (<4 A
Ê
) the contributions from the oxygen atoms should dominate, while for larger
separations, the Ti atoms are dominant. Hence a `reversal' of the tunneling site should be possible.
STM images, taken with high tunneling current and relatively low bias voltages (I
t
2:0 nA,
V
s
0:75 V) seem to con®rm this conclusion [113]. Such images show an enhanced resolution, and
Fig. 9. Contour plots of [0 0 1]-averaged charge densities associated with electron states within 2 eV of the CBM for (a) the
relaxed stoichiometric (1 Â1) surface, and (b) the relaxed oxygen-de®cient (1 Â 2) surface. Contour levels correspond to a
geometric progression of charge density, with a factor of 0.56 separating neighboring contours. To ®rst approximation, the
STM tip will follow one of the equal-density contours several A
Ê
ngstroms above the surface. From [110,116].
76 U. Diebold / Surface Science Reports 48 (2003) 53±229
alternating rows of individual dots and white rows. High resolution was also reported in [114] and has
been explained as tunneling centered at the ®vefold coordinate Ti
4
ions and at the bridging oxygen
ions. After `functionalizing' the STM tip by scanning over a Si surface with 10 V sample bias and
20 nA, enhanced resolution has been observed by another group [115]. These images were interpreted
as tunneling into the sixfold coordinated Ti atoms underneath the bridging oxygen's. The tunneling
process was interpreted as being in¯uenced by a strong chemical interaction and formation of a partial
chemical bond between Si at the tip and surface oxygen.
Two examples for spontaneous tip changes are shown in Fig. 10 [116]. In the upper half of Fig. 10a,
the lateral resolution appears to be enhanced as compared to `normal' images, and additional small,
bright spots are visible between the bright rows in some areas. This change in appearance did not
result from an intentional lowering of the tunneling resistance as in [113], but was interpreted as an
interference effect caused by a double tip with widely spaced apex atoms that are tunneling on
different terraces by the authors in [116].InFig. 10b, a spontaneous tip change occurred about half-
way through the image. At the lower half, bright spots are located between the bright rows. As
indicated in the context of Fig. 9b, the position and appearance of oxygen vacancies can be taken as a
tell-tale signal on whether the row of O or Ti are imaged, and the lower half is consistent with
imaging the Ti rows. In one report, dark spots on bright rows have been assigned as point defects at
TiO
2
(1 1 0) surfaces [117]. Consequently, bright rows were assigned as the location of bridging
oxygen atoms. The images shown in [117] resemble the upper part of Fig. 10b, where pronounced
black spots appear on the bright rows. At ®rst sight, the image shown in Fig. 10b could be taken as an
indication for image reversal caused by such a compositional change. Note that the bright rows
continue as dark rows on the right side of Fig. 10b. However, on the left side of Fig. 10b the bright
rows are in phase on the upper and lower part of the image. This indicates that the observed change in
contrast is caused by a lateral shift of the outermost atom on the tip apex rather than by an actual
image reversal.
Fig. 10. Two examples for spontaneous tip changes that give rise to a changed appearance of STM images of TiO
2
(1 1 0)-
(1 Â 1). When the tip is treated with high voltage/high current pulses the `normal' tip state is usually re-gained that renders
images as shown in Fig. 8. From [116]. # 1998 Elsevier.
U. Diebold / Surface Science Reports 48 (2003) 53±229 77