Tóm tắt: Nghiên cứu biến đổi sức căng cơ tim ở bệnh nhân nhồi máu cơ tim cấp có ST chênh lên sau can thiệp động mạch vành qua da thì đầu bằng phương pháp siêu âm đánh dấu mô.
Bạn đang xem bản rút gọn của tài liệu. Xem và tải ngay bản đầy đủ của tài liệu tại đây (253.35 KB, 27 trang )
MINISTRY OF EDUCATION AND TRAINING
MINISTRY OF DEFENCE
108 INSTITUTE OF CLINICAL MEDICAL AND PHARMACEUTICAL SCIENCES
-------------------------------------------------
NGUYEN ANH TUAN
RESEARCH on THE CHANgES IN MYOCARDIAL STRAIN
IN PATIENTS AFTER ACUTE ST ELEVATION
MYOCARDIAL INFARCTION UNDERGOING PRIMARY
PERCUTANEOUS CORONARY INTERVENTION BY
SPECKLE TRACKING ECHOCARDIOGRAPHY
Speciality: Internal Cardiovascular
Code: 62.72.01.41
ABSTRACT OF MEDICAL PHD THESIS
Hanoi – 2023
THE THESIS WAS DONE IN: 108 INSTITUTE OF CLINICAL
MEDICAL AND PHARMACEUTICAL SCIENCES
Supervisor:
1. PhD. Nguyen Thi Thu Hoai
2. Ass, Prof. PhD. Pham Nguyen Son
Reviewer:
1.
2.
3.
This thesis will be presented at Institute Council at: 108 Institute of
Clinical Medical and Pharmaceutical Sciences
Day
Month Year 2023
The thesis can be found at:
1. National Library of Vietnam
2. Library of 108 Institute of Clinical Medical and
Pharmaceutical Sciences
3. Central Institute for Medical Science Infomation and
Tecnology
1
INTRODUCTION
1. Necessity of the thesis
Acute ST elevation myocardial infarction (STEMI) is the
myocardial necrosis caused by acute total occlusion coronary artery
with ST segment elevation on electrocardiogram. Although, there are
a lot of advantages on diganosis, treatment STEMI, specially
reperfusion methods such as Percutaneous cororary intervention
(PCI), the heart failure, Major adverve cardiac event (MACE) such as:
re-infarction, stroke and re-hospitalization…and other complications:
arrhythmias and left ventricular remoderling (LVR)… commonly
happen.
Quantitative left ventricular function plays an important role in
treatment and prognosis of patients with myocardial infarction.
Echocardiography has been becoming common method to assessment
of left ventricular and risk stratification of patients with myocardial
infarction. Ejection fraction
(EF) and wall motion score index
(WMSI) are commomny used in the clinical practice. However, EF
will be normal if infact region is outside of the view of
echocardigraphy, or compensative movement of other myocardial
regions or chance in preload and afterload. EF depends on geometry
formular. Assessment of abnormal regional motion is often subjective
Speckle tracking echocardiography is a new method that could
objectively evaluate left ventricular function and early detection of
subtle changes of not only cardiac wall regional function but also
global cardiac function. It does not depend on angle of ultrasound
beam. It has been evaluated more useful than EF in assessment of left
ventricular function. Quantitative of global longitudinal strain (GLS)
2
can early detection of dysfunction region in longitudinal direction and
early detection patients at high risk of adverse events after myocardial
infarction even EF in normal range. GLS could also predict LVR in
patient with myocardial infarction
2. Meaning of the study
2D speckle tracking echocardiography in patients with ST
elevation myocardial infarction after PCI could early detection
patients with left ventricular dysfunction even EF in normal range. It
also showed an improvement in cardiac function over time.
GLS could also predict MACE, mortality and LVR in STEMI
patients after PCI. Thereby it hepls clinicans early identify patients
with high risks to manage and monitor more closely.
3. Objectives of the study
1. To survey the change in myocardial strain by 2D speckle
tracking echocardiography in patients after acute ST elevation
myocardial
infarction
(STEMI)
were
treated
with
primary
percutaneous coronary intervention (PCI)
2. To study the predictive value of left ventricular global
longitudinal strain (GLS) for major adverse cardiac events (MACE)
and mortality in patients after acute ST elevation myocardial
infarction (STEMI) were treated with primary PCI
4. Layout of thesis
The thesis has 127 pages, including 2 pages of introduction, 31
pages of overview, 24 pages of objects and methods, 34 pages of
research results, 33 pages of discussion, 2 pages of conclusion and 1
page of recommendation. There are 37 results tables, 18 charts, 2
figures, 18 pictures and 191 references (11 Vietnamese and 180
English).
3
Chapter 1
OVERVIEW
1.1. Overview of acute myocardial infarction
1.1.1. Definition of myocardial infarction
According to The fourth universal definition of myocardial
infarction 2018. The term myocardial infarction (MI) should be used
when there is evidence of acute myocardial injury with clinical evidence
of acute myocardial ischemia and elevated cardiac troponin values
(cTn) with at least one value above the 99th percentile upper reference
limit (URL). and at least one of the following: Symptoms of myocardial
ischaemia or/and new ischaemic ECG changes, or/and development of
pathological Q waves on ECG, or/and imaging evidence of new loss of
viable myocardium or new regional wall motion abnormality, or/and
Identification of a coronary thrombus by angiography or autopsy.
1.1.2. Pathology of acute myocardial infarction
Myocardial infacrtion is myocardial necrosis due to obstruction
of blood flow to the myocardium. Common causes are cracking,
rupture, ulceration, erosion of the atherosclerotic plaque or coronary
artery spasm or thrombosis from elsewhere. The main mechanism of
acute MI is the sudden rupture of the atherosclerotic plaque. As a
result, a thrombus is formed that completely fills the lumen, leading to
sudden myocardial ischemia and myocardial necrosis
1.1.3. Complication of ST elevation myocardial infarction
Common complications are: LVR, heart failure, arrhythmia,
recurrent MI, mechanical complications...
1.1.4. Prognosis of ST elevation myocardial infarction
Based on clinical features, laboratory tests, prognostic models
such as TIMI score, GRACE score.
4
1.2. Role of 2D Speckle tracking echocardiography in the
assessment of cardiac function
1.2.1. Concept of strain and strain rate
1.2.1.1. Strain
Strain (S) describes the deformation of an object normalized to
its original shape and size
1.2.1.2. Strain rate
1.2.2. 2D Speckle tracking echocardiography
1.2.2.1. Speckle formation
1.2.2.2. Speckle tracking
1.2.2.3. Assessment of strain and strain rate by speckle tracking
1.2.3. Application of speckle tracking echocardiography for
assessment of cardiac function
1.2.3.1. Longitudinal strain
Longitudinal strain represents myocardial deformation directed
from the base to the apex. During systole, ventricular myocardial
fibers shorten with a translational movement from the base to the apex,
so that it has negative value
1.2.3.2. Circumferential strain
Describe the shortening of the nuclei along the circumference
of the heart and achieved on the short axial view.
1.2.3.3. Radiation strain
Describe the deformation of the myocardium in the radial
direction (towards the center of the heart chambers)
1.2.3.4. Twisting and Torsion
1.2.4. Clinical applications of speckle tracking echocardiography
1.2.5. Factors that may influence strain value
5
1.2.6.
Advantages
and
disadvantages
of
speckle
tracking
echocardiography
1.3. Several studies using speckle tracking echocardiography in
patients with myocardial infaection.
1.3.1. International studies
Cimino. S et al studied 20 STEMI patients showed that GLS
closely correlated with both EF and WMSI by Cardiac megnetic
resonance (CMR) (r= -0.86; p = 0.001 and r = 0.8; p = 0.001) and
significant correlated with both EF and WMSI by speckle traking
echocardiography (r= -0.65; p = 0.001 and r = 0.53; p = 0.013)
Yang Y studied 387 STEMI patients were treated by PCI and
monitored within 6 months. The results showed that MACE was 24.8
Zaliaduonute-Peksiene D et al studied 82 STEMI patients and
motitored within 4 months. The result showed that LVR was 34.1%.
GLS was an independent predictor of LVR after acute myocardial
infarction with cut off point was -1.6 (sensitivity: 78% and specificity:
73%).
Ersbөll M et al studied 548 patients with acute myocardial
infarction. Echocardiography was done within 48 hours of admission.
The results showed that GLS of patients with Killip class > 1 was
significantly impaired compared with patients with (Killip class 1)
(−14.6 ± 3.3% vs −10.1 ± 3.5%, P < 0.0001)
1.3.2. Vietnamese studies
Trinh Viet Ha et al studied 125 patients with acute coronary
syndrom without ST elevation myocardial infarction by 2D speckle
tracking echocardiography. The results showed that GLS before and
after PCI within 48 hours and after 30 days gradualy improved
respectively: -16.94 ± 3.37 % ; -17.31 ± 3.22 %; -18.59 ± 3.34 %. GLS
6
could predict MACE within 6 months with AUC = 0.945 (95%CI:
0.896 – 0.985) p < 0.001. In multivariates Cox model, GLS was
independent predictor with HR = 1.72 (95%CI: 1.12 – 2.89) p < 0.05.
Chapter 2
SUBJECTS AND METHOD
2.1. Studying subjects:
- Patient group: 118 STEMI patients at first time were treated
by primary PCI at Cardiovascular Institude – Bach Mai hospital from
january 2016 to March 2019
- Control group: 60 normal people
2.1.1. Patient group
2.1.1.1. Selection creteria
- Patients were diagnosised STEMI according to The third
universal definition of myocardial infarction with ST elevation
- Were underwent coronary angiography and intervention
- Agree to participate in the study.
- Got enough data at time of asessment
2.1.1.2. Exclusion creteria
- History of MI, serious disease, severse valvular disease,
cardiomyopathy, history of left bundle branch block, atrial fibrilation.
- Complication of PCI, was being taken inotropic drugs
- The echocardiogram is unsatisfactory for evaluation
2.1.2. Control group
2.1.2.1. Selection creteria
- Normal people with no cardiovascular disease volunteer to
participate in the study. The subjects were similar in age and sex with
the disease group.
7
2.1.2.2. Exclusion creteria
- Disagree to participate in the study
- The echocardiogram is unsatisfactory for evaluation
2.2. Methodology
2.2.1. Study design
- A coss-sectional descriptive and prospective cohort sudy.
2.2.2. Study sample and the way to select subjects
2.2.2.1. Study sample
* Patient group
- Apply the formula for calculating sample size to a ratio
- Lacalzada studied 97 STEMI patients who were treated by PCI
and followed up at least 6 months. The result showed that MACE was
20.6. So we chose p = 0.2, d = 0.08. So n = 96.
- In this study, ours sample size was 118 patients.
* Control group: We chose 60 normal people
2.2.2.2. The way to select subjects
* Patient group
- Patients were selected in the study if they met the above
selection criterias. We took conssecutively 118 patients. Each patient
was monitored within 6 months at the following times: after 1 day,
after 3 days, after 1 month, after 3 months and after 6 months.
* Control group: Normal people who volunteered to the study
2.2.3. Time duration and place of the study
2.2.3.1. Time duration of the study: from january 2016 to March 2019
2.2.3.2. Place of the study: Cardiovascular Institude – Bach Mai
hospital
2.2.4. Steps to conduct research
- Step 1: Create medical records according to the research form
8
- Step 2: Clinical exam
- Step 3: Record the results of blood tests, electrocardiograms,
PCI in the patient's medical records
- Step 4: Treatment according to ESC guidelines 2012, 2017
- Step 5:, The patients were had blood tests and
echocardiographies within 24 hours and 3 days after PCI
- Step 6: The patients were had blood tests and
echocardiographies after 1 month, 3 months, 6 months. Record
cardiovascular events
- Step 7: Collecting and processing research data
2.2.5. Step to conduct 2D speckle traking echocardiography
- Step 1: Image acquisition: Record motion images in 3chamber, 4-chamber, and 2-chamber long-axis order for at least 3
consecutive cycles
- Step 2: Image analysis: Motion images were analyzed by
AFI software available on the ultrasound machine. The software
divides the left ventricle into 6 segments
Images 2.5-8. Longitudinal strain in 3-chamber, 4-chamber, and
2-chamber long-axis and GLS
2.2.6. Data processing
The data were processed and analyzed using the program
Stata 14.1
9
Chapter 3
RESEARCH RESULTS
We conducted a study, including 118 STEMI patients and 60
normal people without any real cardiovascular diseases, similar in age,
gender, height and weight to the patient group at the Cardiovascular
Institute, Bach Mai Hospital. Results were as follows
3.1. Studying subject characteristics
3.1.1. General characteristics
Mean age of the STEMI patients was: 64.73 ± 11.88 year. The
characteristics of age, gender, height, weight BMI and BSA of the
patient group were similar to those of the control group. The difference
was not statistically significant with p > 0.05. In the patient: men
accounted for the majority of 81.4%, hypertension (64.4%), obesity
(48.3%), dyslipidermia (42.4%), diabetes mellitus (25.4%)
3.1.2. Clinical characteristics of STEMI group
Mean heart rate: 91.9 ± 14.8 (beat/min), systolic blood pressure:
125.3 ± 20.4 mmHg, typical chest pain: (78%). 44.1% of patients
received early intervention before 12 hours
Heart rate, systolic blood pressure and diastolic blood pressure
of patient group were all higher than those of the control group. The
differences were statistically significant with all p < 0.01.
3.1.3. Echocardiographic characteristics of the patient group 1 day
after PCI
Mean E-wave velocity: 79.19 ± 16.14 (cm/s), mean A-wave
velocity: 91.25 ± 18.23 (cm/s), mean E/A ratio: 0.89 ± 0.27, mean E/e’
ratio: 11.69 ± 3.16, mean Dd: 46.40 ± 4.98 (mm), mean Ds: 35.42 ±
4.94 (mm), mean EVD: 87.99 ± 17.39 (ml), mean ESV: 48.08 ± 12.45
10
(ml), mean EF: 45.29 ± 6.96 (%), WMSI: 1 .45 ± 0.23, average GLS:
-11.91 ± 3.29 (%). On the other hand, the GLS of the control group
was: -20.41 ± 0.71 (%).
3.1.4. Major adverse cardiac events in 6 months
During 6 months of follow-up, there were 26 cases of MACE,
accounting for 22%. In which, re-hospitalization for heart failure was
the main with 15 cases, accounting for 12.7%, general mortality was
10 patients, accounting for 8.5%. There was 27.8% of patients with
LVR after 6 months.
3.2. The change in myocardial strain by 2D speckle tracking
echocardiography in patients after acute ST elevation myocardial
infarction (STEMI) were treated with primary percutaneous
coronary intervention (PCI)
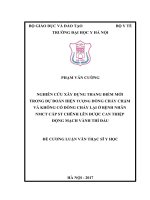
Figure 3.6. Changes in GLS over time
11
Table 3.12. Changes in GLS by group early and late PCI
GLS after PCI (%)
Time from
chest pain to
PCI
≥ 12 hours
< 12 hours
n
1 day
(n = 118)
3 days
(n = 118)
1 month
(n = 118)
3 months 6 months
(n = 112) (n = 108)
(1)
(2)
(3)
(4)
(5)
52
52
52
50
48
X ± SD -12.07 ± 3.19 -12.33 ± 2.85 -13.59 ± 2.74 -14.18 ± 2.59 -14.51 ± 2.44
p
n
p(1-2) = 0.03 p(2-3)< 0.001 p(3-4) = 0.27 p(4-5) = 0.52
66
66
66
X ± SD -11.78 ± 3.37 -12.16 ± 3.09 -13.18 ± 2.97
p
p
62
60
-14.04 ± 2.53 -14.49 ± 2.40
p(1-2)< 0.001 p(2-3)< 0.001 p(3-4) = 0.08 p(4-5) = 0.3
0.64
0.77
0.44
0.79
0.96
Table 3.14. Change in GLS according to Killip class
GLS Sau can thiệp (%)
Killip class
Killp I
n
X ±SD
1 day
(n = 118)
(1)
3 days
n = 118
(2)
1 month
(n = 118)
(3)
3 months
(n = 112)
(4)
6 months
(n = 108)
(5)
89
89
89
87
85
-12.44 ± 3.21 -12.68 ± 2.94 -13.85 ± 2.77
Killip II, III
p
p
n
X ±SD
-14.46 ± 2.51-14.76 ± 2.44
p(1-2) < 0.01 p(2-3)< 0.001 p(3-4) = 0.13 p(4-5) = 0.43
29
29
29
25
23
-10.28 ± 3.01 -10.86 ± 2.70 -11.86 ± 2.69 -12.85 ± 2.30 -13.50 ± 2.00
p
p(1-2)< 0.01 p(2-3)< 0.001 p(3-4) = 0.15
< 0.01
< 0.01
< 0.001
< 0.01
p(4-5) = 0.3
< 0.05
12
Table 3.15. GLS changes according to the culprit artery group
GLS after PCI (%)
culprit
artery
LAD
n
1 day
(n = 118)
(1)
3 days
(n = 118)
(2)
1 month
(n = 118)
(3)
3 months
(n = 112)
(4)
6 months
(n = 108)
(5)
69
69
69
65
62
X ±SD -10.68 ± 2.81 -11.17 ± 2.56 -12.42 ± 2.47 -13.25 ± 2.36 -13.60 ± 2.32
p
LCX
n
p(1-2)< 0.001 p(2-3)< 0.001 p(3-4)=0.05
11
11
11
11
p(4-5) = 0.4
10
X ±SD -12.61 ± 2.46 -12.79 ± 2.28 -13.85 ± 2.35 -14.19 ± 2.43 -15.04 ± 1.56
p
RCA
n
p(1-2) = 0.2 p(2-3)< 0.001 p(3-4) = 0.02 p(4-5) = 0.36
38
38
38
36
36
X ±SD -13.93 ± 3.29 -14.00 ± 3,02 -14.91 ± 3.02 -15.61 ± 2.24 -15.88 ± 2.04
p
p
p(1-2) = 0.54 p(2-3)< 0.001 p(3-4) = 0.26 p(4-5)< 0.01
< 0.001*
< 0.001*
< 0.001*
< 0.001*
< 0.001*
Kruskal-Wallis . test
Table 3.19. Changes GLS by TMP group
GLS after PCI (%)
TMP
group
TMP < III
TMP III
n
1 day
(n = 118)
3 days
(n = 118)
1 month
(n = 118)
3 months
(n = 112)
6 months
(n = 108)
(1)
(2)
(3)
(4)
(5)
69
69
69
68
65
X ±SD -12.59 ± 3.20 -12.84 ± 2,86 -13.92 ± 2.68
p(1-2) < 0.01 p(2-3)< 0.001
p
n
49
49
49
-14.50 ± 2.40-14.95 ± 2.25
p(3-4) = 0.19 p(4-5) = 0.26
44
43
X ±SD -10.95 ± 3.19 -11.38 ± 2.94 -12.57 ± 2.96 -13.49 ± 2.67 -13.80 ± 2.50
p(1-2)< 0.001 p(2-3)< 0.001 p(3-4) = 0.12 p(4-5) = 0.57
p
p
< 0.01
< 0.01
0.01
0.04
0.01
13
Table 3.21. Changes GLS by EF group
GLS after PCI (%)
EF
EF < 40%
n
1 day
(n = 118)
(1)
3 days
(n = 118)
(2)
1 month
(n = 118)
(3)
3 months
(n = 112)
(4)
6 months
(n = 108)
(5)
23
23
23
17
16
X ±SD -8.56 ± 2.12 -9.38 ± 1.96 -10.33 ± 2.13 -11.64 ± 1.74 -12.03 ± 1.43
p
40% ≤ EF<
50%
n
p(1-2)<0.001p(2-3)< 0.001 p(3-4)< 0.05 p(4-5)=0.48
63
63
63
63
60
X ±SD -11.83 ± 2.60 -12.05 ± 2.41 -13.30 ± 2.24 -13.79 ± 2.19 -14.21 ± 2.04
p
EF ≥50%
n
p(1-2)=0.018p(2-3)< 0.001 p(3-4)<0.001p(4-5) = 0.28
32
32
32
32
32
X ±SD -14.48 ± 2.97 -14.65 ± 2.62 -15.66 ± 2.35 -16.02 ± 2.17 -16.27 ± 2.13
p
p
p(1-2) = 0.15p(2-3)< 0.001 p(3-4) = 0.02p(4-5)=0.001
< 0.001*
< 0.001*
< 0.001*
< 0.001*
< 0.001*
Kruskal-Wallis . test
3.3. Predictive value of left ventricular global longitudinal strain
for major adverse cardiac events and mortality in patients after
acute ST elevation myocardial infarction were treated with
primary PCI.
3.3.1. Predictive value of major adverse cardiac events
1.00
14
0.50
độ nhạy
0.75
điểm cắt gls = - 9,5%
AUC = 0.95 (95%CI: 0,91 - 0,99)
0.25
Se = 84,6%
Sp = 94,6%
PPV = 81,5%
0.00
NPV = 95,6%
0.00
0.25
0.50
1 - độ đặc hiệu
0.75
1.00
Figure 3.12. Value of GLS predicts MACE for 6 months
Table 3.26. MACE predictive value after 6 months of some factors
GLS
EF
NThs-TnT
CRP.hs
(%)
(%)
proBNP
(ng/ml)
(mg/l)
(pmol/l)
AUC
0.95
0.85
0.94
0.82
0.67
95% CI 0.91 – 0.99 0.76 – 0.94 0.89 – 0.98 0.74 – 0.900.56 – 0.79
p
< 0.001
< 0.001
< 0.001
< 0.001
< 0.01
Table 3.27. Prognostic factors for MACE after 6 months
Factors
Univariate: HR
(95% CI)
p
Multivariate:HR
(95% CI)
p
GLS (%)
1.84 (1.52 – 2.24) < 0.001
EF (%)
0.81 (0.76 – 0.87)
<0.001
Killip ≥ II
3.53 (1.63 – 7.63)
0.001
1.31 (0.42 – 4.13)
0.64
4.24 (1.46 – 12.30)
< 0.01
1.76 (0.53 – 5.83)
0.35
Culprit leasion
LAD
1.53 (1.14-2.04) < 0.01
0.93 (0.85 – 1.03)
0.16
15
1.49 (0.68 – 3.23)
0.32
1.39 (0.48 – 4.02)
0.55
Gensini score
1.02 (1.00 – 1.04)
0.012
Early PCI (<12
0.94 (0.43 – 2.03)
> 0.05
Number of
damaged ≥ 2
TIMI after PCI <
III
0.99 (0.97-1.01)
0.48
1.01 (1.01 – 1.02) < 0.001
1.78 (1.01 – 3.15)
0.046
hs-TnT
1.32 (1.14 – 1.53) < 0,001
0.82 (0.59 – 1.14)
0.24
CRP.hs
1.19 (1.07 – 1.33)
< 0.01
1.04 (0.88 – 1.23)
0.65
TIMI score
1.27 (1.07 – 1.52)
< 0.01
1.03 (0.80 – 1.33)
0.81
GRACE score
1.01 (0.99 – 1.03)
0.076
giờ)
NT-proBNP/100
(pmol/l)
1.00
3.3.2. Mortality predictive value of GLS
0.50
độ nhạy
0.75
điểm cắt: gls = -8,4%
AUC = 0,96 (95%CI: 0,92 - 0,99)
Se = 100%
0.25
Sp = 88,9%
PPV = 45,5%
0.00
NPV = 100%
0.00
0.25
0.50
1 - độ đặc hiệu
0.75
Figure 3.15. GLS value predicts mortality in 6 months
1.00
16
Table 3.29. Predictive value of mortality after 6 months of some factors
GLS
EF
NT-proBNP
hs-TnT
CRP.hs
(%)
(%)
(pmol/l)
(ng/ml)
(mg/l)
0.96
0.86
0.93
0.81
0.73
0.92 - 0.99
0.76 - 0.97
0.89 – 0.98
0.71 – 0.92
0.54 – 0.92
< 0.001
< 0.001
< 0.001
< 0.05
< 0.05
AUC
95% CI
p
Table 3.30. Prognostic factors of mortality after 6 months
Univariate:HR
Factors
(95% CI)
Multivariate:HR
p
(95% CI)
p
GLS (%)
2.26 (1.51 – 3.39) < 0.001 1.87 (1.04-3.34)
0.035
EF (%)
0.80 (0.72 – 0.89) < 0.001
0.93 (0.80 – 1.09)
0.38
0.015
0.99 (0.16 – 6.02)
0.99
Culprit leasion LAD 1.67 (0,43 – 6.45)
0.46
1.76 (0.53 – 5.83)
0.35
Number of damaged 1.57 (0.44 – 5.58)
0.48
0.99 (0.97-1.01)
0.48
Killip ≥ II
4.84 (1.37 – 17.17)
branches ≥ 2
TIMI after PCI < III 0.81 (0.10 – 6.36)
0.84
Gensini score
1.02 (0.99 – 1.04) 0.17
Early PCI (≤12 giờ)
1.19 (0.34 – 4.22) 0.79
NT-proBNP/100
4.16 (2.20 – 7.85) < 0.001 2.11 (0.78 – 5.71)
0.14
hs-TnT
1.37 (1.09 – 1.72) < 0.01
0.74 (0.42 – 1.33)
0.31
CRP.hs
1.20 (1.03 – 1.41) 0.021
1.05 (0.81 – 1.36)
0.70
TIMI score
1.48 (1.11 – 1.98) < 0.01
1.30 (0.91 – 1.87)
0.81
GRACE score
1.02 (0.99 – 1.05) 0.065
(pmol/l)
17
0.75
1.00
3.3.3. Predictive value of left ventricular remodeling of GLS
0.50
độ nhạy
điểm cắt gls = -9,8%
AUC = 0,84 (95%CI: 0,74 - 0,95)
0.25
Se = 70%
Sp = 94,9%
0.00
PPV = 84%
NPV = 89%
0.00
0.25
0.50
1 - độ đặc hiệu
0.75
1.00
Figure 3.17. GLS value predicted LVR after 6 months
Table 3.33. Predictive value of LVR after 6 months of some factors
GLS
EF
(%)
(%)
AUC
0.84
95% CI
p
NT-proBNP
hs-TnT
CRP.hs
(pmol/l)
(ng/ml)
(mg/l)
0.75
0.78
0.75
0.68
0.74 - 0.95
0.64 - 0.86
0.68 – 0.89
0.66 – 0.84
0.56 – 0.79
< 0.001
< 0.001
< 0.001
0.01
0.01
GLS after PCI 1 day had the best predictive value for LVR after 6
months of the above prognostic factors
Chapter 4
DISCUSSION
4.1. Characteristics of the STEMI patients
4.1.1. General characteristics
4.1.2. Some clinical characteristics
4.1.3. Major adverse cardiac events
18
4.2. The change in myocardial strain by 2D speckle tracking
echocardiography in patients after acute ST elevation myocardial
infarction (STEMI) were treated with primary percutaneous
coronary intervention (PCI).
Our study results showed that, GLS after myocardial infarction
1 day decreased to -11.91 ± 3.29 (%) compared to the control group
with -20.41 ± 0.71 (%). This is understandable because of myocardial
infarction is damage and necrosis of an area of the myocardium due to
coronary occlusion. Therefore, this area of necrotic myocardium will
decrease or lose its ability to contract, thereby leading to a decrease in
regional and global strain of the left ventricle. On the other hand,
recanalization of the culprit artery actually opened only the great
artery in the epicardial region. Myocardial damage can still progress
due to ischemia in the microvasculature due to no or no reflow after
PCI or from reperfusion phenomenon. Therefore, most patients after
PCI, cardiac function (EF) and GLS decrease.
The results of figure 3.6 showed that GLS tended to improve
gradually over time, but still decreased more seversely than that of the
control group. GLS improved clearly after 3 days, after 1 month and
after 3 months. GLS tended to be more stable after 6 months. To explain
this phenomenon, we relied on the pathophysiological of myocardial
infarction. Myocardial infarction results in the loss of a number of
myocardial contractile cells, thereby increasing the burden on the heart
and leading to specific changes in LVR at the margins and distal of the
infarction. Myocyte necrosis and increased cardiac burden activate a
series of biochemical changes intracellular that lead to initial changes
and subsequent repair including dilation, hypertrophy, and formation of
collagen scar. LVR usually begins a few hours after myocardial
19
infarction and persists for several weeks or months until the tensile
strength of the collagen scar is equal to the distending forces. This
balance determines the size, location, and transmurality of the infarcts,
as well as the extent of myocardial stunning. In summary, besides the
ischemic myocardial necrosis, the process of wound healing and
adjustment of neurological and humoral changes to ensure cardiac
output always takes place in parallel. This process occurs immediately
after infarction and lasts several weeks to months, so GLS also improves
gradually over time after myocardial infarction. However, we found that
GLS improved most clearly in the first 3 months. This contributes to
reflecting the steady state of the myocardium after infarction is usually
3 months. The results of our study were similar to some other studies
such as the study of author Lustosa on 350 STEMI patients showed that
the initial GLS was -15 ± 4 (%), GLS after 3 months was - 17 ± 3 (%).
The results in table 3.12 showed that, both early PCI groups (<12
hours) and late PCI group (≥ 12 giờ), GLS improved after 3 days and
after 1 month, with all p < 0.05. GLS in the late PCI group decreased
more severely than that in the early PCI group at all time points after
PCI 1 day, 3 days, 1 month, 3 months and after 6 month. However, the
difference was not statistically significant with p > 0.05.
The results in table 3.14 showed that both Killip I and Killip (II,
III) groups, GLS improved after 3 days and after 1 month with all p <
0.01. GLS in the Killip group (II, III) after PCI 1 day decreased worse
than that in the Killip I group with p < 0.01. The difference between the
two groups mentioned above continued to occur after PCI 3 days, after
1 month, after 3 months and after 6 months with all p < 0.05.
The results in table 3.15 showed that the GLS of the LAD, LCX
and RCA culprit arteries were not the same with all p < 0.001. In which,
20
GLS in the LAD culprit artery group reduced the most severely. In the
LAD culprit artery group, GLS improved immediately after PCI 3 days,
1 month with all p < 0.001. In the LCX culprit artery group, the GLS
improved after 1 month and after 3 months with all p < 0.05. In the RCA
culprit artery group, GLS improved after 1 month and after 6 months
with all p < 0.001.
The results in table 3.19 showed that both TMP III group and
TMP < III group after PCI, GLS improved after 3 days, after 1 month
with all p < 0.01. GLS in the TMP < III group decreased worse than that
in the TMP III group at the time of evaluation with p < 0.05
The results in table 3.21 showed that the group with EF < 40%
and group 40% ≤ EF < 50%, GLS improved after PCI 3 days, after 1
month and after 3 months with all p < 0.05. The group with EF ≥ 50%,
GLS improved after 1 month, 3 months and after 6 months with all p <
0.05. GLS of different EF groups were different at the same time of
assessment with p all < 0.001. In which, GLS in the group with EF <
40% was the worst
4.3. Predictive value of left ventricular global longitudinal strain
for major adverse cardiac events and mortality in patients after
acute ST elevation myocardial infarction were treated with
primary PCI.
4.3.1. Predictive value of major adverse cardiac events
Our study results showed that GLS predicted MACE well with
AUC = 0.95 (95%CI: 0.91 – 0.99) At the cut-off point of GLS = -9.5
% determined MACE with sensitivity = 84 ,6%; specificity = 94.6%;
positive predictive value = 81.5%; negative predictive value = 95.6%.
The ability to predict MACE of GLS was better than NT-proBNP, EF,
hs-TnT, CRP hs. In the multivariate analysis, only 2 factors had
21
independent prognostic value: GLS with HR = 1.53 (95% CI: 1.14 –
2.04) p < 0.01 and NT-proBNP/100. with HR = 1.78 (95%CI: 1.01 –
3.15) p < 0.05. Our study results were similar to Cong Tao's study. It
showed that GLS had a predictive value for MACE. At the cut-off
point of GLS = -9.55% had a predictive value of MACE with
sensitivity = 83.3% and specificity = 83.5%
Thus, GLS could predict MACE even better than EF. This can
be explained that the EF is often overestimated and the repeatability
of the measurement is also low. GLS is less dependent on afterload
than EF, so that GLS reflects the contractility of the myocardium
better than EF, especially in situations with changes in chamber
pressure such as acute myocardial infarction.
4.3.2. Mortality predictive value of GLS
Research results showed that GLS had a good predictive ability
of mortality with AUC = 0.96 (95% CI: 0.92 - 0.99) At the cut-off
point of GLS ≥ -8.4 % determined mortality with sensitivity = 100%;
specificity = 88.9%; positive predictive value = 45.5%; negative
predictive value = 100%. The ability to predict mortality of GLS was
better than NT-proBNP, EF, hs-TnT, CRP hs. In multivariate analysis,
only GLS was an independent prognostic factor with HR = 1.87
(95%CI: 1.04 – 3.34) p < 0.05.
Our study’s results were similar to those of Abou R et al. They
studied 1000 STEMI patients underwent PCI and followed up for an
average of 117 months. Results showed that 23% of patients died. GLS
in the death group decreased more severely than that in the surviving
group with values of -12.0 ± 3.5 (%) and -14.2 ± 3.5 (%), respectively,
the difference was statistically significant with p < 0.001. In
multivariate Cox regression analysis predicting mortality, GLS was an
22
independent prognostic factor with HR = 1.062 (95% CI: 1.006 –
1.122) p < 0.05. Thus, GLS associated with mortality and had
predictive value for mortality in STEMI patients treated with PCI.
4.3.3. Predictive value of left ventricular remodeling of GLS
In this study, we chose to the change ESV ≥ 20% compared to
baseline to determine LVR. Study results showed that GLS predicted
LVR at a good level with AUC = 0.84; 95%CI (0.74 - 0.95) At the cutoff point of GLS ≥ -9.8 % determined LVR with sensitivity = 70%;
specificity = 94.9%; positive predictive value = 84%; negative
predictive value = 89%. The ability to predict LVR of GLS was better
than NT-proBNP, EF, hs-TnT, CRP hs.
Our study results were also consistent with the assessment of
Lacalzada et al studied 97 STEMI patients underwent PCI. It showed
that GLS had a predictive value for LVR after 6 months with AUC =
0.88 (95%CI: 0.79 – 0.96) p < 0.001
LIMITATION OF THE THESIS
Our study mainly consisted of mild and moderate STEMI
patients (Killip I, II). Because patients with Killip III and IV often had
severe developments even successful PCI,. They often required
vasopressor, antiarrhythmic drugs, etc., thus affecting the assessment
of cardiac function and technical difficulties. Therefore, the study’s
results were not representative of STEMI patients in general.
CONCLUSION
Through the GLS study of 118 STEMI patients and 60 healthy
people, we had the following conclusions:
1. Survey the change in myocardial strain by 2D speckle
tracking echocardiography in patients after acute ST elevation
23
myocardial infarction (STEMI) were treated with primary
percutaneous coronary intervention (PCI).
- GLS after PCI 1 day decreased worse than that of the control
group (-11.91 ± 3.29% vs -20.41 ± 0.71%; p < 0.001)
- GLS improves gradually over time. GLS after 3 days, 1 month,
3 months, 6 months respectively: -12.23 ± 2.79%; -13.36 ± 2.87%; 14.10 ± 2.55%; -14.50 ± 2.40% with all p < 0.001 in the following
comparison (1 day with 3 days), (3 days with 1 month) and p < 0.05
in comparison (1 month with 3 months).
- GLS of the non-hypertensive group improved after PCI 1
month, 3 months, and 6 months with all p < 0.001. GLS in the
hypertensive group improved after 3 days and 1 month with all p <
0.001. GLS of the hypertensive group decreased worse than that of the
non-hypertensive group at the evaluation stages with all p < 0.001.
- The culprit artery was LAD, GLS improved after PCI 3 days
with p < 0.001. The culprit arteries were LCX and RCA, GLS improved
after 1 month with all p < 0.001. GLS of the LAD, LCX and RCA culprit
arteries were not the same (p < 0.001) at the assessment time-points.
In the groups with 1 or 2 damaged coronary arteries, the GLS
improved after PCI 3 days and after 1 month with all p < 0.01. In the
group with 3 damaged coronary arteries, GLS only improved after 1
month with p < 0.01.
GLS of different EF groups were different at the same time with
all p < 0.001. In which, GLS of group with EF < 40% decreased the most.
Group with EF < 40% and group with 40% ≤ EF < 50%, GLS improved
after PCI 3 days, after 1 month with all p < 0.05. group with EF ≥ 50%,
GLS improved after 1 month, 3 months, 6 months with all p < 0.05