Bsi bs en 61788 6 2011
Bạn đang xem bản rút gọn của tài liệu. Xem và tải ngay bản đầy đủ của tài liệu tại đây (1.29 MB, 36 trang )
BS EN 61788-6:2011
BSI Standards Publication
Superconductivity
Part 6: Mechanical properties measurement
— Room temperature tensile test of
Cu/Nb-Ti composite superconductors
BRITISH STANDARD
BS EN 61788-6:2011
National foreword
This British Standard is the UK implementation of EN 61788-6:2011.
It is identical to IEC 61788-6:2011. It supersedes BS EN 61788-6:2008,
which is withdrawn.
The UK participation in its preparation was entrusted to Technical Committee
L/-/90 Super Conductivity.
A list of organizations represented on this committee can be obtained on
request to its secretary.
This publication does not purport to include all the necessary provisions of a
contract. Users are responsible for its correct application.
© BSI 2011
ISBN 978 0 580 65698 9
ICS 29.050; 77.040.10
Compliance with a British Standard cannot confer immunity
from legal obligations.
This British Standard was published under the authority of the
Standards Policy and Strategy Committee on 30 September 2011.
Amendments issued since publication
Amd. No.
Date
Text affected
BS EN 61788-6:2011
EUROPEAN STANDARD
EN 61788-6
NORME EUROPÉENNE
August 2011
EUROPÄISCHE NORM
ICS 29.050; 77.040.10
Supersedes EN 61788-6:2008
English version
Superconductivity Part 6: Mechanical properties measurement Room temperature tensile test of Cu/Nb-Ti composite superconductors
(IEC 61788-6:2011)
Supraconductivité Partie 6: Mesure des propriétés
mécaniques Essai de traction à température ambiante
des supraconducteurs composites de
Cu/Nb-Ti
(CEI 61788-6:2011)
Supraleitfähigkeit Teil 6: Messung der mechanischen
Eigenschaften Messung der Zugfestigkeit von Cu/Nb-TiVerbundsupraleitern bei Raumtemperatur
(IEC 61788-6:2011)
This European Standard was approved by CENELEC on 2011-08-15. CENELEC members are bound to comply
with the CEN/CENELEC Internal Regulations which stipulate the conditions for giving this European Standard
the status of a national standard without any alteration.
Up-to-date lists and bibliographical references concerning such national standards may be obtained on
application to the Central Secretariat or to any CENELEC member.
This European Standard exists in three official versions (English, French, German). A version in any other
language made by translation under the responsibility of a CENELEC member into its own language and notified
to the Central Secretariat has the same status as the official versions.
CENELEC members are the national electrotechnical committees of Austria, Belgium, Bulgaria, Croatia, Cyprus,
the Czech Republic, Denmark, Estonia, Finland, France, Germany, Greece, Hungary, Iceland, Ireland, Italy,
Latvia, Lithuania, Luxembourg, Malta, the Netherlands, Norway, Poland, Portugal, Romania, Slovakia, Slovenia,
Spain, Sweden, Switzerland and the United Kingdom.
CENELEC
European Committee for Electrotechnical Standardization
Comité Européen de Normalisation Electrotechnique
Europäisches Komitee für Elektrotechnische Normung
Management Centre: Avenue Marnix 17, B - 1000 Brussels
© 2011 CENELEC -
All rights of exploitation in any form and by any means reserved worldwide for CENELEC members.
Ref. No. EN 61788-6:2011 E
BS EN 61788-6:2011
EN 61788-6:2011
Foreword
The text of document 90/267/FDIS, future edition 3 of IEC 61788-6, prepared by IEC TC 90,
Superconductivity was submitted to the IEC-CENELEC parallel vote and approved by CENELEC as
EN 61788-6:2011.
The following dates are fixed:
•
•
latest date by which the document has
to be implemented at national level by
publication of an identical national
standard or by endorsement
latest date by which the national
standards conflicting with the
document have to be withdrawn
(dop)
2012-05-15
(dow)
2014-08-15
This document supersedes EN 61788-6:2008.
EN 61788-6:2011 includes the following significant technical changes with respect to EN 61788-6:2008:
– specific example of uncertainty estimation related to mechanical tests was supplemented as Annex C.
Attention is drawn to the possibility that some of the elements of this document may be the subject of
patent rights. CENELEC [and/or CEN] shall not be held responsible for identifying any or all such patent
rights.
Endorsement notice
The text of the International Standard IEC 61788-6:2011 was approved by CENELEC as a European
Standard without any modification.
In the official version, for Bibliography, the following notes have to be added for the standards indicated:
IEC 61788-5
NOTE Harmonized as EN 61788-5.
ISO 3611:2010
NOTE Harmonized as EN ISO 3611:2010 (not modified).
BS EN 61788-6:2011
EN 61788-6:2011
Annex ZA
(normative)
Normative references to international publications
with their corresponding European publications
The following referenced documents are indispensable for the application of this document. For dated
references, only the edition cited applies. For undated references, the latest edition of the referenced
document (including any amendments) applies.
NOTE When an international publication has been modified by common modifications, indicated by (mod), the relevant EN/HD
applies.
Publication
Year
Title
EN/HD
Year
IEC 60050-815
-
International Electrotechnical Vocabulary Part 815: Superconductivity
-
-
ISO 376
-
EN ISO 376
Metallic materials - Calibration of forceproving instruments used for the verification of
uniaxial testing machines
-
ISO 6892-1
-
Metallic materials - Tensile testing Part 1: Method of test at room temperature
EN ISO 6892-1
-
ISO 7500-1
-
EN ISO 7500-1
Metallic materials - Verification of static
uniaxial testing machines Part 1: Tension/compression testing
machines - Verification and calibration of the
force-measuring system
-
ISO 9513
-
Metallic materials - Calibration of
extensometers used in uniaxial testing
-
EN ISO 9513
BS EN 61788-6:2011
61788-6 IEC:2011
CONTENTS
INTRODUCTION . .................................................................................................................................. 6
1
Scope . ............................................................................................................................................. 7
2
Normative references . .................................................................................................................. 7
3
Terms and definitions . .................................................................................................................. 7
4
Principle .......................................................................................................................................... 8
5
Apparatus . ...................................................................................................................................... 8
6
5.1 Conformity . ........................................................................................................................... 8
5.2 Testing machine . ................................................................................................................. 8
5.3 Extensometer ....................................................................................................................... 9
Specimen preparation. .................................................................................................................. 9
7
6.1 Straightening the specimen . .............................................................................................. 9
6.2 Length of specimen ............................................................................................................. 9
6.3 Removing insulation . .......................................................................................................... 9
6.4 Determination of cross-sectional area (S o ) . .................................................................... 9
Testing conditions . ........................................................................................................................ 9
8
7.1 Specimen gripping ............................................................................................................... 9
7.2 Pre-loading and setting of extensometer . ....................................................................... 9
7.3 Testing speed....................................................................................................................... 9
7.4 Test . .................................................................................................................................... 10
Calculation of results . ................................................................................................................. 12
9
8.1 Tensile strength (R m ) . ...................................................................................................... 12
8.2 0,2 % proof strength (R p0,2A and R p0,2B ) . .................................................................... 12
8.3 Modulus of elasticity (E o and E a ) .................................................................................... 12
Uncertainty . .................................................................................................................................. 12
10 Test report. ................................................................................................................................... 13
10.1
10.2
10.3
Annex A
Specimen . .......................................................................................................................... 13
Results ................................................................................................................................ 13
Test conditions . ................................................................................................................. 13
(informative) Additional information relating to Clauses 1 to 10 . ................................ 14
Annex B (informative) Uncertainty considerations . ...................................................................... 19
Annex C (informative) Specific examples related to mechanical tests . .................................... 23
Bibliography ......................................................................................................................................... 32
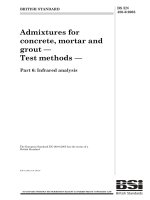
Figure 1 – Stress-strain curve and definition of modulus of elasticity and 0,2 % proof
strengths . ............................................................................................................................................ 11
Figure A.1 – An example of the light extensometer, where R1 and R3 indicate the
corner radius . ..................................................................................................................................... 15
Figure A.2 – An example of the extensometer provided with balance weight and
vertical specimen axis ........................................................................................................................ 16
Figure C.1 – Measured stress versus strain curve of the rectangular cross section NbTi
wire and the initial part of the curve . ............................................................................................... 23
Figure C.2 – 0,2 % offset shifted regression line, the raw stress versus strain curve
and the original raw data of stress versus strain ........................................................................... 29
BS EN 61788-6:2011
61788-6 IEC:2011
Table B.1 – Output signals from two nominally identical extensometers . .................................. 20
Table B.2 – Mean values of two output signals . ............................................................................ 20
Table B.3 – Experimental standard deviations of two output signals. ......................................... 20
Table B.4 – Standard uncertainties of two output signals . ........................................................... 21
Table B.5 – Coefficient of variations of two output signals. .......................................................... 21
Table C.1 – Load cell specifications according to manufacturer’s data sheet . ......................... 26
Table C.2 – Uncertainties of displacement measurement . ........................................................... 26
Table C.3 – Uncertainties of wire width measurement .................................................................. 27
Table C.4 – Uncertainties of wire thickness measurement . ......................................................... 27
Table C.5 – Uncertainties of gauge length measurement . ........................................................... 27
Table C.6 – Calculation of stress at 0 % and at 0,1 % strain using the zero offset
regression line as determined in Figure C.1b). . ............................................................................. 28
Table C.7 – Linear regression equations computed for the three shifted lines and for
the stress versus strain curve in the region where the lines intersect ........................................ 29
Table C.8 – Calculation of strain and stress at the intersections of the three shifted
lines with the stress strain curve ...................................................................................................... 30
Table C.9 – Measured stress versus strain data and the computed stress based on a
linear fit to the data in the region of interest ................................................................................... 31
–6–
BS EN 61788-6:2011
61788-6 IEC:2011
INTRODUCTION
The Cu/Nb-Ti superconductive composite wires currently in use are multifilamentary
composite material with a matrix that functions as a stabilizer and supporter, in which ultrafine
superconductor filaments are embedded. A Nb-40~55 mass % Ti alloy is used as the
superconductive material, while oxygen-free copper and aluminium of high purity are
employed as the matrix material. Commercial composite superconductors have a high current
density and a small cross-sectional area. The major application of the composite
superconductors is to build superconducting magnets. While the magnet is being
manufactured, complicated stresses are applied to its windings and, while it is being
energized, a large electromagnetic force is applied to the superconducting wires because of
its high current density. It is therefore indispensable to determine the mechanical properties of
the superconductive wires, of which the windings are made.
BS EN 61788-6:2011
61788-6 IEC:2011
–7–
SUPERCONDUCTIVITY –
Part 6: Mechanical properties measurement –
Room temperature tensile test of Cu/Nb-Ti
composite superconductors
1
Scope
This part of IEC 61788 covers a test method detailing the tensile test procedures to be carried
out on Cu/Nb-Ti superconductive composite wires at room temperature.
This test is used to measure modulus of elasticity, 0,2 % proof strength of the composite due
to yielding of the copper component, and tensile strength.
The value for percentage elongation after fracture and the second type of 0,2 % proof
strength due to yielding of the Nb-Ti component serves only as a reference (see Clauses A.1
and A.2).
The sample covered by this test procedure has a round or rectangular cross-section with an
area of 0,15 mm 2 to 2 mm 2 and a copper to superconductor volume ratio of 1,0 to 8,0 and
without the insulating coating.
2
Normative references
The following referenced documents are indispensable for the application of this document.
For dated references, only the edition cited applies. For undated references, the latest edition
of the referenced document (including any amendments) applies.
IEC 60050-815, International Electrotechnical Vocabulary – Part 815: Superconductivity
ISO 376, Metallic materials – Calibration of force-proving instruments used for the verification
of uniaxial testing machines
ISO 6892-1, Metallic materials – Tensile testing – Part 1: Method of test at room temperature
ISO 7500-1, Metallic materials – Verification of static uniaxial testing machines – Part 1:
Tension/compression testing machines – Verification and calibration of the force-measuring
system
ISO 9513, Metallic materials – Calibration of extensometers used in uniaxial testing
3
Terms and definitions
For the purposes of this document, the definitions given in IEC 60050-815 and ISO 6892-1, as
well as the following, apply.
3.1
tensile stress
tensile force divided by the original cross-sectional area at any moment during the test
–8–
BS EN 61788-6:2011
61788-6 IEC:2011
3.2
tensile strength
Rm
tensile stress corresponding to the maximum testing force
NOTE
The symbol σ UTS is commonly used instead of R m .
3.3
extensometer gauge length
length of the parallel portion of the test piece used for the measurement of elongation by
means of an extensometer
3.4
distance between grips
Lg
length between grips that hold a test specimen in position before the test is started
3.5
0,2 % proof strength
R p0,2 (see Figure 1)
stress value where the copper component yields by 0,2 %
NOTE 1 The designated stress, R p0,2A or R p0,2B corresponds to point A or B in Figure 1, respectively. This
strength is regarded as a representative 0,2 % proof strength of the composite. The second type of 0,2 % proof
strength is defined as a 0,2 % proof strength of the composite where the Nb-Ti component yields by 0,2 %, the
value of which corresponds to the point C in Figure 1 as described complementarily in Annex A (see Clause A.2).
NOTE 2
The symbol σ 0,2 is commonly used instead of R p0,2 .
3.6
modulus of elasticity
E
gradient of the straight portion of the stress-strain curve in the elastic deformation region
4
Principle
The test consists of straining a test piece by tensile force, generally to fracture, for the
purpose of determining the mechanical properties defined in Clause 3.
5
5.1
Apparatus
Conformity
The test machine and the extensometer shall conform to ISO 7500-1 and ISO 9513,
respectively. The calibration shall obey ISO 376. The special requirements of this standard
are presented here.
5.2
Testing machine
A tensile machine control system that provides a constant cross-head speed shall be used.
Grips shall have a structure and strength appropriate for the test specimen and shall be
constructed to provide an effective connection with the tensile machine. The faces of the grips
shall be filed or knurled, or otherwise roughened, so that the test specimen will not slip on
them during testing. Gripping may be a screw type, or pneumatically or hydraulically actuated.
BS EN 61788-6:2011
61788-6 IEC:2011
5.3
–9–
Extensometer
The weight of the extensometer shall be 30 g or less, so as not to affect the mechanical
properties of the superconductive wire. Care shall also be taken to prevent bending moments
from being applied to the test specimen (see Clause A.3).
6
6.1
Specimen preparation
Straightening the specimen
When a test specimen sampled from a bobbin needs to be straightened, a method shall be
used that affects the material as little as possible.
6.2
Length of specimen
The total length of the test specimen shall be the inward distance between grips plus both grip
lengths. The inward distance between the grips shall be 60 mm or more, as requested for the
installation of the extensometer.
6.3
Removing insulation
If the test specimen surface is coated with an insulating material, that coating shall be
removed. Either a chemical or mechanical method shall be used, with care taken not to
damage the specimen surface (see Clause A.4).
6.4
Determination of cross-sectional area (S o )
A micrometer or other dimension-measuring apparatus shall be used to obtain the crosssectional area of the specimen after the insulation coating has been removed. The crosssectional area of a round wire shall be calculated using the arithmetic mean of the two
orthogonal diameters. The cross-sectional area of a rectangular wire shall be obtained from
the product of its thickness and width. Corrections to be made for the corners of the crosssectional area shall be determined through consultation among the parties concerned (see
Clause A.5).
7
7.1
Testing conditions
Specimen gripping
The test specimen shall be mounted on the grips of the tensile machine. At this time, the test
specimen and tensile loading axis must be on a single straight line. Sand paper may be
inserted as a cushioning material to prevent the gripped surfaces of the specimen from
slipping and fracturing (see Clause A.6).
7.2
Pre-loading and setting of extensometer
If there is any slack in the specimen when it is mounted, a force not greater than one-tenth of
the 0,2 % proof strength of the composite shall be applied to take up the slack before the
extensometer is mounted. When mounting the extensometer, care shall be taken to prevent
the test specimen from being deformed. The extensometer shall be mounted at the centre
between the grips, aligning the measurement direction with the specimen axis direction. After
installation, loading shall be zeroed.
7.3
Testing speed
The strain rate shall be 10 –4 /s to 10 –3 /s during the test using the extensometer. After
removing the extensometer, the strain rate may be increased to a maximum of 10 –3 /s.
– 10 –
7.4
BS EN 61788-6:2011
61788-6 IEC:2011
Test
The tensile machine shall be started after the cross-head speed has been set to the specified
level. The signals from the extensometer and load cell shall be plotted on the abscissa and
ordinate, respectively, as shown in Figure 1. When the total strain has reached approximately
2 %, reduce the force by approximately 10 % and then remove the extensometer. The step of
removing the extensometer can be omitted in the case where the extensometer is robust
enough not to be damaged by the total strain and the fracture shock of this test. At this time,
care shall be taken to prevent unnecessary force from being applied to the test specimen.
Then, increase loading again to the previous level and continue testing until the test specimen
fractures. Measurement shall be made again if a slip or fracture occurs on the gripped
surfaces of the test specimen.
61788-6 IEC:2011
– 11 –
700
5
1
4
600
E
2
C
6
Stress (MPa)
500
400
300
B
3
A
200
100
D
0
0
0,2
εa
0,5
1,0
1,5
Strain (%)
2,0
IEC 1597/11
Key
Initial loading line
Line shifted by an offset of 0,2% parallel to the initial loading line
Unloading line
Line shifted by an offset of 0,2% parallel to the unloading line
Second linear part of loading line
Line shifted by an offset of 0,2% parallel to the second linear loading line
NOTE 1 When the total strain has reached ~2 % (point E), the load is reduced by 10 % and the extensometer is
removed, if necessary. Then, the load is increased again.
NOTE 2 The slope of the initial loading line is usually smaller than that of the unloading line. Then, two lines can
be drawn from the 0,2 % offset point on the abscissa to obtain 0,2 % proof strength of the composite due to
yielding of the copper component. Point A is obtained from the initial loading line, and Point B is obtained from the
unloading line. Point C is the second type of 0,2 % proof strength of the composite where the Nb-Ti component
yields.
Figure 1 – Stress-strain curve and definition
of modulus of elasticity and 0,2 % proof strengths
– 12 –
8
BS EN 61788-6:2011
61788-6 IEC:2011
Calculation of results
8.1
Tensile strength (R m )
Tensile strength R m shall be the maximum force divided by the original cross-sectional area of
the wire before loading.
0,2 % proof strength (R p0,2A and R p0,2B )
8.2
The 0,2 % proof strength of the composite due to yielding of the copper component is
determined in two ways from the loading and unloading stress-strain curves as shown in
Figure 1. The 0,2 % proof strength under loading R p0,2A shall be determined as follows: the
initial linear portion under loading of the stress-strain curve is moved 0,2 % in the strain axis
(0,2 % offset line under loading) and the point A at which this linear line intersects the stressstrain curve shall be defined as the 0,2 % proof strength under loading. The 0,2 % proof
strength of the composite under unloading R p0,2B shall be determined as follows: the linear
portion under unloading is to be moved parallel to the 0,2 % offset strain point. The
intersection of this line with the stress-strain curve determines the point B that shall be
defined as the 0,2 % proof strength. This measurement shall be discarded if the 0,2 % proof
strength of the composite is less than three times the pre-load specified in 7.2.
Each 0,2 % proof strength shall be calculated using formula (1) given below:
R p0,2i = F i / S o
(1)
where
R p0,2i is the 0,2 % proof strength (MPa) at each point;
Fi
is the force (N) at each point;
So
is the original cross-sectional area (in square millimetres) of the test specimen;
Further, i = A and B.
Modulus of elasticity (E o and E a )
8.3
Modulus of elasticity shall be calculated using the following formula and the straight portion,
either of the initial loading curve or of the unloading one.
E = ∆F (1 + ε a )/(S o ∆ ε )
(2)
where
E
∆F
is the modulus of elasticity (MPa);
is the increments (N) of the corresponding force;
∆ε
is the increment of strain corresponding to ∆F;
εa
is the strain just after unloading as shown in Figure 1.
E is designated as E o when using the initial loading curve ( ε a = 0), and as E a when using the
unloading curve ( ε a ≠ 0).
9
Uncertainty
Unless otherwise specified, measurements shall be carried in a temperature range between
280 K and 310 K. A force measuring cell with a combined standard uncertainty not greater
than 0,5 % shall be used. An extensometer with a combined standard uncertainty not greater
than 0,5 % shall be used. The dimension-measuring apparatus shall have a combined
standard uncertainty not greater than 0,1 %. The target combined standard uncertainties are
defined by root square sum (RSS) procedure, which is given in Annex B.
BS EN 61788-6:2011
61788-6 IEC:2011
– 13 –
There are no reliable experimental data with respect to uncertainties on moduli of elasticity
and 0,2 % proof strengths as mentioned in Clause A.7. As described in Annex C, on the other
hand, their uncertainties could be evaluated from the experimental conditions, of which parts
are indicated above like uncertainty of force measuring cell. Consequently the relative
expanded uncertainties (k=2) for the modulus of elasticity, E o , and the 0,2 % proof strength,
R p0,2A , are expected to be 2,0 % (N=1) and 0,78 % (N=1), respectively, where N indicates
the time of repeated tests.
NOTE Uncertainties reported in the present text, if used for the purpose of practical assessment, have to be taken
under the specific considerations with detailed caution as indicated in Annex B.
10 Test report
10.1
Specimen
a) Name of the manufacturer of the specimen
b) Classification and/or symbol
c) Lot number
The following information shall be reported as necessary.
d) Raw materials and their chemical composition
e) Cross-sectional shape and dimension of the wire
f)
Filament diameter
g) Number of filaments
h) Twist pitch of filaments
i)
Copper to superconductor ratio
10.2
Results
a) Tensile strength (R m )
b) 0,2 % proof strengths (R p0,2A and R p0,2B )
c) Modulus of elasticity (E o and E a with ε a )
The following information shall be reported as necessary.
d) Second type of 0,2 % proof strength (R p0,2C )
e) Percentage elongation after fracture (A)
10.3
Test conditions
a) Cross-head speed
b) Distance between grips
c) Temperature
The following information shall be reported as necessary.
d) Manufacturer and model of testing machine
e) Manufacturer and model of extensometer
f)
Gripping method
– 14 –
BS EN 61788-6:2011
61788-6 IEC:2011
Annex A
(informative)
Additional information relating to Clauses 1 to 10
A.1
General
This annex gives reference information on the variable factors that can seriously affect the
tensile test methods, together with some precautions to be observed when using the standard.
A.2
Percentage elongation after fracture (A)
In Cu/NbTi superconductive wires there is a difference in strength between the copper and
NbTi, and the wire is often deformed in waves by the shock of fracture. In such a case, it is
difficult to find the elongation accurately after fracture using the butt method. Hence, the
measurement of elongation after fracture should serve only as a reference. The movement of
the cross-head may be used to find the approximate value for elongation after fracture,
instead of using the butt method, as shown below. To use this method, the cross-head
position at fracture must be recorded. Use the following formula to obtain the elongation after
fracture, given in percentage.
A = 100 (L u − L c ) / L c
(A.1)
where
A
is the percentage elongation after fracture;
L c is the initial distance between cross-heads;
L u is the distance between cross-heads after fracture.
A.3
Second type of 0,2 % proof strength (Rp0,2C )
The second type of 0,2 % proof strength, at which the Nb-Ti component yields, is defined
reasonably on the basis of the rule-of-mixture for the bimetallic composite including
continuous filaments. As indicated in Figure 1, it should be the stress R p0,2C corresponding to
point C, at which the straight portion of the loading curve after the point A is moved by 0,2 %
along the strain axis intersects the stress-strain curve. The relevant straight portion is usually
observed for the commercial Cu/Nb-Ti superconductive wires, because the copper component
deforms plastically in a linear behaviour. Often the stress-strain curve does not show any
straight line, but is rounded off for some wires, when they have high copper/non-copper ratio
and are highly cold worked. It has been empirically made clear that the rounded-off
appearance is observed when the following k-factor is less than 0,4:
k = (R m − R p0,2A ) /R p0,2A
(A.2)
The R p0,2C is one of the important parameters describing the mechanical property of the
composite material in the scientific viewpoint, but its use is not always demanded in the
engineering sense.
A.4
Extensometer
When using a special type of extensometer, which is attached with an unremovable spacer for
determining the gauge length, it may introduce a problem during the unloading of the wire to
zero force. To avoid a compressive force on the spacer, the actual gauge length must be
BS EN 61788-6:2011
61788-6 IEC:2011
– 15 –
adjusted during installation with sufficient clearance. If the clearance after unloading is not
negligible, it must be included in calculating the strain values.
If the test specimen is thin and the extensometer is relatively heavy, any bending moment
caused by the weight of the extensometer can stress the specimen, eventually resulting in the
specimen yielding. To avoid this, a light extensometer with a balance weight is to be carefully
attached. Alternatively, a sufficiently light extensometer without a balance weight is also
acceptable to use. Figure A.1 shows an extensometer made with a Ti alloy, with a total mass
of about 3 g. It is so light that even a single use without a balance weight could provide
enough uncertainty according to the procedure of the present standard. Figure A.2 shows one
of the lightest extensometers commercially available, with a total mass of 31 g together with a
balance weight. Using it, a round robin test (RRT) was conducted in Japan and good results
were obtained. The results were used to establish the present international standard.
Dimensions in millimetres
26
R1
3,5
26,7
3,3
0,3
27
1
30
∅2,2
5
R3
7
Figure A.1 – An example of the light extensometer,
where R1 and R3 indicate the corner radius
IEC 2365/07
BS EN 61788-6:2011
61788-6 IEC:2011
– 16 –
Dimensions in millimetres
13
a) Top view
Bar spring
b) Side view
Specimen
Balance weight
Stopper
Strain gauge
G.L. 25
37
Frame
22
35
Cross spring plate
Frame
Gauge length setting hole
IEC 1598/11
Figure A.2 – An example of the extensometer provided with balance weight
and vertical specimen axis
NOTE Further information about extensometers is obtainable from the Japanese National Committee of
IEC/TC90, ISTEC, 10-13, Shinonome 1-chome Koto-ku, Tokyo 135-0062, Japan, Tel 81-3-3536-7214,
Fax 81-3-3536-7318, e-mail Koki TSUNODA <>
Since the superconductive composite wire is covered with a soft copper, a scratch in the
surface of the specimen made as it is mounted can be a starting point of fracture. Care should
therefore be taken when handling the specimen.
A.5
Insulating coating
The coating on the surface of the test specimen should be removed using an appropriate
organic solvent that would not damage the specimen. If the coating material is not dissolved
by the organic solvent, a mechanical method should be used with care to prevent the copper
from being damaged. If the coating is not removed, it affects the strength to only a small
extent. For example, tensile strength decreases by less than 3 % for a low-strength wire
which has a high copper ratio of 7. The coating is not designed as a structural component. An
BS EN 61788-6:2011
61788-6 IEC:2011
– 17 –
analysis of measurement as a three-component composite, i.e. copper, Nb-Ti and insulating
coating, is too complicated to conduct. Therefore this test method covers a bare wire in order
to maintain the level of uncertainty.
A.6
Cross-sectional area
Where even lower uncertainty is required, the cross-sectional area may be obtained by
correcting the radius of the corner of the rectangular wire finished by dies, using the value
given on the manufacturing specifications. For rolling or Turk's-head finish, the radius of the
corner is not controlled and a correction is made using a microphotograph of the cross-section.
A.7
Gripping force
A weak gripping force results in slippage and a strong gripping force can break the gripped
surface. Care should therefore be used when adjusting the gripping force.
A.8
Uncertainty
The Japanese National Committee of IEC TC90 fulfilled the domestic RRT in 1996 by
contributions of eight research groups [1] in order to evaluate only the coefficient of variation
of experimental data on moduli of elasticity and 0,2 % proof strengths [2], but not their
uncertainties. It is, however, not possible to deduce their uncertainties at the present time,
because their original data have been insufficient to evaluate uncertainties. Only the way to
know the uncertainty is to evaluate it by using the numerical computation based on type B
statistics as the procedure is given in Annex C and its results are described in Clause 9 of the
main text.
Empirical facts with respect to the scattering source of measured values are described in the
following. The modulus of elasticity E o determined under the loading curve was found to be
always smaller than the modulus E a under unloading. The reason is attributed to the following
handling issues: the bending of the wire specimen, the misalignment of sample gripping with
respect to the load axis and a weak grip, and so on. Also, it is pointed out that the copper
component is in a plastic state at room temperature before the test, depending on a degree of
thermal contraction during cooling from the heat treating temperature. As a whole, the initial
loading curve with non-linearity causes the result of E o < E a .
The German National Committee of IEC TC90 reported that the modulus of elasticity can be
determined with small uncertainty when adopting an initial linear loading at zero-offset. This
low uncertainty was achieved by using two light extensometers (Figure A.1) which enabled
the cancelling of the possible initial bending effects and ensured a high degree of linearity for
the zero-offset loading line.
Care must be taken while handling specimens in order not to induce strain to the copper
component. Otherwise, the 0,2 % proof strength of the composite due to yielding of the copper
component would increase due to work hardening. Allowable pre-loading limit should be taken
into consideration in this fact.
The second type of 0,2 % proof strength R p0,2C is the quantity determined with the lowest
uncertainty, that should serve only as reference. Care must, however, be taken to ensure an
existence of a straight portion in the stress-strain curve after the point A in Figure 1
– 18 –
A.9
BS EN 61788-6:2011
61788-6 IEC:2011
Reference documents of Annex A
[1] SHIMADA, M., HOJO, M., MORIAI, H. and OSAMURA. K. Jpn. Cryogenic Eng, 1998, 33,
p. 665.
[2] OSAMURA, K., NYILAS, A., SHIMADA, M., MORIAI, H., HOJO, M., FUSE T. and
SUGANO, M. Adv. Superconductivity, 1999, XI, p.1515.
BS EN 61788-6:2011
61788-6 IEC:2011
– 19 –
Annex B
(informative)
Uncertainty considerations
B.1
Overview
In 1995, a number of international standards organizations, including IEC, decided to unify the
use of statistical terms in their standards. It was decided to use the word “uncertainty” for all
quantitative (associated with a number) statistical expressions and eliminate the quantitative
use of “precision” and “accuracy.” The words “accuracy” and “precision” could still be used
qualitatively. The terminology and methods of uncertainty evaluation are standardized in the
Guide to the Expression of Uncertainty in Measurement (GUM) [1] 1.
It was left to each TC to decide if they were going to change existing and future standards to
be consistent with the new unified approach. Such change is not easy and creates additional
confusion, especially for those who are not familiar with statistics and the term uncertainty. At
the June 2006 TC 90 meeting in Kyoto, it was decided to implement these changes in future
standards.
Converting “accuracy” and “precision” numbers to the equivalent “uncertainty” numbers
requires knowledge about the origins of the numbers. The coverage factor of the original
number may have been 1, 2, 3, or some other number. A manufacturer’s specification that can
sometimes be described by a rectangular distribution will lead to a conversion number of
1 / 3 . The appropriate coverage factor was used when converting the original number to the
equivalent standard uncertainty. The conversion process is not something that the user of the
standard needs to address for compliance to TC 90 standards, it is only explained here to
inform the user about how the numbers were changed in this process. The process of
converting to uncertainty terminology does not alter the user’s need to evaluate their
measurement uncertainty to determine if the criteria of the standard are met.
The procedures outlined in TC 90 measurement standards were designed to limit the
uncertainty of any quantity that could influence the measurement, based on the Convener’s
engineering judgment and propagation of error analysis. Where possible, the standards have
simple limits for the influence of some quantities so that the user is not required to evaluate
the uncertainty of such quantities. The overall uncertainty of a standard was then confirmed
by an interlaboratory comparison.
B.2
Definitions
Statistical definitions can be found in three sources: the GUM, the International Vocabulary of
Basic and General Terms in Metrology (VIM)[2], and the NIST Guidelines for Evaluating and
Expressing the Uncertainty of NIST Measurement Results (NIST)[3]. Not all statistical terms
used in this standard are explicitly defined in the GUM. For example, the terms “relative
standard uncertainty” and “relative combined standard uncertainty” are used in the GUM
(5.1.6, Annex J), but they are not formally defined in the GUM (see [3]).
B.3
Consideration of the uncertainty concept
Statistical evaluations in the past frequently used the coefficient of variation (COV) which is
the ratio of the standard deviation and the mean (N.B. the COV is often called the relative
standard deviation). Such evaluations have been used to assess the precision of the
—————————
1 Figures in square brackets refer to the reference documents in Clause B.5 of this Annex.
BS EN 61788-6:2011
61788-6 IEC:2011
– 20 –
measurements and give the closeness of repeated tests. The standard uncertainty (SU)
depends more on the number of repeated tests and less on the mean than the COV and
therefore in some cases gives a more realistic picture of the data scatter and test judgment.
The example below (see Tables B.1 to B.6) shows a set of electronic drift and creep voltage
measurements from two nominally identical extensometers using same signal conditioner and
data acquisition system. The n = 10 data pairs are taken randomly from the spreadsheet of
32 000 cells.
Here, extensometer number one (E 1 ) is at zero offset position whilst
extensometer number two (E 2 ) is deflected to 1 mm. The output signals are in volts.
Table B.1 – Output signals from two nominally identical extensometers
Output signal
[V]
E1
E2
0,001 220 70
2,334 594 73
0,000 610 35
2,334 289 55
0,001 525 88
2,334 289 55
0,001 220 70
2,334 594 73
0,001 525 88
2,334 594 73
0,001 220 70
2,333 984 38
0,001 525 88
2,334 289 55
0,000 915 53
2,334 289 55
0,000 915 53
2,334 594 73
0,001 220 70
2,334 594 73
Table B.2 – Mean values of two output signals
Mean (
X)
[V]
E1
E2
0,001 190 19
2,334 411 62
n
X =
∑ Xi
[V ]
i =1
n
(B.1)
Table B.3 – Experimental standard deviations of two output signals
Experimental standard deviation (s)
[V]
E1
E2
0,000 303 48
0,000 213 381
s=
(
n
1
⋅ ∑ Xi − X
n − 1 i =1
)
2
[V ]
(B.2)
BS EN 61788-6:2011
61788-6 IEC:2011
– 21 –
Table B.4 – Standard uncertainties of two output signals
Standard uncertainty (u) [V]
E1
E2
0,000 095 97
0,000 067 48
u=
s
n
[V ]
(B.3)
Table B.5 – Coefficient of Variations of two output signals
Coefficient of variation (COV) [%]
E1
E2
25,498 2
0,009 1
COV =
s
X
(B.4)
The standard uncertainty is very similar for the two extensometer deflections. In contrast the
coefficient of variation COV is nearly a factor of 2 800 different between the two data sets.
This shows the advantage of using the standard uncertainty which is independent of the mean
value.
B.4
Uncertainty evaluation example for TC 90 standards
The observed value of a measurement does not usually coincide with the true value of the
measurand. The observed value may be considered as an estimate of the true value. The
uncertainty is part of the "measurement error" which is an intrinsic part of any measurement.
The magnitude of the uncertainty is both a measure of the metrological quality of the
measurements and improves the knowledge about the measurement procedure. The result of
any physical measurement consists of two parts: an estimate of the true value of the
measurand and the uncertainty of this “best” estimate. The GUM, within this context, is a
guide for a transparent, standardized documentation of the measurement procedure. One can
attempt to measure the true value by measuring “the best estimate” and using uncertainty
evaluations which can be considered as two types: Type A uncertainties (repeated
measurements in the laboratory in general expressed in the form of Gaussian distributions)
and Type B uncertainties (previous experiments, literature data, manufacturer’s information,
etc. often provided in the form of rectangular distributions).
The calculation of uncertainty using the GUM procedure is illustrated in the following example:
a) The user must derive in a first step a mathematical measurement model in form of
identified measurand as a function of all input quantities. A simple example of such a
model is given for the uncertainty of a force measurement using a load cell:
Force as measurand = W (weight of standard as expected) + d W (manufacturer’s data) +
d R (repeated checks of standard weight/day) + d Re (reproducibility of checks at different
days).
Here the input quantities are: the measured weight of standard weights using different
balances (Type A), manufacturer’s data (Type B), repeated test results using the digital
electronic system (Type B), and reproducibility of the final values measured on different
days (Type B).
b) The user should identify the type of distribution for each input quantity (e.g. Gaussian
distributions for Type A measurements and rectangular distributions for Type B
measurements).
– 22 –
BS EN 61788-6:2011
61788-6 IEC:2011
c) Evaluate the standard uncertainty of the Type A measurements,
uA =
s
where, s is the experimental standard deviation and n is the total number of
n
measured data points.
d) Evaluate the standard uncertainties of the Type B measurements:
uB =
1
2
⋅ dW + ....... where, d W is the range of rectangular distributed values
3
e) Calculate the combined standard uncertainty for the measurand by combining all the
standard uncertainties using the expression:
u c = u A2 + uB2
In this case, it has been assumed that there is no correlation between input quantities. If
the model equation has terms with products or quotients, the combined standard
uncertainty is evaluated using partial derivatives and the relationship becomes more
complex due to the sensitivity coefficients [4, 5].
f)
Optional – the combined standard uncertainty of the estimate of the referred measurand
can be multiplied by
a coverage factor (e. g. 1 for 68 % or 2 for 95 % or 3 for 99 %) to
increase the probability that the measurand can be expected to lie within the interval.
g) Report the result as the estimate of the measurand ± the expanded uncertainty, together
with the unit of measurement, and, at a minimum, state the coverage factor used to
compute the expanded uncertainty and the estimated coverage probability.
To facilitate the computation and standardize the procedure, use of appropriate certified
commercial software is a straightforward method that reduces the amount of routine work [6,
7]. In particular, the indicated partial derivatives can be easily obtained when such a software
tool is used. Further references for the guidelines of measurement uncertainties are given in
[3, 8, and 9].
B.5
Reference documents of Annex B
[1]
ISO/IEC Guide 98-3:2008, Uncertainty of measurement – Part 3: Guide to the
expression of uncertainty in measurement (GUM 1995)
[2]
ISO/IEC Guide 99:2007, International vocabulary of metrology – Basic and general
concepts and associated terms (VIM)
[3]
TAYLOR, B.N. and KUYATT, C.E. Guidelines for Evaluating and Expressing the
Uncertainty of NIST Measurement Results. NIST Technical Note 1297, 1994
[4]
KRAGTEN, J. Calculating standard deviations and confidence intervals with a
universally applicable spreadsheet technique. Analyst, 1994, 119, 2161-2166
[5]
EURACHEM / CITAC Guide CG 4 Second edition:2000, Quantifying Uncertainty in
Analytical Measurement
[6]
Available at (cited 2011-04-04)
[7]
Available at < (cited 2011.04-04)
[8]
CHURCHILL, E., HARRY, H.K., and COLLE,R. Expression of the Uncertainties of Final
Measurement Results. NBS Special Publication 644 (1983)
[9]
JAB NOTE Edition 1:2003, Estimation of Measurement Uncertainty (Electrical Testing /
High Power Testing).
BS EN 61788-6:2011
61788-6 IEC:2011
– 23 –
Annex C
(informative)
Specific examples related to mechanical tests
These are specific examples to illustrate techniques of uncertainty estimation. The inclusion
of these examples does not imply that users must complete a similar analysis to comply with
the standard. However, the portions that estimate the uncertainty of each individual influence
quantity (load, displacement, wire diameter and gauge length) need to be evaluated by the
user to determine if they meet the specified uncertainty limits in the standard.
These two examples are not meant to be exhaustive. They do not include all possible sources
of error, such as friction, bent/straightened wire, and removal of insulation, misaligned grips,
and strain rate. These additional sources may or may not be negligible.
C.1
Uncertainty of the modulus of elasticity
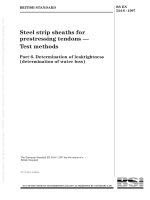
In Figure C1, the original stress versus strain raw data of a NbTi rectangular wire
(1,45 mm × 0,97 mm) is given. These measurements were carried out during the course of an
international round robin test in 1999. Figure C.1 (a) shows the loading of the wire up to
unloading at around 2 % strain, while Figure C.1 (b) displays points taken during the initial
loading up to 50 MPa and the line fit to these data. The computed slope of the trend line is
101 531 MPa (the slope is expand with a factor of 100 due to unit percentage of abscissa) as
given in Figure C.1 (b) with a squared correlation coefficient of 0,99901.
60
400
Stress (MPa)
Stress (MPa)
500
300
200
40
20
y = 1 015,306 20x - 0,352 48
100
2
R = 0,999 01
0
0
0,0
0,5
1,0
1,5
Strain (%)
2,0
2,5
IEC 1599/11
0,000
0,020
0,040
Strain (%)
0,060
IEC 1600/11
b)
a)
Figure C.1 a) shows the measured stress versus strain curve of the rectangular cross section NbTi
superconducting wire. Figure C.1 b) shows the initial part of the curve and the regression analysis to determine
modulus of elasticity. The slope of the line should be multiplied by 100 to convert the percentage strain to strain,
so that the units of modulus of elasticity will be MPa.
Figure C.1 – Measured stress versus strain curve of the rectangular
cross section NbTi wire and the initial part of the curve
The standard uncertainty estimation of modulus of elasticity for this wire can be processed in
following way. The determined modulus of elasticity during mechanical loading is a function of
six variables
E = f (P, ∆L,W ,T , LG , b ) ,
(C.1)