Astm f 1394 92 (2012)
Bạn đang xem bản rút gọn của tài liệu. Xem và tải ngay bản đầy đủ của tài liệu tại đây (1.16 MB, 27 trang )
Designation: F1394 − 92 (Reapproved 2012)
Standard Test Method for
Determination of Particle Contribution from Gas Distribution
System Valves1
This standard is issued under the fixed designation F1394; the number immediately following the designation indicates the year of
original adoption or, in the case of revision, the year of last revision. A number in parentheses indicates the year of last reapproval. A
superscript epsilon (´) indicates an editorial change since the last revision or reapproval.
INTRODUCTION
Semiconductor clean rooms are serviced by high-purity gas distribution systems. This test method
presents a procedure that may be applied for the evaluation of one or more components considered for
use in such systems.
condensation nucleus particle counter and does not consider
classifying data into various size ranges.
1.3.1.1 It is questionable whether significant data can be
generated from nondynamic components (such as fittings and
short lengths of tubing) to compare, with statistical
significance, to the data generated from the spool piece. For
this reason, this test method cannot reliably support comparisons between these types of components.
1.3.1.2 If detection or classification of particles, or both, in
the size range of laser particle counter (LPC) technology is of
interest, an LPC can be utilized for testing components. Flow
rates, test times, sampling apparatus, and data analysis outlined
in this test method do not apply for use with an LPC. Because
of these variations, data from CNCs are not comparable to data
from LPCs.
1.3.2 This test method specifies flow and mechanical stress
conditions in excess of those considered typical. These conditions should not exceed those recommended by the manufacturer. Actual performance under normal operating conditions
may vary.
1.3.3 The test method is limited to nitrogen or clean dry air.
Performance with other gases may vary.
1.3.4 This test method is intended for use by operators who
understand the use of the apparatus at a level equivalent to six
months of experience.
1.3.5 The appropriate particle counter manufacturer’s operating and maintenance manuals should be consulted when
using this test method.
1. Scope
1.1 This test method covers gas distribution system components intended for installation into a high-purity gas distribution system.
1.1.1 This test method describes a procedure designed to
draw statistically significant comparisons of particulate generation performance of valves tested under aggressive conditions.
1.1.2 This test method is not intended as a methodology for
monitoring on-going particle performance once a particular
valve has been tested.
1.2 This test method utilizes a condensation nucleus counter
(CNC) applied to in-line gas valves typically used in semiconductor applications. It applies to automatic and manual valves
of various types (such as diaphragms or bellows), 6.3 through
12.7-mm (1⁄4 through 1⁄2-in.) size. For applications of this test
method to larger valves, see the table in the appendix.
1.2.1 Valves larger than 12.7 mm (1⁄2 in.) can be tested by
this methodology. The test stand must be sized accordingly.
Components larger than 12.7 mm (1⁄2 in.) should be tested
while maintaining a Reynolds number of 20 000 to 21 000.
This is the Reynolds number for 12.7-mm (1⁄2-in.) components
tested at a velocity of 30.5 m/s (100 ft/s).
1.3 Limitations:
1.3.1 This test method is applicable to total particle count
greater than the minimum detection limit (MDL) of the
1.4 The values stated in SI units are to be regarded as the
standard. The inch-pound units given in parentheses are for
information only.
1
This test method is under the jurisdiction of ASTM Committee F01 on
Electronics and is the direct responsibility of Subcommittee F01.10 on Contamination Control.
Current edition approved July 1, 2012. Published August 2012. Originally
approved in 1992. Last previous edition approved in 2005 as F1394–92(2005). DOI:
10.1520/F1394-92R12.
1.5 This standard does not purport to address all of the
safety concerns, if any, associated with its use. It is the
Copyright © ASTM International, 100 Barr Harbor Drive, PO Box C700, West Conshohocken, PA 19428-2959. United States
1
F1394 − 92 (2012)
3.1.12 test flow rate—volumetric flow at test pressure and
temperature.
3.1.13 test pressure—pressure immediately downstream of
the test component.
3.1.14 test velocity—the average velocity of the test gas in
the outlet tube of the test valve (volumetric flow at ambient
pressure and temperature divided by the internal crosssectional area of the valve outlet). In this test method, the test
velocity is specified to maintain a Reynolds number of 20 000
to 21 000 (see the table in the appendix).
responsibility of the user of this standard to establish appropriate safety and health practices and determine the applicability of regulatory limitations prior to use. Specific hazard
statements are given in Section 6, Hazards.
2. Referenced Documents
2.1 Federal Standard:
FED-STD-209D Federal Standard Clean Room and Work
Station Requirements, Controlled Environment2
3. Terminology
3.2 Abbreviations:
3.2.1 LPC—laser particle counter.
3.1 Definitions of Terms Specific to This Standard:
3.1.1 background counts—counts contributed by the test
apparatus (including counter electrical noise) with the spool
piece in place of the test object.
3.1.2 condensation nucleus counter (CNC)—light scattering
instrument that detects particles in a gaseous stream by
condensing supersaturated vapor upon the particles.
3.1.3 control product—sample component that gives
consistent, stabilized counts at or below the expected counts
from the test components. The product is run periodically in
accordance with the test protocol to ensure that the system is
not contributing particles significantly different from expected
levels.
3.1.3.1 Discussion—The control product may have to be
changed periodically if its performance degrades with testing.
Between tests, the control product must be bagged in accordance with the original manufacturer’s packaging and stored in
a clean manner. The control product is used to allow the system
to consider the disruption caused by the activation of any valve
under test, such as significant fluctuations in flow, pressure,
turbulence, and vibration.
3.1.4 dynamic test—test performed to determine particle
contribution as a result of valve actuation.
3.1.5 impact test—test performed to determine particle contribution as a result of mechanical shock while the component
is in the fully open position.
3.1.6 sampling time—the time increment over which counts
are recorded.
3.1.7 sample flow rate—the volumetric flow rate drawn by
the counter for particle detection. The counter may draw higher
flow for other purposes (for example, sheath gas).
3.1.8 spool piece—a null component consisting of a straight
piece of electropolished tubing and appropriate fittings used in
place of the test component to establish the baseline.
3.1.9 standard conditions—101.3 kPa, 20°C (14.73 psia,
68°F).
3.1.10 static test—a test performed on an as-received component in the fully open position. This test establishes particulate contribution by the valve to the counting system.
3.1.11 test duration—total time required to complete the test
procedure.
4. Significance and Use
4.1 The purpose of this test method is to define a procedure
for testing components intended for installation into a highpurity gas distribution system. Application of this test method
is expected to yield comparable data among components tested
for the purposes of qualification for this installation.
4.2 Background Testing—This test method uses background
testing to ensure that the system is not contributing particles
above a low, acceptable level. This ensures that counts seen are
from the test device, not from a contaminated system. The
techniques used to obtain background counts do not produce
conditions identical to the conditions existing when a test
device is in place. It is recommended that the control products
be run periodically to see that they give consistent results.
These control products should be the lowest particle release
products. They will be additional proof that the system is not
contributing excess particles during the static, dynamic, or
impact portions of the test.
4.3 This test method can be used for testing lengths of
tubing. The flow criteria will be identical to that indicated for
valves. A tubing test would only include the static background,
the impact background, and the static and impact portions of
the method. A dynamic portion could be added by actuating the
upstream pneumatic valve (PV1), thus creating a flow surge to
the test length of tubing.
5. Apparatus
5.1 Test Gas—Clean, dry nitrogen or air is to be used
(minimum dryness − 40°C (−40°F) dew point at 689 kPa gage
pressure (100 psig) and <10 ppm total hydrocarbons).
5.2 Filters—Electronics grade filters are required to provide
“particle-free” test gas. Each filter must be no more than 10 %
penetration in accordance with manufacturer’s specifications to
0.02 µm particles and have a pressure drop of less than 6.89
kPa at 0.00471 m3 ⁄s at 689 kPa gage pressure (1 psi at 10
standard ft3/min at 100 psig inlet). The filter must be capable of
passing less than 70 particles ≥ 0.02 µm/m3 (2 particles ≥ 0.02
µm/ft 3) of test gas under test conditions.
5.3 Pressure Regulator—A high-purity electronics grade
pressure regulator is required to maintain system test pressure.
5.4 Pressure Gage—A high-purity electronics grade pressure transducer or gage is required to monitor system test
pressure.
2
Available from Standardization Documents Order Desk, Bldg. 4 Section D, 700
Robbins Ave., Philadelphia, PA 19111-5094, Attn: NPODS.
2
F1394 − 92 (2012)
TFE gaskets is recommended in order to minimize the particles
that may be generated by installation of the test piece.
5.5 Low-Flow Control Device—A high-purity electronics
grade 0 to 0.00472 m3/s flow control device is required for
testing 6.3, 9.5, and 12.7-mm (1⁄4, 3⁄8 and 1⁄2-in.) components.
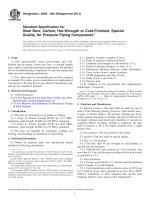
5.14 Mechanical Shock Device—A weight dropped on the
test device is used to provide mechanical shock. Drawing and
component specifications are shown in Section 7.
5.6 High-Flow Control Device—A high-purity electronics
grade 0 to 0.0142 m3 flow control device is required for testing
19, 25.1 and 50.8-mm (3⁄4, 1 and 2-in.) components.
5.15 Instrumentation—A CNC capable of detecting particles as small as 0.02 µm with counting efficiency of 50 %
(1) 3 with a sample flow rate of 0.236× 10 −4 m3/s, is to be used
for particle counting. Test durations in this test method have
been established based on a sampling flow rate of standard
0.0236 L/s.
5.7 Tubing—High-purity electronics grade, electropolished
12.7-mm (1⁄2-in.) 316-L tubing is required. Larger diameter
tubing is required for testing components larger than 12.7 mm
(1 ⁄2 in.).
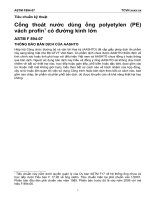
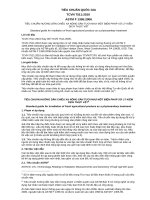
5.8 Sampler—The sampler is to be constructed according to
the drawing (see Fig. 1) and calculations shown in 8. The
sampler collects gas from the stream exiting the test device,
where the sample is near-isokinetic in design.
6. Hazards
6.1 Exhaust from the CNC may contain toxic or flammable
vapors, or both. Make sure that it is properly vented.
5.9 Upstream Adaptor—The upstream adaptor piece connects 12.7-mm (1⁄2-in.) tubing to the test device. For 12.7-mm
(1⁄2-in.) test devices, the adaptor is a simple face-seal connector.
For 6.3-mm (1⁄4-in.) test devices, the adaptor is a smooth
transition between 6.3 and 12.7-mm (1⁄4 and 1⁄2-in.) face-seal
connections.
6.2 This test method is to be conducted at a normal indoor
temperature of between 18°C (64°F) and 26°C (78°F). Environmental temperature within this range is not expected to have
any measurable effect on particle detection.
6.3 Test apparatus shall be enclosed in a Class 100 environment (in accordance with FED-STD-209D). If a clean hood is
used, locate the hood within a clean environment. Use procedures necessary to maintain Class 100 when handling test
apparatus and test component.
5.10 Downstream Adaptor—The downstream adaptor piece
connects 12.7-mm (1⁄2-in.) tubing of the sampler to the test
device. For 12.7-mm (1⁄2-in.) test devices, the adaptor is a
simple face seal connector. For 6.3-mm (1⁄4-in.) test devices,
the adaptor is a tapered cone between 6.3 and 12.7-mm (1⁄4 in.
and 1⁄2-in.) face-seal connections.
6.4 Take care to protect the test apparatus from excessive
vibration. For example, vacuum pumps and compressors shall
be isolated from the system.
5.11 Spool Pieces—Spool pieces shall be the same diameter
as the fittings on the test piece and be 15 cm (6 in.) in length.
The spool piece is to be installed in the system in place of the
test device while obtaining background counts for the system.
7. Sampling
7.1 The average velocity of gas flowing through the sampler
shall approximate the average velocity in the tubing in which
the sampler is inserted. The sample flow rate used to calculate
the sampler diameter is the total flow drawn by the counter. A
typical CNC counter draws 0.472 × 10 −4 standard m3/s (0.1
standard ft3/min) of which only 0.236 × 10 −4 standard m3/s is
used for sampling.
5.12 Fittings—Use face seal connectors or compression
fittings depending on test component end connections.
5.13 Gaskets—Use tetrafluoroethylene (TFE) or nylon gaskets for attaching the test device and adapter pieces. New
gaskets should be used for each new connection. The use of
7.2 Gradual expansion to atmospheric pressure is used for
sampling. Avoid critical orifice expansion due to its complexity
and potential maintenance problems.
7.3 The tip of the sampling probe should have a 30° taper on
the outside diameter.
7.4 The pick-off point shall be centered within the flow
stream.
7.5 The pick-off point should be approximately 15 diameters of the primary flow tube upstream or downstream of any
connection.
7.6 There is enough volume in the exhaust portion of the
sampler to supply the CNC for 1 min. This volume represents
60 times the volume that will be drawn by the CNC while the
valve is closed during the dynamic testing.
7.7 Nominal sample tube diameters have been calculated
and matrixed in the table in the appendix. In most cases, these
FIG. 1 Sampling Device for Testing 1⁄4 , 3⁄8, and 1⁄2 in.
(6.3, 9.5, and 12.7 mm) Valves
3
The boldface numbers in parentheses refer to a list of references at the end of
the text.
3
F1394 − 92 (2012)
approximate the actual diameters needed for isokinetic
sampling, so that standard tube sizes can be used. Under static
flow conditions the sampler size is within 50 % of the size
required to achieve isokinetic sampling. For particles of
interest < 0.5 µm, Hinds and Fissan (2, 3) indicate that any
likely isokinetic sampling biases are insignificant. During
dynamic testing, isokinetic sampling is compromised regardless of the sample tube size.
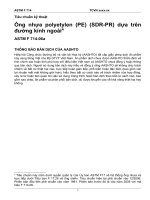
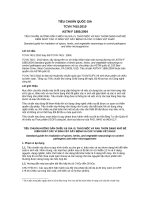
7.7.1 To establish isokinetic sampling condition (refer to
Fig. 2 and (4) ):
V1 5 V2
(1)
Q 5 AV
(2)
Q 1 /A 1 5 Q 2 /A 2
(3)
A 2 5 A 1 ~ Q 2 /Q 1 !
(4)
D 2 5 D 1 ~ Q 2 /Q
where:
Q =
A =
V =
D =
1 =
2 =
1
1 2
!
(5)
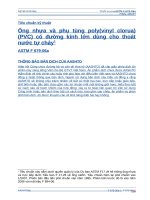
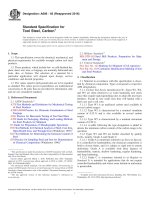
NOTE 1—See Fig. 1 for detail.
FIG. 3 Schematic of Particle Test Loop
flow rate (volumetric), m 3/s,
area (internal cross section), m 2,
velocity (average), m/s,
diameter (internal), m,
main flow line, and
sample flow line.
8.4 Install the spool piece when the test stand is not in use.
Maintain a continuous low flow to purge the system (see 9.5).
The particle counter may be turned off. For an extended
shutdown, the system (excluding the CNC) should be pressurized and capped.
7.7.1.1 If pressure correction at point of flow control device
is needed, then:
Q s 5 @ ~ P1101.3! /101.3# 1/2 3 Q
A
8.5 After initial construction, the spool piece should be
installed and the system should be cleaned by flowing clean dry
gas at 0.0005 to 0.001 m3/s and tapping all components (except
the CNC) downstream of the final filter. This procedure should
be followed by a start-up phase that characterizes system
cleanliness by conducting the entire test protocol with the
control product (see 3.1.3) installed. This start-up phase shall
continue and be repeated as necessary until the counts from the
control product have stabilized at or below the expected
number of counts from the test components.
(6)
where:
P = absolute pressure, kPa,
QA = actual flow rate, m 3/s, and
Qs = standard flow rate, m 3/s.
Temperature variances are assumed to be negligible.
8. Calibration
9. Procedure
8.1 Calibrate instruments regularly, according to manufacturer’s recommendations. For the CNC, this includes routine
checks of sample flow rate, liquid level, and zero.
NOTE 2—Ensure the counter is counting continuously and reporting
data every minute. For the duration of the test, the counter shall be
continuously counting, except where noted in the test protocol.
8.2 The CNC and data collection equipment must have
power surge suppression protection.
9.1 Background Test:
9.1.1 Ensure that the spool piece and proper adapters are in
place on the test apparatus.
9.1.2 Close the pneumatic valve (PV1). Set the regulator to
206.7 kPa gage pressure (30 psig). Open the pneumatic valve
(PV1) to establish flow. Using the flow control device, set the
test flow rate according to the size of components to be tested
(see the table in the appendix). The volumetric flow rate
required to maintain the test velocity is calculated at the outlet
of the test component, assuming near atmospheric conditions.
This flow rate may need to be corrected for the flowmeter
outlet pressure if this device is not calibrated for standard
conditions. Measure the static background count. Background
count is established when the counter has sampled a minimum
of 0.00142 standard m3 (3 standard ft3), and the arithmetic
average during the last 0.00142 standard m3/s (3 standard ft3
/min) of gas sampled is < 70 particles/standard m3 (<2
particles/standard ft3). At a sample flow rate of 0.236 × 10 −4
m3 /s (0.05 standard ft3 /min), the time required is 1 h. Ensure
8.3 Setup and Schematic—See Fig. 3.
NOTE 1—Details of components and connector layout and configuration
prior to the test component or valve outlet are not critical and may be
arranged for optimum convenience until connections are made to the
components shown in Fig. 2. The components of Fig. 2 shall be configured
as shown.
FIG. 2 Isokinetic Sampler Calculation
4
F1394 − 92 (2012)
9.2.1 Using the flow control device, decrease the flow rate
to 0.472 × 10 −4 to 0.944 × 10 −4 standard m3/s (0.1 to 0.2
standard ft3/min), so that flow remains in the system while the
test component is installed.
9.2.2 Remove the spool piece by first disconnecting the
downstream fitting and then the upstream fitting. Immediately
install the test component in a fully open position by first
connecting the upstream fitting and then the downstream
fitting. Removal of the spool piece and installation of the test
component to minimize extraneous contamination. Take extreme care to minimize contamination of the test apparatus
during this operation. Remove the test component from its
inner bag in the Class 100 test area. If the test component has
mechanical fittings, properly connect these fittings. If the test
component has tube ends, install the component with clean
compression fittings. Do not permanently crimp any ferrules
onto the tube stubs. Nylon ferrules are acceptable.
9.2.3 Using the flow control device, increase the flow to
obtain the test velocity (see the table in the appendix). Velocity
equals the volumetric flow divided by the cross sectional area
of the outlet. The volumetric flowrate required to maintain the
test velocity is calculated at the outlet of the test component,
assuming near atmospheric conditions. This flow rate may
need to be corrected for the flowmeter outlet pressure if this
device is not calibrated for standard conditions.
9.2.4 Turn on the counter and conduct the static test. Test
the valve in a fully open position until 0.00142 standard m3 (3
standard ft3) of gas have been sampled. Cumulative data
should be recorded at 1-min intervals.
that the background counts are stable or decreasing. If background cannot be achieved after 0.00283 standard m3 (6
standard ft3) have been sampled, there may be a problem with
the counter or test apparatus requiring repair or modification.
9.1.3 Actuate the pneumatic valve at 30 cycles per minute to
measure the background counts under dynamic test conditions.
A cycle consists of 1 s duration for the ''off” and ''on” portion
of valve actuation. Dynamic background count is established
when the counter has sampled a minimum of 0.00142 standard
m3 (3 standard ft3), and the arithmetic average during the last
0.00142 standard m3 (3 standard ft3) of gas sampled is 105
particles/standard m3 (< 3 particles/standard ft3). (Estimated
dynamic background count will be verified and altered if
necessary during the validation phase of this test method.) At a
sample flow rate of 0.236 × 10 −4 m3/s (0.05 standard ft3/min),
the time required is 1 h. If dynamic background cannot be
achieved after 0.00283 standard m3 (6 standard ft3) have been
sampled, there may be a problem with the counter or test
apparatus, requiring repair or modification.
9.1.4 Stop the pneumatic valve cycling. Flush the system for
10 min under static test conditions.
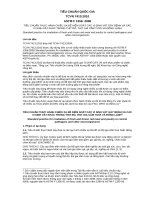
9.1.5 Impact the spool piece once per minute for 10 min
with the mechanical shock device (see Fig. 4). The impact
background count should be 140 particles/standard m3 (<4
particles/standard ft3) over the 10 min of the test. (Estimated
impact background count will be verified and altered if
necessary during the validation phase of this test method.) If
impact background cannot be achieved, repeat the shock a
second time. If the impact background count specification still
cannot be met, there may be a problem with the counter or test
apparatus.
9.1.6 Flush the system for 30 min at the test flow rate.
Record the resulting count.
9.1.7 Turn the CNC off.
9.3 Dynamic Test:
9.3.1 This test is to immediately follow the static test. To
conduct the dynamic test, actuate the valve at the rate of 30
cycles/min for 60 min. A cycle consists of ''off” and ''on”
actuation of the valve. Make sure that the off and on cycles are
of equal duration.
9.3.2 Manual Valve Testing—The difference between automatic and manual valve testing is in the dynamic test. There are
toggle, 1⁄4-turn, and multiple-turn valves. Make sure that these
valves are only closed for 1 s. Make sure that the multiple turn
valves are opened for a duration of 2 s, remain open for 1 s,
closed for 2 s, and remain closed for 1 s. An automatic actuator
for the manual valve is recommended. For 1⁄4-turn and toggle
valves, assume the open and closing cycles take about 1 s. The
dynamic portion of the test runs for 60 min. In multi-turn and
quarter-turn manual valves with plastic seats, the torque
applied, either by hand or through automation, will affect the
deformations and resulting particulate generation. This potentially limits the ability to compare test data generated from
different test stands due to varying torque values.
9.2 Static Test:
NOTE 3—Extended dynamic testing can be used as an optional test for
cleanliness of dynamic components after extended use. Dynamic components can be cycled off line, in a clean environment, then inserted into the
test apparatus and tested in accordance with this test method to determine
performance.
9.4 Impact Test—This test shall immediately follow the
dynamic test. Maintain the test flow rate for 30 min, with the
valve in the fully open position. Impact the valve once a minute
FIG. 4 Mechanical Shock Device
5
F1394 − 92 (2012)
for 10 min, using the mechanical shock device. Maintain the
test flow rate for 30 min.
10.3.4 Sample calculations based on data shown in Figs.
X1.1-X1.6.
9.5 Turn the counter off and then decrease the test gas flow
rate to approximately 0.00023 standard m3/s.
10.4 To determine if Valve A generated a significantly
greater number of particles (statistically) than background
during the first 10 min of the static test:
10.4.1 For the valve data during the first 10 min of the static
test:
9.6 Remove the test valve by first disconnecting the downstream fitting and then the upstream fitting, and immediately
install the spool piece by connecting the upstream fitting
followed by the downstream fitting.
k
v
λ1
s12
9.7 Point of use filters (of any type) are tested similarly.
During the dynamic test, the upstream pneumatic valve (PV1)
is actuated. Static and impact tests are the same as the valve
test. Conduct tests at the maximum rated flow as specified by
the manufacturer. Comparisons can only be made on filters that
were tested at the same flow rate.
k
= 3
v
= 0.00023 standard m3 (0.5 standard ft3),
λ2 = k/v = 6, and
S22 = k/v2 = 12.
Then: S D = (S 1 2 + S 2 2 ) 1/2 = (188 + 12) = 14.14 and
λD = λ1 − λ2 = 94 − 6 = 88.
10. Calculation
10.1 Data Reduction—Perform comparative calculations
based on the VanSlooten guidelines (5). The analysis determines the significance of the difference between the mean
particle concentration of the test device and the background. It
can also determine the significance of difference in particle
concentrations between test devices.
10.4.3 The critical value in percent is calculated as:
C98
C98
C99
C99
C99.9
C99.9
10.2 Definition of Poisson Distribution:
λ
S2
SD
47 counts,
0.00023 standard m3 (0.5 standard ft3)
k/v = 94, and
k/v2 = 188.
10.4.2 For the background data during the first 10 min:
NOTE 4—This test will yield cleanliness data on ''as received” filters.
Efficiency tests are also required to fully characterize filter performance.
k
v
=
=
=
=
= particle counts,
= 0.00023 standard m 3 (0.5 standard ft 3), sample
volume,
= k/v = mean counts/unit of volume,
= k/v 2 = variance, and
= difference of variance = (Sx 2 + Sy 2) 1/2, where Sx + Sy
are the variances of two data groups being compared.
=
=
=
=
=
=
ZβSD, where Zβ = 2.08
29.41, or
ZβSD, where Zβ = 2.33
32.95, or
ZβSD, where Zβ = 3.17,
44.82.
10.4.4 λD is greater than the percent of C99.9; therefore, it
can be stated with 99.9 % confidence that Valve A generated a
significantly greater number of particles (statistically) than
background during the first 10 min of the static test.
10.5 To determine if Valve B generated a significantly
greater number of particles (statistically) than Valve A during
the first 10 min of dynamic testing:
10.5.1 Applying the same calculations in percent as in 10.3
to these two sets of data to determine that:
10.3 To determine whether there is a difference between two
data groups requires determining the test statistic and the
critical value.
10.3.1 Test Statistic:
λD
C98
C99
C99.9
where:
λD = difference in mean counts/unit of volume,
λx = for Group x, the mean counts/unit of volume, and
λy = for Group y, the mean counts/unit of volume.
=
=
=
=
114,
102.5,
114.8, and
156.2.
10.5.2 λD is greater in percent than C98 but not greater than
C99; therefore, it can be stated with only 99 % confidence that
Valve B generated a statistically significant greater number of
particles than Valve A during the first 10 min of dynamic
testing.
10.3.2 Critical Value:
C 5 Z βS D
Zβ is the normal deviate and is determined by the desired
level of confidence. For the purpose of this test method:
10.6 For comparing counts generated by a single valve to
background counts, the data shown on the summary sheet
should be collected on each valve and the calculations performed. If more than one of the same valve is tested, data
should be summed and calculations performed based on the
total number of counts and volume sampled.
Z0.98 = 98 % confidence = 2.08,
Z0.99 = 99 % confidence = 2.33, and
Z0.999 = 99.9 % confidence = 3.17.
10.3.3 Using these two values, it may be stated with the
appropriate confidence level that if:
λD > C, then the difference is significant
or,
λD < C, then the difference is not significant
10.7 For comparing counts generated by a single valve type
to counts generated by a different valve type, the data shown on
the summary sheet should be collected and the calculations
performed. If more than one of the same valve is tested, data
6
F1394 − 92 (2012)
TABLE 2 Particle Data Confidence Statement Summary Sheet
should be summed and calculations performed based on the
total number of counts and volume sampled.
Valve B generated more particles than Valve A
10.8 A summary of all confidence statements should accompany the data and be formulated as follows in Table 1:
Static, first 10 min
Static, 60 min
Dynamic, first 10 min
Dynamic, 60 min
Impact, first minute
Impact, first 10 min
Impact, 40 min
10.9 A summary of all confidence statements for comparisons between valves should accompany the data and be
formulated as follows in Table 2:
11. Report
11.1 Report the following test conditions:
11.1.1 Date and time of test,
11.1.2 Operator,
11.1.3 Test flow rate, m3 /s (standard ft3 /min),
11.1.4 Test pressure, kPa gage pressure (psig),
11.1.5 Valve type, manufacturer, serial number, lot number,
and model number,
11.1.6 CNC manufacturer, serial number, sample flow rate,
standard m3/s (standard ft3/min),
11.1.7 Test gas type and dew point (°C) model number, and
calibration date,
11.1.8 Schematic of the test apparatus, including manufacturer’s and model numbers of all test apparatus components,
11.1.9 Calibration dates for the flow meters and the test date
should also be reported (see Fig. X1.7 for sample data sheet).
Valve A generated more particles than Valve B
Static, first 10 min
Static, 60 min
Dynamic, first 10 min
Dynamic, 60 min
Impact, first minute
Impact, first 10 min
Impact, 40 min
98 % Confident 99 % Confident 99.9 % Confident
(Y/N)
(Y/N)
(Y/N)
_________
_________
_________
_________
_________
_________
_________
_________
_________
_________
_________
_________
_________
_________
_________
_________
_________
_________
_________
_________
_________
11.3.1 Graph the static, dynamic and impact portions of the
test separately as counts per min (measured by the counter)
versus time, including the appropriate background measured
with the spool piece in place) with each. Also graph the entire
data set as counts per min versus time. If different valves are to
be compared, graph their entire data sets together. (See Figs.
X1.8-X1.11).
11.3.2 Record and present the entire raw data set in tabular
form as shown in Fig. X1.12 and Fig. X1.13.
11.2 Data Acquisition—The data link between the counter
and any data acquisition system should be qualified and
checked for accuracy and consistency.
11.3 Data Presentation:
TABLE 1 Particle Data Confidence Statement Summary Sheet
12. Precision and Bias
Valve A generated more particles than background
Static, first 10 min
Static, 60 min
Dynamic, first 10 min
Dynamic, 60 min
Impact, first minute
Impact, first 10 min
Impact, 40 min
98 % Confident 99 % Confident 99.9 % Confident
(Y/N)
(Y/N)
(Y/N)
_________
_________
_________
_________
_________
_________
_________
_________
_________
_________
_________
_________
_________
_________
_________
_________
_________
_________
_________
_________
_________
12.1 The precision and bias of the data generated by this test
method is limited to the precision and bias of the particle
measuring instruments utilized.
98 % Confident 99 % Confident 99.9 % Confident
(Y/N)
(Y/N)
(Y/N)
_________
_________
_________
_________
_________
_________
_________
_________
_________
_________
_________
_________
_________
_________
_________
_________
_________
_________
_________
_________
_________
13. Keywords
13.1 condensation nucleus center; contamination; gas distribution; gas distribution valves; isokinetic sampling; nitrogen; particle contamination; particle counter; particles; semiconductor processing
7
F1394 − 92 (2012)
APPENDIX
(Nonmandatory Information)
X1. Additional Test Data
X1.1 See Table X1.1 and Figs. X1.1-X1.13.
TABLE X1.1 Matrix of Typical Test Flow Rates Nominal Outside Diameters
0 Test
Component
Nominal
Diameter, in.
1 Test
Component
Outlet Inside
Diameter, in.
2 Reynolds
Number
3 Average
Test Velocity,
ft/s
4 Test
Flow Rate,
ft 3/min
1 1 ⁄4
2 3 ⁄8
3 1 ⁄2
4 3 ⁄4
51
62
0.180
0.305
0.402
0.652
0.870
1.870
20 600
20 600
20 600
20 600
20 600
20 600
224
132
100
62
46
22
2.4
4.0
5.3
8.6
11.4
25.2
0 Test
Component
Nominal
Diameter, in.
1 1⁄ 4
2 3⁄ 8
3 1⁄ 2
4 3⁄ 4
51
62
1 in. = 25.4 mm.
5 Expansion
Cone Inside
Diameter,
in.
6 Sample
Tube Inside
Diameter
80.10 ft 3/min
Flowrate, in.
7 Sample
Tube Outside
Diameter
Nominal,
in.
0.43
0.43
0.43
1.87
1.87
1.87
0.09
0.07
0.06
0.20
0.18
0.12
18
8
⁄
⁄
1⁄ 8
1⁄ 4
1⁄ 4
1⁄ 4
18
F1394 − 92 (2012)
FIG. X1.1 Valves A and B Complete Test
9
F1394 − 92 (2012)
FIG. X1.2 Valve A Static Test Data
10
F1394 − 92 (2012)
FIG. X1.3 Valve A Dynamic Test Data
11
F1394 − 92 (2012)
FIG. X1.4 Valve A Impact Test Data
12
F1394 − 92 (2012)
FIG. X1.5 Valve A Complete Test Data
13
F1394 − 92 (2012)
FIG. X1.5 Valve A Complete Test Data (continued)
14
F1394 − 92 (2012)
FIG. X1.5 Valve A Complete Test Data (continued)
15
F1394 − 92 (2012)
FIG. X1.6 Valve B Complete Test Data
16
F1394 − 92 (2012)
FIG. X1.6 Valve B Complete Test Data (continued)
17
F1394 − 92 (2012)
FIG. X1.6 Valve B Complete Test Data (continued)
FIG. X1.7 Particle Data Summary Sheet
18
F1394 − 92 (2012)
FIG. X1.8 Valve A Static Test
19
F1394 − 92 (2012)
FIG. X1.9 Valve A Dynamic Test
20
F1394 − 92 (2012)
FIG. X1.10 Valve A Impact Test
21
F1394 − 92 (2012)
FIG. X1.11 Valve A Complete Test
22
F1394 − 92 (2012)
FIG. X1.12 Particle Background Data
23
F1394 − 92 (2012)
FIG. X1.12 Particle Background Data (continued)
24
F1394 − 92 (2012)
FIG. X1.13 Particle Test Data
25