Astm d 1252 06 (2012)e1
Bạn đang xem bản rút gọn của tài liệu. Xem và tải ngay bản đầy đủ của tài liệu tại đây (339.9 KB, 12 trang )
Designation: D1252 − 06 (Reapproved 2012)´1
Standard Test Methods for
Chemical Oxygen Demand (Dichromate Oxygen Demand) of
Water1
This standard is issued under the fixed designation D1252; the number immediately following the designation indicates the year of
original adoption or, in the case of revision, the year of last revision. A number in parentheses indicates the year of last reapproval. A
superscript epsilon (´) indicates an editorial change since the last revision or reapproval.
This standard has been approved for use by agencies of the U.S. Department of Defense.
ε1 NOTE—Editorial corrections made throughout in June 2013.
2. Referenced Documents
1. Scope
2.1 ASTM Standards:2
D1129 Terminology Relating to Water
D1193 Specification for Reagent Water
D2777 Practice for Determination of Precision and Bias of
Applicable Test Methods of Committee D19 on Water
D3223 Test Method for Total Mercury in Water
D3370 Practices for Sampling Water from Closed Conduits
D5905 Practice for the Preparation of Substitute Wastewater
E60 Practice for Analysis of Metals, Ores, and Related
Materials by Spectrophotometry
E275 Practice for Describing and Measuring Performance of
Ultraviolet and Visible Spectrophotometers
1.1 These test methods cover the determination of the
quantity of oxygen that certain impurities in water will
consume, based on the reduction of a dichromate solution
under specified conditions. The following test methods are
included:
Test Method A 2 Macro COD by Reflux Digestion and Titration
Test Method B 2 Micro COD by Sealed Digestion and Spectrometry
1.2 These test methods are limited by the reagents employed
to a maximum chemical oxygen demand (COD) of 800 mg/L.
Samples with higher COD concentrations may be processed by
appropriate dilution of the sample. Modified procedures in
each test method (Section 15 for Test Method A and Section 24
for Test Method B) may be used for waters of low COD
content (< 50 mg/L).
3. Terminology
3.1 Definitions—For definitions of other terms used in these
test methods, refer to Terminology D1129.
1.3 As a general rule, COD results are not accurate if the
sample contains more than 1000 mg/L Cl−. Consequently, these
test methods should not be applied to samples such as
seawaters and brines unless the samples are pretreated as
described in Appendix X1.
3.2 The term “oxygen demand” (COD) in these test methods is defined in accordance with Terminology D1129 as
follows:
3.2.1 oxygen demand—the amount of oxygen required under specified test conditions for the oxidation of water borne
organic and inorganic matter.
1.4 This test method was used successfully on a standard
made up in reagent water. It is the user’s responsibility to
ensure the validity of these test methods for waters of untested
matrices.
4. Summary of Test Methods
4.1 Most organic and oxidizable inorganic substances present in water are oxidized by a standard potassium dichromate
solution in 50 % sulfuric acid (vol/vol). The dichromate
consumed (Test Method A) or tri-valent chromium produced
(Test Method B) is determined for calculation of the COD
value.
1.5 This standard does not purport to address all of the
safety concerns, if any, associated with its use. It is the
responsibility of the user of this standard to establish appropriate safety and health practices and determine the applicability of regulatory limitations prior to use. For specific hazard
statements, see Section 8, 15.6, and 24.5.
4.2 The oxidation of many otherwise refractory organics is
facilitated by the use of silver sulfate that acts as a catalyst in
the reaction.
1
These test methods are under the jurisdiction of ASTM Committee D19 on
Water and are the direct responsibility of Subcommittee D19.06 on Methods for
Analysis for Organic Substances in Water.
Current edition approved June 15, 2012. Published June 2012. Originally
approved in 1953. Last previous edition approved in 2006 as D1252 – 06. DOI:
10.1520/D1252-06R12E01.
2
For referenced ASTM standards, visit the ASTM website, www.astm.org, or
contact ASTM Customer Service at For Annual Book of ASTM
Standards volume information, refer to the standard’s Document Summary page on
the ASTM website.
Copyright © ASTM International, 100 Barr Harbor Drive, PO Box C700, West Conshohocken, PA 19428-2959. United States
1
D1252 − 06 (2012)´1
5. Significance and Use
4.3 These test methods provide for combining the reagents
and sample in a manner that minimizes the loss of volatile
organic materials, if present.
5.1 These test methods are used to chemically determine the
maximum quantity of oxygen that could be consumed by
biological or natural chemical processes due to impurities in
water. Typically this measurement is used to monitor and
control oxygen-consuming pollutants, both inorganic and
organic, in domestic and industrial wastewaters.
4.4 The oxidation of up to 1000 mg/L of chloride ion is
inhibited by the addition of mercuric sulfate to form stable and
soluble mercuric sulfate complex. A technique to remove up to
40 000 mg/L chloride is shown in Appendix X1 for Test
Method B. The maximum chloride concentration that may be
tolerated with the procedure for low COD, Test Method A
(15.10), has not been established.
5.2 The relationship of COD to other water quality parameters such as TOC and TOD is described in the literature. 3
6. Interference and Reactivity
4.5 The chemical reaction involved in oxidation of materials
by dichromate is illustrated by the following reaction with
potassium acid phthalate (KC8H5O4):
6.1 Chloride ion is quantitatively oxidized by dichromate in
acid solution. (1.0 mg/L of chloride is equivalent to 0.226 mg/L
of COD.) As the COD test is not intended to measure this
demand, concern for chloride oxidation is eliminated up to
1000 mg/L of chloride by complexing with mercuric sulfate.
6.1.1 Up to 40 000 mg/L chloride ion can be removed with
a cation based ion exchange resin in the silver form as
described in Appendix X1 when using Test Method B. Since
this pretreatment was not evaluated during the interlaboratory
study, the user of the test method is responsible to establish the
precision and bias of each sample matrix.
41 H 2 SO4 110 K 2 Cr 2 O 7 12 KC8 H 5 O 4
→10 Cr2 ~ SO4 ! 3 111 K 2 SO4 116 CO2 146 H 2 O
Since 10 mol of potassium dichromate has the same oxidation power as 15 mol of oxygen, the equivalent reaction is:
2 KC8 H 5 O 4 115 O 2 1H 2 SO4 →16 CO2 16 H 2 O1K 2 SO4
Thus 2 mol of potassium acid phthalate consumes 15 mol of
oxygen. The theoretical COD of potassium acid phthalate is
1.175 g of oxygen per gram of potassium acid phthalate (Table
1).
6.2 Oxidizable inorganic ions, such as ferrous, nitrite,
sulfite, and sulfides are oxidized and measured as well as
organic constituents.
TABLE 1 Test Method A, Recovery of Theoretical COD for
Various Organic Material
Component
Aliphatic Compounds
Acetone
Acetic acid
Acrolein
Butyric acid
Dextrose
Diethylene glycol
Ethyl acetate
Methyl ethyl ketone
Aromatic Compounds
Acetophenone
Benzaldehyde
Benzene
Benzoic acid
Dioctyl phthalate
Diphenyl
o-cresol
Toluene
Potassium acid
phthalate
Nitrogen Compounds
Acrylonitrile
Adenine
Aniline
Butyl amine
Pyridine
Quinoline
Trimethylamine
Tryptophane
Uric acid
7. Reagents
Reactivity, Percent of Theoretical
1A
2B
3C
4D
5E
98
92
62
89
95
93
95
98
...
92
...
93
...
...
...
...
96
98
...
...
...
...
...
...
94
...
...
...
...
70
85
90
...
...
...
...
...
...
...
...
89
...
60–98
98
83
81
95
83
100
...
...
...
...
...
...
...
...
...
...
...
41
...
...
...
...
...
...
...
80
...
100
...
...
95
45
...
...
...
...
...
...
...
...
...
...
48
...
80
57
0
...
1
...
...
...
...
...
...
...
...
...
...
...
...
...
...
...
1
...
...
...
...
44
...
74
...
...
...
...
...
...
...
59
...
...
2
87
...
87
61
7.1 Purity of Reagents—Reagent grade chemicals shall be
used in all tests. All reagents shall conform to the specifications
of the Committee on Analytical Reagents of the American
Chemical Society, where such specifications are available. 4
7.2 Purity of Water— Unless otherwise indicated, reference
to water shall be understood to mean reagent water that meets
the purity specifications of Type I or Type II water, presented
in D1193.
8. Hazards
8.1 Exercise extreme care when handling concentrated sulfuric acid, especially at the start of the refluxing step (15.7).
8.2 Silver sulfate is poisonous; avoid contact with the
chemical and its solution.
8.3 Mercuric sulfate is very toxic; avoid contact with the
chemical and its solution.
9. Sampling
9.1 Collect the sample in accordance with Practices D3370.
9.2 Preserve samples by cooling to 4°C if analyzed within
24 h after sampling, or preserve for up to 28 days at 4°C and
3
Handbook for Monitoring Industrial Wastewater, U.S. Environmental Protection Agency, Aug. 1973, pp. 5-10 to 5-12.
4
Reagent Chemicals, American Chemical Society Specifications, American
Chemical Society, Washington, DC. For suggestions on the testing of reagents not
listed by the American Chemical Society, see Analar Standards for Laboratory
Chemicals, BDH Ltd., Poole, Dorset, U.K., and the United States Pharmacopeia
and National Formulary, U.S. Pharmaceutical Convention, Inc. (USPC), Rockville,
MD.
A
Hamilton, C. E., unpublished data.
Moore, W. A., and Walker, W. W., Analytical Chemistry, Vol 28, 1956, p. 164.
C
Dobbs, R. A., Williams, R. T., ibid., Vol 35, 1963 p. 1064.
D
Buzzell, J. C., Young, R. H. F., and Ryckman, D. W.,“ Behaviors of Organic
Chemicals in the Aquatic Environment; Part II, Dilute Systems,” Manufacturing
Chemists Association, April 1968, p. 34.
E
Chudoba, J., and Dalesicky, J., Water Research, Vol 7, No. 5, 1973, p. 663.
B
2
D1252 − 06 (2012)´1
at pH < 2 by addition of concentrated sulfuric acid. The
addition of 2 mL of concentrated sulfuric acid per litre at the
time of collection will generally achieve this requirement. The
actual holding time possible without significant change in the
COD may be less than 28 days, especially when easily
oxidizable substances are present. It is the responsibility of the
users of the test method to ensure the maximum holding time
for their samples.
TEST METHOD A—MACRO COD BY REFLUX DIGESTION AND TITRATION
10. Scope
(FeSO4·(NH4)SO4·6H2O) in water. Add 20 mL of sulfuric acid
(H2SO4, sp gr 1.84), cool and dilute to 1 L. Standardize this
solution daily before use. To standardize, dilute 25.0 mL of
0.25 N potassium dichromate solution (K2Cr2O7) to about 250
mL. Add 20 mL of sulfuric acid (sp gr 1.84) and allow the
solution to cool. Titrate with the ferrous ammonium sulfate
solution to be standardized, using the phenanthroline ferrous
sulfate indicator as directed in 15.10. Calculate the normality
as follows:
10.1 The amount of dichromate consumed in Test Method A
is determined by titration rather than the spectrophotometric
procedure used in Test Method B. This test method is appropriate where larger sample volumes would provide better
precision and better representativeness of where equipment or
space limitations exist.
10.2 The precision of this test method in standard solutions
containing low-volatility organic compounds has been examined in the range of approximately 10 to 300 mg/L.
N 5 ~ A 3 B ! /C
11. Summary of Test Method
where:
N
=
A
=
B
=
C
=
11.1 The sample and standardized dichromate solution, in a
50 % by volume sulfuric solution, is refluxed for a 2-h
digestion period.
11.2 Excess dichromate after the digestion period is titrated
with a standard ferrous ammonium sulfate solution using
ortho-phenanthroline ferrous complex as an internal indicator.
normality of the ferrous ammonium sulfate solution,
potassium dichromate solution, mL,
normality of the potassium dichromate solution, and
ferrous ammonium sulfate solution, mL.
14.2 Ferrous Ammonium Sulfate Solution (0.025 N)—
Dilute 100 mL of 0.25 N ferrous ammonium sulfate solution to
1 L. Standardize against 0.025 N potassium dichromate solution as in 14.1. This solution is required only if COD is
determined in the range of 10 to 50 mg/L.
12. Interferences
12.1 The test method does not uniformly oxidize all organic
materials. Some compounds, for example, are quite resistant to
oxidation, while others, such as carbohydrates, are easily
oxidized. A guide to the behavior of various types of organic
materials is provided in Table 1.
14.3 Mercuric Sulfate— Powdered mercuric sulfate
(HgSO4).
14.4 Phenanthroline Ferrous Sulfate Indicator Solution—
Dissolve 1.48 g of 1,10-(ortho)-phenanthroline monohydrate,
together with 0.70 g of ferrous sulfate (FeSO4·7H2O), in 100
mL of water. This indicator may be purchased already prepared.
12.2 Volatile organics that are difficult to oxidize may be
partially lost before oxidation is achieved. Care in maintaining
a low-solution temperature (about 40°C) and permitting oxidation to proceed at the lower temperature for a period of time
before reflux is initiated will result in higher recoveries of
theoretical COD of volatile organics.
14.5 Potassium Acid Phthalate Solution, Standard (1
mL = 1 mg COD)—Dissolve 0.851 g of potassium acid phthalate (KC8H5 O4), primary standard, in water and dilute to 1 L.
13. Apparatus
14.6 Potassium Dichromate Solution, Standard (0.25 N)—
Dissolve 12.259 g of potassium dichromate (K2Cr2O7) primary
standard grade, previously dried at 103°C for 2 h, in water and
dilute to 1 L in a volumetric flask.
13.1 Reflux Apparatus— The apparatus consists of a
500-mL Erlenmeyer or a 300-mL round-bottom flask, made of
heat-resistant glass connected to a 300-mm (12-in.) Allihn
condenser by means of a ground-glass joint. Any equivalent
reflux apparatus may be substituted, provided that a groundglass connection is used between the flask and the condenser,
and provided that the flask is made of heat-resistant glass.
14.7 Potassium Dichromate Solution, Standard (0.025 N)—
Dilute 100.0 mL of 0.25 N potassium dichromate solution to 1
L. This solution is necessary only for determination of COD in
the range of 10 to 50 mg/L.
13.2 Sample Heating Apparatus—A heating mantle or hot
plate capable of delivering sufficient controlled heat to maintain a steady reflux rate in the reflux apparatus is satisfactory.
13.3 Apparatus for Blending or Homogenizing Samples—A
household blender is satisfactory.
14.8 Sulfuric Acid-Silver Sulfate Solution—Dissolve 15 g of
powdered silver sulfate (Ag2 SO4) in 300 mL of concentrated
sulfuric acid (sp gr 1.84) and dilute to 1 L with concentrated
sulfuric acid (sp gr 1.84).
14. Reagents
15. Procedure
14.1 Ferrous Ammonium Sulfate Solution (0.25 N)—
Dissolve 98.0 g of ferrous ammonium sulfate solution
15.1 Homogenize the sample by blending if necessary.
Place 50.0 mL of the sample in a reflux flask. If less than 50 mL
3
D1252 − 06 (2012)´1
round-bottom flask has been used, transfer the digestate to a
500-mL Erlenmeyer flask, washing out the reflux flask three or
four times with water. Dilute the acid solution to about 300 mL
with water and allow the solution to cool to about room
temperature.
of the sample is used, make up the difference in water, then add
the sample aliquot and mix. Samples containing more than 800
mg/L COD are diluted and mixed precisely with water and 50.0
mL of the diluted sample are placed in a reflux flask.
NOTE 1—If the sample is diluted, it must consume at least 5 mL of
dichromate. Dilute the sample if more than 20 mL of the titrant is needed
to reach the endpoint.
15.9 Add 8 to 10 drops of phenanthroline ferrous sulfate
solution and titrate the excess dichromate with 0.25 N ferrous
ammonium solution. The color change at the end point will be
sharp, changing from a blue-green to a reddish hue. If the
solution immediately turns a reddish-brown upon the addition
of the indicator, repeat the analysis on a smaller sample aliquot.
15.2 Place 50 mL of water in a reflux flask for the blank
determination.
15.3 Place the reflux flasks in an ice bath and add 1 g of
powdered mercuric sulfate, 5.0 mL of concentrated sulfuric
acid, and several glass beads or boiling stones. Mix well to
complete dissolution.
NOTE 3—To avoid unnecessary pollution of the environment, dispose of
mercury-containing waste solution properly. Refer to Test Method D3223,
Appendix XI for instructions.
15.4 With the flasks still in the ice bath, add slowly and with
stirring, 25.0 mL of 0.25 N standard potassium dichromate
solution.
15.10 For waters of low COD (10 to 50 mg/L), use 0.025 N
potassium dichromate and ferrous ammonium sulfate solutions
(14.2 and 14.7). If the COD is determined to be higher than 50
mg/L after using these reagents, reanalyze the sample, using
the more concentrated reagents.
15.5 With the flasks still in the ice bath, add 70 mL of
sulfuric acid-silver sulfate solution slowly such that the solution temperature is maintained as low as possible, preferably
below 40°C.
16. Calculation
16.1 Calculate the COD in the sample in milligrams per litre
as follows:
NOTE 2—If a particular waste is known to contain no volatile organic
substances, the acid mixture may be added gradually, with less precaution,
while the flask is immersed in the iced bath.
COD, mg/L 5 ~~ A 2 B ! N 3 8000! /S
15.6 Attach the flasks to the condensers and start the flow of
cold water. (Warning—Take care to ensure that the contents of
the flask are well mixed; if not, superheating may result and the
mixture may be expulsed from the open end of the condenser.)
where:
A = ferrous ammonium sulfate solutions required for titration of the blank, mL,
B = ferrous ammonium sulfate solution required for titration of the sample, mL,
N = normality of the ferrous ammonium sulfate solution,
and
S = sample used for the test, mL.
15.7 Apply heat to the flasks and reflux for 2 h. Place a
small beaker or other cover over the open end of each
condenser to prevent intrusion of foreign material.
15.8 Allow the flasks to cool and wash down the condensers
with about 25 mL of water before removing flasks. If a
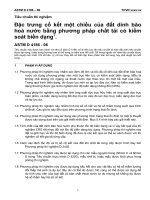
17. Precision and Bias5
17.1 The overall precision of Test Method A within the
range from 10 to 300 mg/L varies with the quantity being
tested according to Fig. 1.
17.2 The data used in the calculation of precision are from
EPA “Method Research Study 3” (1971) that involved two
levels of COD, 12.3 mg/L (86 laboratories) and 270 mg/L (82
laboratories), and EPA“ Water Pollution Laboratory Performance Evaluation, No. 8” (1982) that involved two levels of
COD, 40.2 mg/L (65 laboratories) and 92 mg/L (67 laboratories).
17.3 The test data were obtained on reagent grade water and
these precision and bias values may not be applicable to more
complex water matrices. It is the user’s responsibility to ensure
the validity of this test method to waters of untested matrices.
17.4 The precision obtained by the interlaboratory study is
overall, St. Since very carefully standardized samples in very
5
Supporting data were taken from “Method Research Study 3” (1971) and
“Water Pollution Laboratory Performance No. 8” (1982), Environmental Protection
Agency, National Environmental Research Center, Analytical Quality Control
Laboratory, Cincinnati, OH. Supporting data have been filed at ASTM International
Headquarters and may be obtained by requesting Research Report RR:D 19-1044.
Contact ASTM Customer Service at
FIG. 1 Test Method A, Chemical Oxygen Demand (COD) Precision of Determination as Overall Standard Deviation
4
D1252 − 06 (2012)´1
pure water were used rather than natural samples collected by
usual sampling procedures, the estimates do not include the
increase in precision statistics and the potential change in bias
that may be attributed to the sample collection activities.
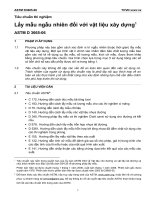
17.5 The trend of the approximately 5 % negative bias is
shown in Fig. 2.
17.6 Prepared Standards—Recoveries of known amounts of
COD in the series of prepared standards (previously described)
were as shown in Table 2.
FIG. 2 Test Method A, Chemical Oxygen Demand (COD) Bias of
Determinations
TABLE 2 Test Method A, Recovery and Precision Data
Prepared
COD, mg/L
Recovered
COD,
mg/L
Bias,
mg/L
% Bias
Statistically
Significant
12.30
40.2
92.0
270
12.34
37.9
88.6
257
+0.04
−2.3
−3.4
−13
+0.33
−5.7
−3.7
−4.8
no
yes
yes
yes
TEST METHOD B—MICRO COD BY SEALED DIGESTION AND SPECTROMETRY
18. Scope
18.1 This test method is essentially equivalent to Test
Method A, but it utilizes micro volumes of the same reagents
contained in a sealable ampule or a screw-top culture tube and
a spectrophotometer or filter photometer to measure absorbance or transmittance at selected wavelengths. This test
method is applicable where only small sample volumes are
available and where large numbers of samples need to be
analyzed. This test method requires less space per analysis and
uses less of the reagents, minimizing costs and volume of
wastes discharged.
19.3 After sealing, the ampule or tube is heated in an oven,
sand bath, or heated block at 150 6 2°C for 2 h. The COD
concentration is determined spectrophotometrically after digestion. In the low COD range (5 to approximately 50 mg/L),
the loss of hexavalent chromium is measured at 420 nm, while
for the high range (50 to approximately 800 mg/L), the
increase in trivalent chromium is measured at 600 nm. The
ampule or tube serves as the absorption cell.
18.2 This test method was tested on Type II reagent water.
It is the user’s responsibility to ensure the validity of this test
method for waters of untested matrices.
20.1 Interferences identified in Section 6 are also applicable
to the micro procedure.
20. Interferences
20.2 Volatile materials will be lost if the sample is mixed
with the reagents before the ampule or tube is sealed. Volatile
materials will also be lost during sample homogenization.
19. Summary of Test Method
19.1 The dichromate reagent and silver catalyst used in this
test method are similar to those used in Test Method A, but the
volumes employed are 1⁄20 th of those in Test Method A.
20.3 Potentially, the loss of volatile organics in the micro
procedure will be less than that which may occur in Test
Method A. Thus, results between the two methods may differ if
volatile materials are involved.
19.2 A sample aliquot is introduced carefully into an ampule
or screw-top tube so that the sample is layered on top of
previously introduced reagents and remains there until the
ampule or tube is sealed. This technique limits evolution of
heat of solution until the container is sealed, minimizing the
loss of volatile organics.
20.4 Spectrophotometric interferences may exist due to
turbidity of precipitated salts that are too colloidal to settle in
a reasonable period of time. Centrifugation may be used to
speed separation of the salts. This test method does not address
5
D1252 − 06 (2012)´1
sulfate (HgSO4) to about 750 mL of water, mix, and let cool.
Dilute the solution to 1 L with water and mix thoroughly.
22.3.2 Low Range—Add 1.022 g of potassium dichromate,
(K2Cr2O7) (dried at 103°C for 2 h), 167 mL of concentrated
sulfuric acid (H2SO4) (sp gr 1.84) and 33.3 g of mercuric
sulfate (HgSO4) to about 750 mL of water, mix, and cool.
Dilute the solution to 1 L with water and mix thoroughly.
a titration procedure for the micro-volume, but if the digested
samples do not clear or spectrophotometric interference is
suspected, the COD result can be determined by titration.6
20.5 The ampule or tube must have window areas that are
free of scratches or smudges. If a suitable window area is not
available, do not consider transfer of the sample. The sample
and the blank may be titrated and the results used to calculate
a COD value (see 24.10).
22.4 Ferrous Ammonium Sulfate Solution (0.10 N)—Dilute
400 mL of 0.25 N ferrous ammonium sulfate solution (see 14.1
to 1 L. Standardize against 0.25 N potassium dichromate
(K2Cr2O7) as in 14.1.
21. Apparatus
21.1 Spectrophotometer or Filter Photometer, suitable for
measurements at 600 nm and 420 nm using the ampules or
tubes in 21.3 or 21.3.1 as absorption cells. Filter photometers
and photometric practices shall conform to Practice E60.
Spectrophotometers shall conform to Practice E275. For some
spectrophotometers, poor sensitivity at 420 nm has been
observed. A suggested minimum sensitivity for the spectrophotometer readout is 0.002 absorbance units per milligram per
litre of COD for the low range procedure.
22.5 Ferrous Ammonium Sulfate Solution (0.01 N)—Dilute
40 mL of 0.25 N ferrous ammonium sulfate solution (see 14.1)
to 1 L. Standardize against 0.025 N potassium dichromate
(K2Cr2O7) as in 14.1.
22.6 Phenanthroline Ferrous Sulfate Indicator Solution—
See 14.4. If desired, the indicator may be diluted 1:5 for use in
this test method.
23. Calibration
21.2 Heating Oven, sand bath, or block heater capable of
maintaining a temperature of 150 6 2°C throughout. If an oven
is used and screw-top tubes are employed, ascertain that the
caps can withstand the oven temperature and solution pressure.
The heating device must be equipped with a high temperature
shut-off set at 175 to 185°C.
23.1 High Range—Dilute the following volumes of COD
standard solution (see 22.2) to 50 mL with water. The high
range procedure may be used for COD determination as low as
25 mg/L at the discretion of the analyst.
Potassium Acid Phthalate
Standard Solution, mL
2.5
5
10
20
30
40
21.3 Culture Tubes, borosilicate glass, 16 by 100 mm, with
TFE-fluorocarbon-lined screw caps. Protect the caps and culture tubes from dust contamination.
21.3.1 Ampules, borosilicate glass, 10 mL, may be substituted for the culture tubes in 21.3. These ampules are rotated
and uniformly sealed with a glass blowing torch after addition
of sample and reagent solutions. The nominal path length of
these ampules shall be 15 to 20 mm.
COD, mg/L
50
100
200
400
600
800
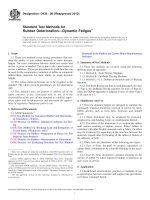
NOTE 5—A typical COD calibration curve for spectrophotometric COD
method, ampule technique (Test Method B) is shown in Fig. 3.
23.2 Low Range—Dilute the following volumes of potassium acid phthalate standard solution to 200 mL with water. At
the discretion of the analyst, the upper limit may be extended
to approximately 150 mg/L.
21.4 Apparatus for Blending or Homogenizing Samples—A
tissue homogenizer is recommended. However, a household
blender may be used, but a suitable reduction in particle size
may not be obtained.
Potassium Acid Phthalate
Standard Solution, mL
1
2
4
6
8
10
NOTE 4—A partial round robin, using cellulose filter paper as the
organic material, demonstrated serious difficulties in achieving a representative subsample. The use of a blender followed by a tissue homogenizer was required.
22. Reagents
COD, mg/L
5
10
20
30
40
50
22.1 Silver Sulfate Catalyst Solution—Dissolve 22 g of
silver sulfate (Ag2SO4) in a 4.09 kg (9 lb) bottle of concentrated sulfuric acid (H2SO4).
22.2 Potassium Acid Phthalate Solution, Standard (1
mL = 1 mg/L)—See 14.5.
22.3 Potassium Dichromate Digestion Solution:
22.3.1 High Range—Add 10.216 g of potassium dichromate
(K2Cr2O7) dried at 103°C for 2 h, 167 mL of concentrated
sulfuric acid (H2SO4) (sp gr 1.84) and 33.3 g of mercuric
6
Messenger, A. L., “Comparison of Sealed Digestion Chamber and Standard
Method COD Tests,” Journal Water Pollution Control Federation, Vol 53, No. 2,
February 1981, pp. 232–236.
FIG. 3 Typical COD Calibration Curve for Spectrophotometric
COD Method, Ampule Technique (Test Method B)
6
D1252 − 06 (2012)´1
24.7 Allow the ampules or tubes to cool at room temperature. After about 5 min, mix the contents of the ampule or tube
thoroughly (to mix condensed water into the solution).
Thereafter, permit the solution to cool and permit precipitated
solids to settle (normally about 30 min). Rapid cooling will
generate colloidal precipitates that are difficult to settle.
23.3 Use the procedure in Section 24 to analyze the prepared standard solutions and a procedural blank of water. For
the high COD range, determine the spectrophotometric absorbance of each standard and blank at a wavelength of 600 nm.
For the low COD range, determine the spectrophotometric
absorbance of each standard and blank at a wavelength of 420
nm. Since the change in absorbance for the low range is
negative with increasing COD, it may be convenient to read the
blank and standards against water and plot the absorbance
difference versus COD concentration.
24.8 Make spectrophotometric readings using the ampules
or culture tubes as the absorption cells. Transfer of cooled
solution should not be considered because the solution is
supersaturated and solids will precipitate that are difficult to
settle.
23.4 Prepare calibration curves for each range by plotting
the absorbance of each standard on the abscissa and milligrams
per litre of COD on the ordinate. For the low range procedure,
the correlation will have a negative slope; for the high range
procedure, the slope is positive.
24.9 Measure the absorbance of the low range solutions at
420 nm and the high range solutions at 600 nm. (See Note 3.)
24.10 Precision and bias in this test method has not addressed a titration procedure for the micro-volume, but if a
spectrophotometric interference is suspected because of turbidity or possibly high results, the result may be checked by
titrating the suspected sample and the blank. Add one drop of
phenanthroline ferrous sulfate solution (22.6), and titrate to the
color change with 0.1 N ferrous ammonium sulfate solution
(22.4) for high range samples or with 0.01 N ferrous ammonium sulfate solution (22.5) for low range samples. Follow the
same procedure with the procedural blank. The titrant volume
for the blank will be about 3 mL. If this volume is not available
in the ampule or tube, the digested sample must be transferred
to a container of suitable volume for titration. Calculate the
COD using the equation in Test Method A (16.1).
24. Procedure
24.1 Place 1.5 mL of digestion solution (22.3.1 for the high
range procedure or 22.3.2 for the low range procedure) in a
culture tube (21.3) or glass ampule (21.3.1).
NOTE 6—Accurate addition of the digestion volume in the low range
procedure is important because the loss of hexavalent chromium is
measured.
24.2 Add 3.5 mL of silver sulfate catalyst solution (22.1),
mix, and allow to cool. If the mixed reagents are to be stored,
store the sealed or capped solution in the dark.
NOTE 7—Several manufacturers offer similar catalyst and digestion
solutions already combined in ampules or culture tubes. If the commercial
preparations are used, the manufacturers’ directions as to sample size
should be followed. The analyst should visually inspect any purchased
system to determine that reagent volumes are uniform and should develop
calibration curves to confirm or replace precalibrated readouts.
25. Calculation
25.1 Determine the COD value directly from the respec-tive
calibration curves constructed for the purpose. See Section 23.
25.1.1 If the sample was prediluted, apply the appropriate
dilution factor to the result.
24.3 Homogenize the sample if necessary.
24.4 Carefully add 2.5 mL of the sample, standard, or blank
down the side of the tube or ampule so that a layer is formed
on top of the reagents. Cap the tubes or seal the ampules.
25.2 Report all results in milligrams per litre.
24.5 Mix the sealed ampules or tubes thoroughly. It is
feasible to mix tubes by holding the tube by the cap and
shaking vigorously. Complete integrity of the TFEfluorocarbon liner in the screw cap is imperative. The ampule
or tube will become hot because of heat of solution.
(Warning— If handling the ampule or tube directly, use
insulated gloves, or place the ampules or tubes in a rack for
mixing. Use normal laboratory precautions for possible contact
with the hot, corrosive reagents from broken ampules or tubes.)
26. Precision and Bias7
26.1 Precision and bias information was developed in a
collaborative test by seven laboratories with Type II water. For
other matrices, these data may not apply. Each prepared sample
was analyzed on three different days by the same operator in
each laboratory.
26.2 Test samples were prepared by dissolving weighed
amounts of potassium acid phthalate in Type II water. Four sets
of samples, two sets for the low COD range and two sets for
the high COD range, were submitted to the laboratories.
24.6 After mixing, place the ampules or tubes in an oven or
heating device at 150 6 2°C for 2 h.
26.3 The laboratories followed instructions to dilute one
sample set in each range with Type II water. The resulting
dilutions provided concentrations of 5, 12, 27, and 45 mg/L
COD in the low range and 27, 90, 350, and 750 mg/L in the
high range.
TABLE 3 Test Method B, Recovery, Precision and Bias for Low
Range, Type II Water
Amount
Added,
mg/L
Amount
Recovered,
mg/L
Standard
Deviation,
mg/L
Bias,
±%
Statistical
Significance
(95% confidence level)
5
12
27
45
6.76
13.10
26.10
43.91
4.02
3.37
2.86
3.69
+35
+9
−5
−2
no
no
no
no
7
Supporting data have been filed at ASTM International Headquarters and may
be obtained by requesting Research Report RR:D19-1044. Contact ASTM Customer
Service at
7
D1252 − 06 (2012)´1
TABLE 4 Test Method B, Recovery, Precision and Bias for Low
Range, Type II Water plus 1000 mg/L Chloride Ion
26.4 The other set of samples in each range was diluted with
Type II water plus 1000 mg/L of chloride ion to provide the
same COD concentrations in the low and high ranges as
identified in 26.3.
26.5 Recovery, overall precision, and bias results for the
low range samples, Type II water, are presented in Table 3 and
are shown in Fig. 4.
26.6 Recovery, overall precision, and bias results for the
low range samples, Type II water plus 1000 mg/L of chloride
ion, are presented in Table 4 and are illustrated in Fig. 5.
Amount
Added,
mg/L
Amount
Recovered,
mg/L
Standard
Deviation,
mg/L
Bias,
±%
Statistical
Significance
(95 % confidence level
5
12
27
45
9.33
17.39
28.65
44.56
8.15
7.89
5.23
8.02
+87
+45
+6
−1
yes
yes
no
no
26.7 Recovery, overall precision, and bias results for the
high range samples, Type II water, are presented in Table 5 and
are illustrated in Fig. 6.
26.8 Recovery, overall precision, and bias results for the
high range samples, Type II water plus 1000 mg/L of chloride
ion, are presented in Table 6 and are illustrated in Fig. 7.
26.9 The higher positive bias and lower precision at lower
concentrations of COD in the presence of chloride ion is not
fully understood. All of the bias may not be the result of
oxidation of chloride ion to chlorine. Laboratories identified
problems with turbidity, but turbidity causes a negative bias in
the low range procedure. A secondary source of positive bias
may have been organic material adsorbed from laboratory
atmosphere on the sodium chloride added to the dilution water.
26.10 The negative bias in results at the 750 mg/L concentration may have been partially a result of incomplete transfer
of the sample from the shipment bottle to the prepared dilution.
When refrigerated, the potassium acid phthalate, at the shipped
concentration, was observed to crystallize from solution on the
surface of the sample bottle. Laboratories were notified of the
problem.
FIG. 5 Test Method B, Correlation of Collaborative Data COD Determination by Micro Procedure Type II Water Plus 1000 mg/L
Chloride Ion
TABLE 5 Test Method B, Recovery, Precision and Bias for High
Range, Type II Water
Amount
Added,
mg/L
Amount
Recovered,
mg/L
Standard
Deviation,
mg/L
Bias,
±%
Statistical
Significance
(95 % confidence level)
27
90
350
750
26.61
92.00
329.00
736.07
4.55
23.13
44.15
20.11
−1
+2
−6
−2
no
no
no
yes
27. Quality Control (QC)
27.1 Introduction:
27.1.1 In order to be certain that analytical values obtained
using this test method are valid and accurate within the
confidence limits of the test, the following QC procedures must
be followed when running the test.
27.1.2 The samples are always performed in a batch that
consists of a set of samples accompanied by control samples.
Batches must be sized such that the control samples in the
batch can be assured to be indicative of the variables affecting
the remaining samples in the batch. All variables affecting the
batch must affect all samples in the batch in a statistically
FIG. 4 Test Method B, Correlation of Collaborative Test Data
COD Determination by Micro Procedure Type II Water
8
D1252 − 06 (2012)´1
FIG. 6 Test Method B, Correlation of Collaborative Test Data
COD Determination by Micro Procedure Type II Water
TABLE 6 Test Method B, Recovery, Precision and Bias for High
Range, Type II Water plus 1000 mg/L Chloride Ion
Amount
Added,
mg/L
Amount
Recovered,
mg/L
Standard
Deviation,
mg/L
Bias,
±%
Statistical
Significance
(95 % confidence level)
27
90
350
750
42.06
92.83
331.44
686.89
7.76
14.18
52.56
104.00
+56
+3
−5
−8
yes
no
no
yes
27.2.2 Standardization—For Test Method A:
27.2.2.1 Ferrous Ammonium sulfate Solution titrant ( 14.1)
must be re-standardized with each batch of samples analyzed.
The batch must be completed with one preparation of titrant.
27.2.3 Independent Reference Material (IRM):
27.2.3.1 Analyze a certified reference material following the
preparation of stock solutions used to prepare calibration
standards. These results will verify the accuracy of the calibration standards.
equivalent manner. The maximum size of a batch is determined
by identifying the key variables affecting the batch and
assuring that these variables do not vary significantly during a
batch. If batch sizes are too large, the user runs the risk of
inappropriately rejecting portions of a batch. If batch sizes are
too small, the cost of control sample analysis becomes higher.
27.1.3 In addition to other factors limiting batch size indicated in this section, the following variables must remain
constant during a batch: analyst, instrument, and day. Recommended maximum batch sizes are specified in the table below:
Batch type
Method A
Method B
27.3 Initial Demonstration of Laboratory Capability—
27.3.1 An initial demonstration of capability must be performed if a laboratory has not performed the test before or
reperformed if either the instrument or analyst changes to
assure that results equivalent to those obtained in the method
collaborative study can be achieved.
27.3.2 For Test Method A and Test Method B, high range,
prepare a 100 mg/L standard of primary grade potassium acid
phthalate (as in 23.3). For method B, low range, prepare a 30
mg/L standard (as in 23.2). Analyze seven replicates of the
appropriate standard.
27.3.3 Calculate the mean and standard deviation of the
seven values and compare to the acceptable ranges of precision
and bias in the following table. The demonstration must be
Maximum batch size
20
50
27.2 Calibration and Calibration Verification:
27.2.1 Instrument—For Test Method B:
27.2.1.1 A calibration curve must be prepared with each
batch of samples as specified in Section 23. The calibration
standards must be digested with the samples in the batch.
27.2.1.2 Calibration must be verified at the end of the batch
by checking a mid-range standard. The measured COD must be
within 10 % of the rated value of the standard.
27.2.1.3 If the calibration check fails, check for and resolve
any spectrophotometer problems. Recalibrate the spectrophotometer and re-measure the absorbance of the ampules or
tubes.
9
D1252 − 06 (2012)´1
FIG. 7 Test Method B, Correlation of Collaborative Test Data
COD Determination by Micro Procedure Type II Water Plus 1000
mg/L Chloride Ion
27.5 Method Blank (Blank):
27.5.1 Test Method A, the amount of titrant needed for the
blank is subtracted (blank correction). Analysts should monitor
the amount of titrant used for blanks. Any significant change
should be investigated.
27.5.2 For Test Method B, the method blank is used as the
“zero” concentration point on the calibration curve. Since the
calibration standards are taken through the entire analytical
process, any absorbance due to blank levels is automatically
subtracted. Analysts should monitor the absorbance of the
blank against distilled water, especially when a new lot of
reagents is used. Any significant increase in blank absorbance
should be investigated.
repeated until the single operator precision and the mean
recovery are with the limits given.
Method/Level
Method A (100 mg/L)
Method B, High Range (100 mg/L)
Method B, Low Range (30 mg/L)
Acceptable range Acceptable range
of recovery
of precision
86–106 mg/L
<6.9 mg/L
69–135 mg/L
<20 mg/L
23–37 mg/L
<5 mg/L
27.3.3.1 If a concentration other than that specified above is
used for laboratory capability testing, refer to D5847 for
information on applying the F test and t test in evaluating the
acceptability of the mean and standard deviation.
27.4 Laboratory Control Sample (LCS):
27.4.1 To insure that the performance of the test method is
in control, one LCS must be analyzed with each batch of
samples to assure continued performance within the limits
established by the method collaborative testing.
27.4.2 The LCS will be the same material and concentration
used for the initial demonstration of capability and must be
taken through all of the steps of the analytical method,
including preservation and pretreatment. The result obtained
for the LCS must fall within the limits in the table below.
Batch type
Method A
Method B, high range
Method B, low range
27.6 Sample Spiking and Replicates:
27.6.1 Spiking:
27.6.1.1 Chemical Oxygen Demand is a composite, procedurally defined analyte. Recovery of constituents is a composite function of the recoveries of each compound present. For
this reason, spiking a sample with a pure material with an
experimental COD does not reveal anything about the absolute
level of recovery of the constituents in the original sample.
Comparison of matrix specific results across various oxygen
demand methods and calculations of theoretical COD from
constituent analysis may reveal the presence of refractory
compounds.
27.6.2 Replicates:
27.6.2.1 It is the responsibility of the method user to assure
that reported results are of known and acceptable precision.
Replicates by matrix and level should be run to establish real
world sample precision. This should be done by running
duplicates in numerous batches and combining the data to
obtain a precision estimate. The collaborative study precision
data can be used as a benchmark for these results. If the relative
LCS acceptance range
100 mg/L ± 12 mg/L
100 mg/L ± 30 mg/L
30 mg/L ± 8 mg/L
27.4.3 If the result does not fall within these limits, analysis
of samples is halted until the problem is corrected, and either
all samples in the batch must be re-analyzed, or the results
must be qualified with an indication that the method was not
performing within acceptance criteria.
10
D1252 − 06 (2012)´1
27.7.3 After performance of the method has been validated
through the initial demonstration of capability, collect 20 to 30
pairs of BCS data. Construct Shewhart control charts for
precision (range chart) and recovery (X-bar chart). Any outof-control conditions on a BCS should be investigated and the
batch re-analyzed. Up-dating of these control chart limits
should never cause the control limits to broaden without
sufficient cause.
27.7.4 Once these control charts have been established, they
can replace the regular use of the Laboratory Control Sample.
The LCS should still be run periodically to assure compliance
with the control limits established in the method.
standard deviation of the real world sample results is significantly larger than that from the collaborative study, the results
should be annotated for end users.
27.7 Batch Control Sample (BCS):
27.7.1 It is strongly recommended that a challenging control
standard be run in duplicate – beginning and end – in each
batch. This material is intended to be responsive to critical
performance factors of the method, specifically, chloride interference and catalyst effectiveness.
27.7.2 This BCS should be made to have approximately the
same COD levels as used in the initial demonstration of
capability. 100 % of the COD should come from high purity
acetic acid. In addition, the BCS should have 1000 mg/L
background chloride level.
27.7.2.1 Alternatively, diluted substitute wastewater
(D5905), spiked with acetic acid may be used as the BCS. In
either case, it is vital that the BCS can be made up routinely
and reproducibly.
28. Keywords
28.1 chemical oxygen demand; COD; demand; oxygen
demand
APPENDIX
(Nonmandatory Information)
X1. PRETREATMENT OF WASTEWATER SAMPLES
The COD digestion vial can be placed in a small Erlenmeyer
flask on an analytical balance. This sample will be used for
blank correction.
X1.1 Chloride can cause a positive interference when determining the chemical oxygen demand of wastewater samples.
Samples with chloride levels up to 4 % can be treated with a
styrene based cation exchange resin in the silver form with a
capacity of 4.5 meq for the removal of chloride, bromide, and
iodide. The pretreatment described in this appendix was not
evaluated during the interlaboratory study; therefore, the user
of this procedure is responsible for determining the actual
precision and bias for each particular sample type. The treated
samples are analyzed by Test Method D1252 as described in
Test Method B, Micro COD Procedure. The reported result
should be designated as “dissolved COD” since the sample
must be filtered during the pretreatment.
X1.2.4 A small amount of each sample (5 mL) should be
used to purge the pre-rinsed filters. Each neutralized sample
should be treated as in X1.2.3.
X1.2.5 Prepare the calibration standards in 1 wt. percent
sodium chloride (10 g NaCl per liter of reagent water) at the
COD concentration levels in this standard.
X1.2.6 Digest the samples and standards as directed in Test
Method B of this standard.
X1.3 Discussion
X1.2 Procedure
X1.2.1 Due to the silver contained in the cation exchange
resin filters, samples need to be neutralized prior to filtration to
prevent leaching, which may interfere with the analysis. Since
sulfuric acid is the common preservative a NaOH solution can
be used for neutralization. If the preserved samples are highly
acidic, a more concentrated NaOH solution can be used thus
preventing dilution of the sample.
X1.2.2 Rinse the cation exchange resin filter by drawing 10
mL of reagent water into a disposable syringe and placing the
filter on the end of the syringe. Displace the deionized water
through the filter into a waste container. Each filter will have to
be rinsed with reagent water prior to filtering a sample.
X1.2.3 Weigh 2 g of reagent water through a prerinsed
cation exchange resin filter directly into a COD digestion vial.
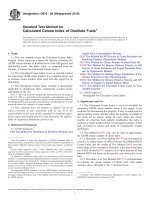
X1.3.1 The supporting data were obtained from a single
laboratory and were not evaluated according to Practice
D2777. The data contained in Table X1.1,Table X1.2, and Fig.
X1.1 show the analytical results for COD using the procedure
in this appendix. The data present the percent recovery of KHP
at 20 mg/L and 100 mg/L at various levels of chloride.
TABLE X1.1 Single Laboratory Evaluation, Chloride
Concentration versus Spike Recoveries
Chloride Concentration
(mg/L)
3035
12 140
18 210
24 280
36 420
11
20 mg/L KHP,
COD Recovery (%)
96
84
111
114
106
100 mg/L KHP,
COD Recovery (%)
106
99
104
100
104
D1252 − 06 (2012)´1
TABLE X1.2 Single Laboratory Duplicates
KHP Spiked Salt Solutions
100 mg/L KHP in 5000 ppm NaCl
COD Result (mg/L)
106.7
110
24.5
24.8
106.3
106.7
24.5
26
102
102
20 mg/L KHP in 30 000 ppm NaCl
100 mg/L KHP in 30 000 ppm NaCl
20 mg/L KHP in 40 000 ppm NaCl
100 mg/L KHP in 40 000 ppm NaCl
A
RPDA
3.0
1.2
0.4
5.9
0.0
RPD=Relative percent difference.
FIG. X1.1 Chloride Concentration versus Spike Recoveries
ASTM International takes no position respecting the validity of any patent rights asserted in connection with any item mentioned
in this standard. Users of this standard are expressly advised that determination of the validity of any such patent rights, and the risk
of infringement of such rights, are entirely their own responsibility.
This standard is subject to revision at any time by the responsible technical committee and must be reviewed every five years and
if not revised, either reapproved or withdrawn. Your comments are invited either for revision of this standard or for additional standards
and should be addressed to ASTM International Headquarters. Your comments will receive careful consideration at a meeting of the
responsible technical committee, which you may attend. If you feel that your comments have not received a fair hearing you should
make your views known to the ASTM Committee on Standards, at the address shown below.
This standard is copyrighted by ASTM International, 100 Barr Harbor Drive, PO Box C700, West Conshohocken, PA 19428-2959,
United States. Individual reprints (single or multiple copies) of this standard may be obtained by contacting ASTM at the above
address or at 610-832-9585 (phone), 610-832-9555 (fax), or (e-mail); or through the ASTM website
(www.astm.org). Permission rights to photocopy the standard may also be secured from the Copyright Clearance Center, 222
Rosewood Drive, Danvers, MA 01923, Tel: (978) 646-2600; />
12