sec petrochemical eng
Bạn đang xem bản rút gọn của tài liệu. Xem và tải ngay bản đầy đủ của tài liệu tại đây (4.51 MB, 57 trang )
Disseminated Document
A Study on Energy Efficiency Index in
Petrochemical Industry
LOGO
AStd E Effii Id i
Disseminated Document
A
St
u
d
y on
E
nergy
Effi
c
i
ency
I
n
d
ex
i
n
Petrochemical Industry
DepartmentofAlternativeEnergyDevelopmentandEfficiency(DEDE)
AStudyonEnergyEfficienc yIndexinPetrochemicalIndustry
Petrochemical Industry is one of the most important primary industries to
Thailand’seconomicdevelopment.Itisthefoundationofwidevarietyof industrial production
processes such as plastic and container industry, textile industry, rubber industry, agricultural
and fertilizer industry.These industries help create tremendous value added to Thailand
exporting sector.In 2006, the exporting values of upstream, intermediate and downstream
petrochemicalproductsare27,694,41,729 and 15,1468millionBaht,respectively.Inaddition,
the country also savesmillions of bath peryearon importing goods.The utilization of natural
gasintheprocessisalsoarightdirectiononincreasethevalueoflocallyavailablerawmaterial
which, in turn, benefit to Thai’s economy and society as a whole.Continued expansion of this
industrialsectorisforeseeableinthefuture.
Production process of petrochemical industry is considered one of the most energy
intensiveoperations.Duetoincreaseenergyconsumptiontrendofthisindustryandtocorrectly
accommodate the future economic expansion, it is important to facilitate this industry to
efficientenergymanagementinitiativesin orderto optimizethewholeprocesswhilemaximize
thebenefit.Inadditiontothegainfromenergyconservationandhigherenergyefficiency,this
willenhancethecapabilityofthe industrytocompeteonthe globalscale.Fromthese reasons,
the Department of Alternative Energy Development and Efficiency (DEDE), a responsible
governmental body who oversee the industrial energy management, considers this important
strategy and duty to promote the increase in energy efficiency of petrochemical industry. The
activitieswillbecarriedoutundertheEnergyConservationandPromotionActsof1992.
One strategy which the Department of Alternative Energy Development and Efficiency
has been executed to urge the industry about the energy efficiency is the analysis of energy
usage per production unit (Energy Index, EI).Hence it is DEDE’s initiative to develop Energy
Consumption of Petrochemical Industry in Thailand project to use the energy consumption
data of this industry as a step to develop energy benchmarking standard. Moreover, the
acquired information may be evaluated for preparation of energy efficiency index and energy
conservation of each manufacturer. Finally, the outcome of this project may lead to the right
directionondefiningtheappropriatefutureplanforenergyconservationplanofpetrochemical
industry.
Thisreport istodistributetheresultofthisprojectwhichincludestheanalysisofenergy
consumption index of petrochemical industry, approach on promotional plan for energy
conservation, and techniques for efficient energy usages. Authors hope that this report will
furtherbemoreorlessusefultostakeholdersandanyinvolved parties.
PREFACE
DepartmentofAlternativeEnergyDevelopmentandEfficiency(DEDE)
AStudyonEnergyEfficienc yIndexinPetrochemicalIndustry
CONTENT
PREFACE
CHAPTER 1: OVERVIEWOFTHAILANDPETROCHEMICALINDUSTRY 1
1.1ThePetrochemicalIndustryStructure
1
1.2TypesofPetrochemicalIndustry
4
1.3PetrochemicalFeedstock
6
1.4HowPetrochemicalIndustryAffectsEconomicSystem
7
1.5EnergyConsumptionofPetrochemicalIndustryinThailand
12
CHAPTER 2 :ENERGYCLASSIFICATIONOFPETROCHEMICALINDUSTRY 14
2.1ClassificationofPetrochemicalIndustry
14
2.2ProductionProcesses
15
CHAPTER3:ENERGYCONSUMPTIONINPETROCHEMICALINDUSTRY 22
3.1EnergyConsumptionIndex
22
3.2SpecificEnergyConsumption(SEC)
23
3.3 EvaluationofEnergyIntensity(EI)
29
CHAPTER 4:THEPROMOTIONOFENERGYCONSERVATION 31
4.1ProblemsinPetrochemicalIndustry
31
4.2SWOTAnalysis
32
4.3PromotionalPlanforEnergyConservationInThePetrochemical
33
CHAPTER5:TECHNOLOGYANDMEASURESFORENERGYCONSERVATIONIN
PETROCHEMICALINDUSTRY
36
5.1DevelopmentandImprovementofProductionTechnology
36
5.2EnergyEfficiencyImprovementforProcessesandEquipments
40
SUMMARY 48
REFERENCES 50
LISTOFABBREVIATION 52
pro
d
1.1
refi
n
che
m
oil
ad
m
pur
p
pet
r
pro
d
pet
r
Petroc
h
d
uctssucha
s
ThePet
r
Whilet
h
n
ingindustr
y
m
icalprodu
c
themselves.
m
inistrations
p
ose of th
e
r
ochemical
p
d
ucing a h
o
r
ochemicali
n
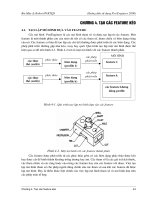
Source:
P
Figure1
2
4
6
8
1
0
1
2
1
4
1
6
1
8
Production(KTA)
De
h
emicals
r
e
s
crudeoil,
n
r
ochemic
a
h
epetroche
m
y
inthatitu
c
ts.Genera
Even th
o
fortheirre
f
e
oil indu
s
p
roducts as
o
st of che
m
n
dustryfro
m
P
TIT,2007
Production
14,2
5
‐
2
,000
4
,000
6
,000
8
,000
0
,000
2
,000
4
,000
6
,000
8
,000
T
o
I
n
partmentof
A
e
fer to hyd
r
n
aturalgasa
a
lIndustr
y
m
icalindus
t
sessomepr
lly,compani
o
ugh there
f
ineryandt
h
s
try busine
s
their by‐pr
o
m
ical produ
m
2003to20
0
ofThailand’
39
5
,707
2,597
5,935
2003
o
talProducti
o
n
termediateP
1.OVER
V
A
lternativeE
n
A
St u dy
r
ocarbon or
g
ndnaturalg
y
Structu
r
t
ryisparto
f
oductsfro
m
es which pr
are some
h
eirpetroch
e
s
s is to pr
o
ducts.Me
a
cts, as sh
o
0
6.
spetroche
m
15,034
5,887
2,81
8
6
,
2004
o
n
etrochemical
V
IEWO
F
n
ergyDevelo
p
onEnergyEff
i
g
anic chem
i
ascondensa
r
e
f
thechemic
a
m
theoilrefi
n
o
duce petr
o
which do
s
e
micalprod
u
o
duce ene
r
a
nwhile, the
o
wn in Fig
u
m
icalindustr
y
15,66
0
6,
2
8
,
329
2
Year
U
s
D
F
PETRO
C
p
mentandEff
i
i
ciencyInde
x
i
n
i
cals produ
c
tesasraw
m
a
lindustry,
i
n
eryasraw
o
chemicalpr
s
o, they w
o
u
ction.Ino
t
r
gy, getting
petrochem
u
re 1 prod
u
y
fromyear
2
0
1
2
19
3,004
6,436
2
005
U
pstreamPet
r
D
ownstream
P
C
HEMIC
A
iciency(DED
E
n
Petrochemic
a
c
ed using p
e
m
aterials.
i
tdiffersfro
m
materialsfo
oducts do n
ould have
t
herwords,
t
raw mat
e
ical industr
y
u
ction of T
2
003to200
6
6,372
5,945
3,891
6,5
3
2006
r
ochemicals
P
etrochemica
l
A
LINDU
S
E
)
a
lIndustry
e
troleum
m
theoil
rspecific
otrefine
separate
t
hemain
rials for
y
aims at
hailand’s
6
.
3
6
l
s
S
TRY
1
DepartmentofAlternativeEnergyDevelopmentandEfficiency(DEDE)
AStudyonEnergyEfficienc yIndexinPetrochemicalIndustry
2
In general, the petrochemical industry uses raw materials from the petroleum industry
to manufacture products such as plastic resins, synthetic fibers, synthetic rubbers, surface
coating materials and various types of adhesives.These products are considered primary raw
materials for human beings’ basic consumption items, occupational tools and equipment, and
various amenities
for mankind.Figure 2 shows the links between the petroleum industry and
petrochemicalindustry;Figure3showsthestructureofThailand’spetrochemicalindustry.
Figure2Thailandpetroleumandpetrochemicalne twork
S
o
o
urce: PTIT, 2
0
De
0
06
partmentof
A
Figure 3 Th
A
lternativeE
n
A
St u dy
ailand petroc
h
n
ergyDevelo
p
onEnergyEff
i
h
emical com
p
p
mentandEff
i
i
ciencyInde
x
i
n
p
lex flows
iciency(DED
E
n
Petrochemic
a
E
)
a
lIndustry
3
DepartmentofAlternativeEnergyDevelopmentandEfficiency(DEDE)
AStudyonEnergyEfficienc yIndexinPetrochemicalIndustry
4
1.2TypesofPetrochemicalIndustry
The petrochemical industry is classified into 3 main groups, on the basis of their
products(asshowninFigure4).
UpstreamPetrochemicalIndustry
IntermediatePetrochemicalIndustry
DownstreamPetrochemicalIndustry
Figure4OverviewofThailandpetrochemicalindustry
1.2.1UpstreamPetrochemicalIndustry
Upstreampetrochemicalindustryisthe productionofpetrochemicalproductswhich are
feedstock for further production of other petrochemical products (intermediate and
downstream).Itconsists of 7 kinds of products, or “the Seven Sisters”, which are divided into
thefollowing3groupsonthebasisoftheirmolecularstructure:
Alkanegroup,which is methane‐based
Olefingroup,whichisethylene‐based,propylene‐basedandMixedC
4
‐based
Aromaticgroup,whichisbenzene‐based,toluene‐basedand xylene‐based
Supporting: Infrastructure, Logistic, HR, Finance, Rules& Regulations
Valuechain
component
Key
activities
• E&P
• Oil
Refinery
• Gas
separation
• Olefins
- Ethylene
- Propylene
• Aromatics
- Benzene
- Para-
Xylene
• Plastic Resins
Commodity
(PE, PP, PVC, PS, EPS,
PET)
Engineering
(PC, POM, PBT*, Nylon
6,6*, PMMA)
Synthetic Fibre
- Polyester
- Nylon 6
- Polypropylene
- Acrylic
Syn. Rubber/
Elastomers
- BR, SBR, EPDM*
Syn. Coating/
Adhesives
- PVA*, Silicone
• Compounding
• Olefins
- EDC/VCM
- EO**/EG**
- Oxo Alcohol*
- Acrylonitrile*
• Aromatics
- Ethylbenzene**
- Styrene
- Cyclohexane**
- Caprolactam
- Cumene/Phenol**
- PTA
-PA
Conversion
Industries
Downstream
Intermediate
Upstream
Oil & Gas
Note:
* No local production,
** Investment in progress
DepartmentofAlternativeEnergyDevelopmentandEfficiency(DEDE)
ASt udy onEnergyEfficiencyIndexinPetrochemicalIndustry
5
1.2.2IntermediatePetrochemicalIndustry
Intermediatepetrochemicalindustryusesupstreampetrochemicalproductsasfeedstock
and supplies todownstream petrochemical industry.Its products are groupedon the basis of
theirupstreampetrochemicals,asfollows:
AlkaneIntermediates,namely, productsfromupstreammethane,suchasmethanolor
methylalcohol,formaldehyde,ammonia,phosgene,etc.
Olefin Intermediates, namely, ethylene products such as ethylene dichloride, (EDC),
vinyl chloride monomer (VCM), ethylene oxide (EO), and ethylene glycol (EG),
propyleneproductssuchasoxoalcohol andacrylonitrile
Aromatic Intermediates, namely, benzene products such as ethyl benzene (EB),
styrenemonomer(SM),cyclohexane,carprolactam,andparaxyleneproducts,etc.
1.2.3DownstreamPetrochemicalIndustry
Downstream petrochemical Industry uses upstream or intermediate petrochemical
productsasfeedstocktomanufacturedownstreamproductsorendproductspriortoconversion
inotherindustries.Theyarecategorizedbyendproduct,asfollows:
Plasticresins
SyntheticFibers
Syntheticrubbers
SyntheticcoatingandAdhesivematerials
ดิบสําหรับการผลิตอุตสาหกรรมปโตรเคมี
DepartmentofAlternativeEnergyDevelopmentandEfficiency(DEDE)
AStudyonEnergyEfficienc yIndexinPetrochemicalIndustry
6
1.3PetrochemicalFeedstock
Thereare2typesoffeedstockforthepetrochemicalindustry:naturalgasandnaphtha.
The selection of feedstock varies on the advantages and disadvantages in the access to the
feedstock,andthereforevariesfromonecountrytoanother.Forinstance,incountrieslikethe
USA,Canada,andtheMiddleEast,
productionofpetrochemicalsisfromnaturalgas,whereasin
Japan, Korea, Singapore, and Europe, which do not have natural gas, naphtha is used instead,
since it is sold in the world market and is easy to transport. In the case of Thailand, both are
used.Thetypeoffeedstockalso
determinesthe manufacturingprocessusedbymanufacturing
plants.Figure5showsfeedstocksourcesfortheindustry.
Figure5Petrochemicalfeedstock
Gas separation
Wetgas
Refinery
Crude oil
Condensate
Splitter
Condensate
Petrochemical
Feedstock
Refinedproducts
Petrochemical
Feedstock
Petrochemical
Feedstock
• Methane
• Ethane
• Propane‐Butane(LPG)
• NGL
• LPG
• Naphtha‐Gasoline
• GasOil–Kerosene,
Jet,Diesel
• FuelOil
• Bitumen
• Etc.
•
LPG
• Naphtha
• GasOil
•
LPG
• Naphtha
Drygas
Residue
DepartmentofAlternativeEnergyDevelopmentandEfficiency(DEDE)
ASt udy onEnergyEfficiencyIndexinPetrochemicalIndustry
7
1.4HowPetrochemicalIndustryAffectsEconomicSystem
1.4.1TheRoleofPetrochemicalIndustryinThailand
Thepetrochemicalindustrybringsintremendous,uninterruptedrevenuetothecountry
as show inTable 1.In year 2006, total revenue from petrochemicalindustry exceed447.760
millionBahtwhichisequivalentto6‐percentofgrossdomestic product(GDP).Moreover,the
industry also generates important raw materials for several downstream
industries such as
automachine,electricalandelectronics,cosmetics,agricultural,packagingandtextileindustries.
The petrochemical industry has a significant effect on the development of the country
directlyandindirectly.Notonlydoesitaddvaluetooilandnaturalgas,butitisalsorelatedto
numerousotherindustriesas
showninFigure6,forexample,packaging,spareparts,electronic
parts,textile,construction,etc
Table1ValuesofThailand’spetrochemicalproduction
Source:PTITFocus,2005
.
6.0%6.1%5.9%4.9%4.4%Compare to GDP
2.2%2.2%2.6%2.6%2.8%2.8%2.4%2.4%2.3%2.3%Compare to GDPCompare to GDP
160,257181,427182,829143,812128,458•Value Added of Petrochem. Ind.:
Exclude Import and Feedstocks
(MM Baht)
3.5%3.7%3.8%3.2%2.8%Compare to GDP
260,714264,231244,486188,578153,202•Net Revenue: Exclud e Import
Portion (MM Baht)
447,760432,645382,500290,150239,060• Total Revenue (MM Baht)
Petroche mical Status
7,423,918 7,104,2286,503,4885,928,9755,450,643GDP: Current Price (MM Bah t)
25492548254725462545
Note: B.E. 2549 estimate GDP growth 4.5%, FX = 38 Bath/$
2002 2003 2004 2005 2006
2006
DepartmentofAlternativeEnergyDevelopmentandEfficiency(DEDE)
AStudyonEnergyEfficienc yIndexinPetrochemicalIndustry
8
Source:PTITFocus,2005
Figure6 Downstreampetrochemicalproductionvalues
In addition to producing ample supplies for domestic demand, in 2005 the
petrochemicalindustryhadmorethan200,000millionBahtwo rthofsurplusoutputforexport,
or4.85percentofthecountry’sexportvalue.
DepartmentofAlternativeEnergyDevelopmentandEfficiency(DEDE)
ASt udy onEnergyEfficiencyIndexinPetrochemicalIndustry
9
Source:PTITFocus,2005
Figure7 valuesgeneratedbynaturalgasyear2005
Figure7showsthatthepetrochemicalindustry,whichuses only11.3percentofnatural
gas, generates as much revenue as 158,277 million Baht., whereas electricity industry, which
uses79.6percentofnaturalgas,generates 197,899millionBaht.Inotherwords,
revenuefrom
petrochemical industry is approximately 80 percent that of electricity generation, but
petrochemical industry uses only 14 percent of the volume of natural gas used in generating
electricity.This is the reason why Thailand must conduct a serious study and continue to
developpetrochemicalproducts.
Values Generated by Natural Gas – B.E. 2548
Incremental
values forgone
if indigenous
gas not used,
and import
fuel instead
Incre mental
values forgone
if indi genous
gas not used,
and import
fuel instead
4
1
4
,
8
2
8
6
6
,
4
0
0
1
8
3
,
6
7
6
Value lost
if import fuels
(1 94, 89 9 - 1 83,67 6 = 11 ,223
electricity - imported fuel = val ue add ed)
Value lost
if import fuels
(19 4, 899 - 18 3, 676 = 11, 22 3
electricity - impo rted f uel = val ue a dd ed )
Gas Used
790,080
MMSCF
(excl. LPG for feedstock)
Unit: Million Baht
• Industry Value
– Electricity
– E&P
– Petrochemical
–LPG
Gas Prod.
835,743
MMSCF
79.6%
100.0%
11.3%
9.1%
Direct
Financial
Benefit
Economic
Multiplier
194,899
230,749
- 100,576
(NG)
- 57,701
(Condensate)
25,802
9
9
9
9
• Government Take
– Income Tax - E&P 36,957
– Royalty - E&P 29,443
*
158,277
ValuesGeneratedbyNaturalGasYear2005
DepartmentofAlternativeEnergyDevelopmentandEfficiency(DEDE)
AStudyonEnergyEfficienc yIndexinPetrochemicalIndustry
10
1.4.2PetrochemicalProduction
1) Production
• ProductionCapacity
In 2006 production capacity of Thailand’s petrochemical industry was
19,000,000tons,comprising6.5milliontonsupstreamproducts,4.5million tonsofintermediate
products,and8.0milliontonsofdownstreamproducts,asshowninFigure 8.Itcanbeseenthat
theindustryhascontinuouslyexpandedfromyear2002
onward,withatotalof4.0milliontons
growthbetweenyears2002and2006.
Figure8Thailandpetrochemicalproductioncapacity
• ProductionandProductionRate
Thailand produced nearly 16,000,000 tons of petrochemical products in 2005
and was then expecting more than 16,000,000 tons for 2006 (Figure 9).In downstream
industries,theproductionincreasedhighestfromyears2005duetothenewdownstreamplants
havebeenstartedtoproduceinvariouspetrochemicalsubstan ceforexamplecyclohexaneand
PTA.TheIntermediateproductsalsoillustratedanincrease,whileupstreamproductsdecreased
duetohaltinoperationforthepurposeofmaintenanceand
repair.
B.E.2549 is estimation data
2545 2546 2547 2548 25 4 9
2002
2003
2004
2005 2006
DepartmentofAlternativeEnergyDevelopmentandEfficiency(DEDE)
ASt udy onEnergyEfficiencyIndexinPetrochemicalIndustry
11
N.B.Years2006approximatedvalues.
Figure9Productionvolumeofpetrochemicalproductsfromyears2002to2006(PTIT)
Table2AverageoperationcapacityofThailand‘spetrochemicalindustryfromyears2003‐2006
Petrochemical
Industry
CapacityAverage(%)
2002 2003 2004 2005 2006
Upstream 89 99 98 94 90
Intermediate 85 98 100 90 81
Downstream 86 87 88 86 85
Source:PTIT,2006
Upstreamandintermediatepetrochemicalproductionhadanaverageof90‐95percent,
while downstream production had 85 percent of production capacity.In 2006 downstream
productionslightlydecreaseasnewlyset‐upfacilitieswerenotoperatinginfullyet.
Analyses of recent periods have found that production and marketing have been
growingsatisfactorily,andwillcontinuetorise.Theliberalizationofpetrochemicaltradeduring
the past decade plus the country’s managing to sail through the 1997 economic crisis have
helped strengthened the Thai entrepreneurs, who saw the need to unite to increase their
businesspotential.Marketshaveexpandednoticeably,bothdomesticallyand
abroad.
Thailand Petrochemical Production
0
2,000
4,000
6,000
8,000
10,000
12,000
14,000
16,000
18,000
2545 2546 2547 2548 2549
KTA
Upstream Intermediate Downstream
2002
2003
2004
2005 2006
DepartmentofAlternativeEnergyDevelopmentandEfficiency(DEDE)
AStudyonEnergyEfficienc yIndexinPetrochemicalIndustry
12
1.5EnergyConsumptionofPetrochemicalIndustryinThailand
Thepetrochemical industry relies heavily onenergy.Withitspresentgrowthrate,and
ascompanies are also constantly trying to expand their production, consump tion of electricity,
gas and fuels will increase unavoidably, no matter how much emphasis is given to energy
conservation.
1.5.1Energyconsumption
From the data compile d from 30 plants producing upstream, intermediate and
downstream petrochemicals, the study has found that consumptionofenergyis highest in the
upstreamindustry,(datafromalltheplantsinThailand)asshowninTable3
Table3EnergyconsumptioninThailand’spetrochemicalindustry
Petrochemical
Industry
Audited
Plants(%)
EnergyUse (Ktoe)
Year2005 (%) Year2006 (%)
Upstream 100 2,172
68.91 2,186 64.48
Intermediate 43 213 6.76 475 14.01
Downstream 32 768 24.33 729 21.50
Total 3,152 100.00 3,390 100.00
However, energy consumption of the country’s entireindustrial sector, including food,
drinks, textiles, wood, chemicals, pap er, ceramic, cement and metal (referred from energy
consumption data from DEDE’s energy consumption annual report), was selected to compare
the energy used in the petrochemical industry.It was found that the petrochemical sector
consumes
15to17percentofthetotalindustrialsector’sconsumption.
DepartmentofAlternativeEnergyDevelopmentandEfficiency(DEDE)
ASt udy onEnergyEfficiencyIndexinPetrochemicalIndustry
13
Electricity
6%
Steam
38%
Natural Gas
42%
LPG 0.6%
Diesel
0.6%
Fuel Oil
1.7%
Others
11.1%
1.5.2ProportionofEnergyConsumptioninPetrochemicalIndustry
Consumptiondatacompiledfromselectedmanufacturingplantsin2006showsthemain
energiesusedinthemanufacturingprocessofproductsconsistsofelectricity,steam,naturalgas
(NG),liquidpetroleumgas(LPG),dieseloil,fueloil,andothers(processoff‐gas,fuelgas,etc.)as
showninTable4andillustratedin
Figure10
Table4ProportionofEnergyConsumption(%)
EnergyType Ratio(%)
**
NaturalGas 42.0
Steam 38.0
Electricity 6.0
Fueloil 1.7
Dieseloil 0.6
LPG 0.6
Others (Processoff‐gas,Fuelgas, etc.)
11.1
Total 100
**estimationvaluefromparticipatingpetrochemicalplant
Figure10 Proportionofenergyconsumptioninyea r s 2006
As shown above, natural gas is the topmost energy being used in petrochemical
production(mostlyasdirectfuelfortheoven,ordirectheat),whilestreamissecondinquantity.
Othertypesofenergy,alsoestimatedfrom
consumptionintheproductionprocess,areusedat
smallerquantities.
DepartmentofAlternativeEnergyDevelopmentandEfficiency(DEDE)
AStudyonEnergyEfficienc yIndexinPetrochemicalIndustry
14
2.1ClassificationofPetrochemicalIndustry
The petrochemical industry covers a vast array of products, and the manufacturing
processesvaryfromoneproducttoanother.Sometimesthesameproductsusedifferentinraw
materials, technological processes, and even different equipment.For this reason, energy is
usedinvaryingamounts.
However, from this study, in which consumption of
energy is compared using
internationalbasis,theindustryisclassifiedonthebasisofproductionprocess,withtheaimto
presentananalysisofindicesofenergyconsumptionwhicharecorrect,suitableand beneficial
butwithoutharmingtheexistingplantsfromwheredataweregiven.Thestudyresultwill reveal
overall facts and figures of each group as a whole, and not of individual products.This is
because there are not too many petrochemical plants in Thailand, and presenting too detailed
datamayberevealingconfidentialinformationofthebusinesses.
Therefore,petrochemicalindustryweredividedinto3groupsasfollows:
UpstreamPetrochemicalIndustry)
- OlefinsGroup
- AromaticsGroup
IntermediatePetrochemicalIndustry
DownstreamPetrochemicalIndustry
- HDPE
- PS,PP,EPS
- EmulsionPVC,ABS,SAN, PC
2.CLASSIFICATIONOFPETROCHEMICALINDUSTRY
DepartmentofAlternativeEnergyDevelopmentandEfficiency(DEDE)
ASt udy onEnergyEfficiencyIndexinPetrochemicalIndustry
15
1) CrackingProcess
Crackingisaprocessinwhichmoleculesofrawmaterialaredissociatedintosmaller
ones.Therearetwotypesofcrackingprocess,thermalsteamcrackingandcatalyticcracking.
2.2ProductionProcesses
2.2.1UpstreamPetrochemicalProduction
Upstreampetrochemicalindustrialprocessaimsatproducingprimaryfeedstockforthe
nextgroupofproducts.ItsproductionprocessisshowninFigure11‐13(source:PTIT2006),with
7majorproducts,namely,methane,ethylene,propylene,MixC
4
benzene,tolueneandxyleneas
the basic chemicals for further petrochemical development.There are 2 major processes, as
follows:
ThermalSteamCracking
Steamcracking is the dissociation of raw
material such as ethane and propane
yielding important petrochemical products,
ethyleneandpropylene,mixedC4,pyrolysis
gasoline. Methane and hydrogen are also
someofmajorby‐products.
CatalyticCracking
Dissociation of larger, stable molecules
requires catalysis. Refinery products such
as gasoil and fuel oil may be passed
throughcatalyticcracker toobtaingasoline
and diesel as major products and by ‐
product, propylene, which is primary
petrochemicalproduct.
2) ReformingProcess
Reforming of hydrocarbon structure may be accomplished by the use of heat,
pressure and/or catalyst in order to obtain desired products. This process converts heavy
naphthatoaromaticssuch asbenzene,tolueneandxyleneaswellashydrogenasby‐product.
Reformingmaybecarriedoutby
severalfollowingmethods.
Dehydrogenation is a process in which hydrogen atoms are being taken away from
saturated hydrocarbons structure leaving product of unsaturated hydrocarbons such as
thedehydrogenationofcyclohexan etoaromatics.
Dehydrocyclization is a process in which hydrogen atoms are being taken away from
aliphatichydrocarbonsyieldingaromaticssuchasdehydrocyclization
ofparaffin.
Dealkylationistheextractionofalkylgroupfromtolueneandxyleneyieldingbenzene.
Transalkylation or Disproportionation is the combination process of two molecules
resulting in two new molecules which are bigger and smaller than precursor ones i.e.,
catalytictransalkylationoftoluenetobenzeneandxylene.
Isomerization involves themolecular restructuring of material whileretaining the same
numberofatomsi.e.,isomerizationofo‐xyleneandm‐xylenetop‐xylene.
DepartmentofAlternativeEnergyDevelopmentandEfficiency(DEDE)
AStudyonEnergyEfficienc yIndexinPetrochemicalIndustry
16
Figure 11Productionprocessesofmethane,ethylene,propyleneandmixed‐C4fromNGor
propane
Figure 12Productionprocessesofmethane,ethylenepropyleneandmixed‐C
4
fromnaphthaor
gasoil
Figure 13Productionprocessesofbenzene,tolueneandxylene
DepartmentofAlternativeEnergyDevelopmentandEfficiency(DEDE)
ASt udy onEnergyEfficiencyIndexinPetrochemicalIndustry
17
2.2.2IntermediatepetrochemicalProcess
Intermediate petrochemical industrial process uses upstream productsas feedstock for
downstream production industry. Intermediate products can be divided into the following
classes:
OlefinIntermediates
AromaticIntermediates
AlkaneIntermediates
Theproductionprocess of Intermediate petrochemical is complex and differs from one
producttoanother.Itisalsorelateddirectlytodownstreamprocess.SeeFigure14‐16
Figure 14ProductionprocessofVinylChlorideMonomer(VCM)
Figure 15Productionprocessof StyreneMonomer(SM)
DepartmentofAlternativeEnergyDevelopmentandEfficiency(DEDE)
AStudyonEnergyEfficienc yIndexinPetrochemicalIndustry
18
Figure 16Productionprocessof PureTerephthalicAcid(PTA)
2.2.3DownstreamProduction
Downstream petrochemical industrial process relies on upstream and intermediate
production process in producing what is to be converted to final products.Downstream
productscanbegroupedasfollows:
PlasticResins,composeof
• CommodityPlastics
• EngineeringPlastics
• HighPerformancePlastics
SyntheticFibers
SyntheticRubbers,Elastomers
SyntheticCoatingandAdhesiveMaterials
Polymerization is a major process for production of downstream petrochemicals. This
process involves the combination of monomers into long chain polymer.Typically,
polymerization process requires the use of catalysts, heat and pressure in order to achieve
completereactions.Polymerizationmaybeperformedbyseveralmethodssuch
as:
Gasphasepolymerizationunderhighpressureandtemperature
Solutionphasepolymerizationunderhighpressureandtemperature
Bulkor batchpolymerizationundermoderatepressureandtemperature
Suspensionpolymerization undermoderatepressureandtemperature
Emulsion polymerizationundermoderatepressureandtemperature
DepartmentofAlternativeEnergyDevelopmentandEfficiency(DEDE)
ASt udy onEnergyEfficiencyIndexinPetrochemicalIndustry
19
Figure 17Productionprocessof LDPE
Figure 18Productionprocessof LLDPEbysolutionphasepolymerization
Figure 19Productionprocessof LLDPEbysolutionphasepolymerization
DepartmentofAlternativeEnergyDevelopmentandEfficiency(DEDE)
AStudyonEnergyEfficienc yIndexinPetrochemicalIndustry
20
Figure 20Productionprocessof PVCbysuspensionpolymerizatio n
VCM
RawMaterial
PolymerizationReactor
Slurry
Stripper
Latex
Storageand
Seiving
Dryer Classifier
Storage
Packing
PVCResin
RawMaterial
Storageand
Preparation
VCM
Recovery
Grinding
Figure 21Productionprocessof PVCby emulsionpolymerization
Figure 22Productionprocessof PP
DepartmentofAlternativeEnergyDevelopmentandEfficiency(DEDE)
ASt udy onEnergyEfficiencyIndexinPetrochemicalIndustry
21
Figure 23Productionprocessof PVCResin
Figure 24Productionprocessof PPbygasphasepolymerization
Figure 25Productionprocessof ABS