Edited the processes of regional economic integration impact on european automotive industry
Bạn đang xem bản rút gọn của tài liệu. Xem và tải ngay bản đầy đủ của tài liệu tại đây (226.42 KB, 15 trang )
TABLE OF CONTENTS
TABLE OF CONTENTS..........................................................................................i
INTRODUCTION.....................................................................................................1
I. THEORETICAL BASIS OF REGIONAL ECONOMIC INTEGRATION
IMPACT ON EUROPE AUTOMOTIVE INDUSTRY....................................2
1.1. Regional economic integration.................................................................2
1.1.1. Definition of Economic Integration.....................................................2
1.1.2. The Advantages of Economic Integration...........................................2
1.1.3. The Costs of Economic Integration.....................................................2
1.2. European automotive industry................................................................3
1.2.1. The automotive industry has been one of the most significant growth
engines for economic welfare in Europe........................................................3
1.2.2. Economic contribution of European automotive industry...................3
1.2.3. Environmental contribution.................................................................4
II. Regional economic integration Impact on European automotive industry
................................................................................................................................4
2.1. Data Collection..........................................................................................4
2.2. About 2016 Baseline..................................................................................5
2.3. Major impacts Impact on European automotive industry........................9
2.3.1. Tariffs on parts and components..........................................................9
2.3.2. Non-tariff barriers................................................................................9
2.3.3. Change in demand for parts and components from car manufacturers
......................................................................................................................10
2.3.4. Impact of removal of EU import tariffs and reduction of NTBs on
parts and components...................................................................................10
i
2.3.5. Impact of removal of partners’ import tariffs and NTB on EU parts
and components............................................................................................11
CONCLUSION.......................................................................................................12
REFERENCE..........................................................................................................13
ii
INTRODUCTION
The automotive industry represents a significant share of output and
employment in the European Union. The continued process of global economic
integration implies growing incomes in emerging markets near Europe and further
afield. At the same time, new car manufactures have entered the stage and compete
in the global markets. In addition, the supply chains have become even more
integrated and growing global in scale.
Recently, domestic demand in Europe for new cars and other motor vehicles
has dropped due to the global financial, economic crisis starting from 2008/2009
and Covid-19 Pandemic. Trade volumes have dropped in response to the drop in
demand. At the same time, demand for new cars has been less affected in emerging
markets during the crisis, and consumption and trade patterns are shifting towards
fast-growing markets outside Europe. Consequently, access to these overseas
markets is becoming ever more critical both for trade flows of final goods and for
the organization of the supply chain. This presents the European automotive
industry with new opportunities and new challenges in the home market and abroad.
While the EU automotive industry has many strengths in skills, leadership,
technology and brands, there is also an overcapacity compared to domestic
consumption and current export levels. The industry is struggling to maintain
production levels in the face of the declining sales in Europe resulting from the
economic downturn.
Trade barriers (tariffs and non-tariff barriers) are depressing these
opportunities for the EU automotive industry and making it more difficult to access
and take part in the growth in foreign markets. Similarly, the EU's tariffs and nontariff barriers are discouraging foreign competitors from further success in the
European market and worldwide due to The process of Regional Economic
Integration.
1
I.
THEORETICAL
BASIS
OF
REGIONAL
ECONOMIC
INTEGRATION IMPACT ON EUROPE AUTOMOTIVE INDUSTRY
1.1. Regional economic integration
1.1.1. Definition of Economic Integration
According to Richard E. Baldwin[1], Economic integration is an
arrangement among nations that typically includes reducing or eliminating trade
barriers and the coordination of monetary and fiscal policies. Economic integration
aims to reduce costs for consumers and producers and increase trade between the
countries involved in the agreement.
Regional economic integration is when two or more countries agree to
eliminate economic barriers to enhance productivity and achieve greater economic
interdependence.
Economic integration is sometimes referred to as regional integration as it
often occurs among neighboring countries.
1.1.2. The Advantages of Economic Integration
The advantages of economic integration fall into three categories:
employment trade benefits and political cooperations.
More specifically, economic integration typically leads to a decrease in the
cost of trade, improved availability of goods and services and a more
comprehensive selection of them, and gains in efficiency that lead to greater
purchasing power.
Employment opportunities improve because trade liberalization leads to
cross-border investment, market expansion, and technology sharing.
Political cooperation among countries also can improve because of more
robust economic ties, which provide an incentive to resolve conflicts peacefully and
lead to more excellent stability.
2
1.1.3. The Costs of Economic Integration
Despite the benefits, economic integration has costs. These fall into two
categories:
Diversion of trade. Trade can be diverted from nonmembers to members,
even if it is economically damaging for the member state.
Erosion of national sovereignty. Economic unions typically must adhere to
precepts on trade, monetary policy, and fiscal policies established by an unelected
external policymaking body.
Because economists and policymakers believe economic union leads to
significant advantages, many institutions attempt to measure the degree of economic
alliance across countries and regions. The methodology for measuring economic
integration typically involves multiple financial indicators, including trade in goods
and services, cross-border capital flows, labor migration, and others. Assessing
economic integration also includes measures of institutional conformity, such as
membership in trade unions and the strength of institutions that protect consumer
and investor rights.
1.2. European automotive industry
1.2.1. The automotive industry has been one of the most significant growth engines
for economic welfare in Europe
The European automotive industry has been on a successful trajectory and
has become a global leader and driver of Europe's growth and prosperity. Both the
passenger car - as a cornerstone for individual mobility and the commercial vehicle
– as the backbone of the European economy contribute tremendously to society,
environment, economic welfare, and growth in Europe.
1.2.2. Economic contribution of European automotive industry
The automotive sector is an indispensable industry with attractive job
opportunities and a growth engine of Europe's economy. The turnover generated by
the sector represents approximately 7 percent of the EU's GDP, and tax
contributions related to the industry total EUR 410 billion in the EU-15 nations
3
alone, equaling roughly 6 percent of their total taxable income[2]. With more than
5.4 million cars exported in 2017, the European automotive industry values over 40
percent of the global automotive value share. Commercial vehicles resolve Europe's
economy, transporting 75 percent of all land-carried goods and 90 percent of value
transported. With average profitability of ~7 percent return on sales in 2017, the
industry is economically robust but with a distinct gap to highly profitable
industries, which achieve an average of ~22 percent return on sales.
1.2.3. Environmental contribution
The automotive industry also contributes to environmental welfare – even if
at first this seems contradictory as the number of cars Europewide rose by >50
percent over the last 20 years[2]. At the same time, however, the industry was
relatively thriving in keeping the detrimental influence on the environment of the
steep increase in the number of vehicles on the road in check – mainly through
effective emission reductions. With almost a 36 percent reduction in CO2
emissions since 1995, today's European new cars are far more efficient than ones
from 20 to 25 years ago. In the same time frame, commercial vehicles' CO2
emissions per km have fallen by 14 percent. NOx emissions have been decreased
for new vehicles by ~90 percent and by ~95 percent for commercial cars since the
early 1990s. Despite the significant reduction of commercial car emissions,
however, the transport industry's growth causes a higher share of transport sector
emissions than 20 years ago. Today, the transport sector accounts for roughly 24
percent of the EU's greenhouse gas emissions compared to 17 percent in 1995.
II. Regional economic integration Impact on European automotive
industry
This chapter estimates the impact of possible Regional Economic Integration on
the European market for passenger cars.
2.1. Data Collection
In order to simulate the impact of REI, this assessment uses detailed sales
data from 2016. The data contains sales quantities and list prices for all vehicles
sold in a given market in that year. While the information on prices is available for
4
each specific variant of the models sold, sales quantities are only recorded at the
model level, which means that the analysis must be conducted at this level. In the
case where several variants of the same model exist, the price of the cheapest
variant is used.
In terms of geographical coverage, this study has data for nine EU countries
and most partner countries. The sales data for the EU market allows us to simulate
the predicted changes to local sales and import flows. Supplementing this with the
data for the partner countries further allows us to predict changes to EU export
flows and thereby to total EU production. The latter is defined as changes in local
sales on the EU market and changes in the volume of cars exported from the EU.
The nine EU countries for which this assessment has data are the following:
Germany, UK, France, Italy, Spain, Belgium, Netherlands, Greece and Portugal. In
terms of sales volumes, these countries account for most new car sales in the EU. In
2016, these markets alone accounted for 86 percent of EU local and 81 percent of
the sales of imported new cars.
2.2. About 2016 Baseline
Table 1 contains the quantities of local sales, imports, exports and production
of new vehicles in the nine EU countries data, and the equivalent values scaled up
to EU-level. Import quantities refer to the total imports of new vehicles from nonEU countries, while exports refer to EU new cars to all potential REI partners.
Table 1: Number of vehicles, 2016
Local sales
EU Imports
EU Exports
(from world) (to all potential REI partners)
EU
Production
EU9
8.283.736
915.835
1.526.945
9.810.681
EU27
9.611.434
1.135.963
1.526.945
11.138.379
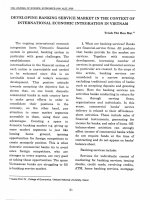
To indicate the relative importance of all potential partners in terms of trade
flows in 2016, the quantity of EU imports and exports are broken down by origin
and destination in Figure 1 and Figure 2.
5
Figure 1: Share of vehicles (no.) imported by origin, 2016
.
Mexico
0,32%
US
12,67%
India
8,38%
Korea
30,93%
Turkey
5,32%
Russia
0,19%
China
0,08%
Other
2,43%
Brazil
1,80%
Japan
40,27%
Canada
0,02%
Malaysia
0,02%
Source: LMC Automotive (2017), European Automotive Industry Outlook
In terms of imports (Figure 1), the most important partners are Japan, Korea,
the US and India, which accounted for 92 percent of the number of cars imported
into the EU in 2016. Vehicles imported from Japan include, among the most
important, those produced by Mazda, Toyota and Suzuki. From Korea, notable car
producers exporting to the EU include GM and Renault, while BMW, Mercedes,
and Chrysler export from the US. Finally, cars imported from India are produced
mainly by Hyundai.
On the other hand, countries such as Malaysia, Canada, and Mexico are
minor players in terms of EU imports of passenger cars. The likely impact of a
potential REI with one of these countries on the domestic EU market is minimal.
The picture in terms of exports is somewhat different. The most critical
market in the US, solely accounting for 44 percent of the number of vehicles
exported from the EU to the potential REI partner countries. In addition, several of
the countries which accounted only for a minor share of EU imports, such as
Canada and Mexico, are relatively important export markets. Therefore, a possible
REI with Canada and a potential revision of the REI with Mexico, in terms of
NTBs, will be significant for the EU.
6
Figure 2: Share of vehicles (no.) exported by destination, 2016
Euromed
7,49%
Central America +
Colombia + Peru +
Singapore +
Ukraine
7,45%
Japan
15,09%
Mercosur
4,77%
Other
25,84%
Korea
4,76%
Canada
5,68%
Mexico
3,61%
Other Asia
6,70%
US
44,12%
India
0,32%
Source: LMC Automotive (2017), European Automotive Industry Outlook
The value of the production of parts and components in the EU was €234
billion, according to Eurostat production statistics in 2016. Imports of parts and
components totaled a little over €20 billion in 2016. The detailed analysis shows
that around half of that import came from REI partners as non-inward processing
trade (IPT) and the other half from non-REI partners outside Europe or as IPT
imports from REI partners.
On the demand side, domestic demand for parts and components in the EU
was €211 billion in 2016 and EU exports were €46 billion, as shown in Chapter 2.
Around €21 billion was EU exports to the REI countries covered in this study, cf.
Table 2.
Table 2: Summary of European parts and components industry
Supply
Non-IPT
EU
Description
imports from
production
REI countries
Total
234
1
EU
other
import
1
12
d
Deman
EU
EU
exports to
domestic
REI
demand
countries
211
21
EU
other
exports
25
7
So looking at the total supply of parts and components in the EU, we find
that supplies from the REI countries in this study constitute around 4 percent of the
total supply (excluding IPT).
Looking at total demand, exports to the REI countries covered in this study
are around 10 percent of total demand. Domestic demand is the largest source of
demand for the EU's parts and components producers account for more than 80
percent of total demand in 2016.
EU's import of parts and components is mainly from Japan, China, Korea
and the US. Of the REI partners analyzed in this study, the top-3 import sources for
the EU (Japan, Korea and the US) accounted for more than three fourth (76 percent)
of total imports from the REI partners in 2016. The largest product category is
gearboxes amounting to almost 20 percent of the total imported value of the 19
parts and components products covered in our analysis. Other top-5 products
include tires (new), body parts, engines (with spark-ignition >1000 Cc) as well as
the product group "other parts."
EU's export of parts and components is concentrated on much the same
group of countries as imports. However, it is more evenly spread across countries,
with considerable exports destined for Central and South America. Together with
the US, Japan and Korea account for around 55 percent of the total EU export to
potential REI partners, with the US taking top position. The US is followed by
Brazil, Mexico, Japan and Korea. Together the top-5 countries constitute 77 percent
of EU's exports to the covered REI countries.
Concerning products, EU's exports to the REI partners again span most of
the 19 products covered in the analysis except retreated tires, where there is limited
trade with the REI partners. The same top products described above are found on
the export side (gearboxes, body parts and other parts), but engines (with sparkignition >1000 Cc and diesel engines) also make up a considerable share of EU's
export to the REI partners covered. The top-5 products make up 70 percent of the
total EU export to the REI countries covered in the study.
8
2.3. Major impacts Impact on European automotive industry
2.3.1. Tariffs on parts and components
This showed that tariffs on parts and components are substantially lower than
on final vehicles apart from Korea. In the case of the EU, an average tariff of 3.8
percent is applied. This is slightly more than the average Canadian duties applied
(3.4 percent) and substantially larger than the US average duties of 1.3 percent.
India and Brazil impose the highest rates on parts and components, with average
duties of 10 percent in India and 15.4 percent in Brazil.
An analysis of tariff lines within the 4-digit product group showed that close
to 50 percent of the tariff lines were duty-free in Canada and the US, while there are
no duty-free tariff lines in Korea, India, and the EU. As in the case of final vehicles,
Japan applies no tariffs on parts and components, while Brazil admits only 6.5
percent of tariff lines duty-free.
2.3.2. Non-tariff barriers
Parts and components trade is also affected by non-tariff barriers. The model
estimated at the 6-digit product level showed significant NTB estimates for some
parts and components in certain REI partner countries (see table C.6 in appendix C).
However, a large number of the estimates are insignificant or not measurable
because of missing data.
To compensate for the missing data and the insignificant estimates, we have
performed two sets of simulations for parts and components trade concerning NTB.
The first set of simulations uses only the significant parameter estimates from table
C.6 in appendix C. The second set of simulations applies the estimates found in
Chapter 3 for motor vehicles to parts and components, combined with the
significant estimates from table C.6.
The results show only slight differences in the size of the impact for
production of parts and components in the EU depending on which of the two sets
of NTB estimates we use.
9
2.3.3. Change in demand for parts and components from car manufacturers
We find that a change in car production is the main driver for the change in
the production of related parts and components. Of the total effect on the production
of parts and components from liberalizing trade, the increase in car production and
the associated increased demand for parts account for more than 67 percent of the
estimated total increase in production of parts and components because of the vital
linkages with the production of cars as explained above.
The impact on the production of European parts and components varies
between the four main types of parts and components (body, powertrain, equipment
and tires). The impact is more significant for powertrain components, smaller for
body and equipment, and most minor for tires compared to the four main types of
parts. The impact of tires is significant for the European tire industry. The OEM
market makes up a much greater share of total demand for powertrain components
than for tires. By intuition, an engine or a gearbox is not replaced very often, while
tires are replaced multiple times during a vehicle's lifetime. Thus the OEM market
share is naturally much smaller for tires.
2.3.4. Impact of removal of EU import tariffs and reduction of NTBs on parts and
components
While the overall impact of trade liberalization is positive, removing the
EU's import tariffs and NTBs contributes negatively to the EU production of parts
and components. The effect in isolation is estimated to reduce production by €20
million in the baseline scenario with Korea as the only REI-partner and around €300
million if all REIs are implemented on top of the agreement with Korea. However,
the effect is relatively limited and only accounts for around 3-4 percent of the
aggregated effects. The EU's import of parts and components is relatively tiny, as
evident from the baseline data, making up a small fraction of total demand. Even
though the geographical span of supplier networks has expanded in the last decade,
the auto industry is still reliant on inputs being sourced locally. Consequently, the
overall effect for parts and components producers in the EU is positive because of
the significant increase in EU production of cars.
10
2.3.5. Impact of removal of partners’ import tariffs and NTB on EU parts and
components
We find that the removal of partner countries' import tariff and reduction of
NTBs has a positive but relatively moderate impact on EU production of parts and
components. We estimate an increase in production of €97 million due to the tariff
reductions in the REI with Korea alone. Moreover, an increase of €242 million
resulted from removing tariffs with Korea and reducing NTBs. The cumulative
analysis of all REIs impacts EU parts and components exports of €1.1 billion from
tariffs alone and an increase of €2.4 billion from the combination of tariffs and
NTBs (in the case of the second set of NTB simulations).
11
CONCLUSION
The analysis of the impact of REI with existing and potential partners on
the EU automotive sector and the production of cars, light vehicles, and parts and
components conducted in this study shows that overall trade liberalization will be
associated with positive effects.
The current situation for European carmakers and carmakers in the EU is
weakened profitability and production below sustainable capacity utilization levels.
This is primarily the result of domestic demand factors and a lack of adjustment to
the new market situation.
At the same time, the European Union remains overall a net exporter of cars
and light commercial vehicles, and the EU's trade surplus has been increasing over
time. Carmakers in Europe are relatively dependant on domestic demand (around 65
percent of production is destined for the home market), only 14 percent of the car
sales in Europe are imported. It seems clear that the root cause of the bleak situation
for European carmakers is to be found in the domestic market rather than abroad.
On this basis, we do not find that trade liberalization is to blame for the difficulties
at home.
The impact of trade liberalization on the industry has been assessed with
Partial Equilibrium models; therefore, the General Equilibrium effect of trade
agreements (for example, the increased demand for vehicles resulting from higher
GDP) is not accounted for. At the same time, the location of production is assumed
constant. Although manufacturers might choose to move the production of vehicles
due to an REI, these choices cannot be forecasted with a satisfactory degree of
confidence based on the current information, which is the main reason why it has
not been accounted for.
Overall, the individual and cumulative impacts of the Regional Economic
Integration are always positive for the EU industry, even in which only import
tariffs are removed. Nonetheless, as expected, the main gains would come from the
removal of Non-Tariff Barriers.
12
REFERENCE
[1] Richard E. Baldwin, Graduate Institute of International Studies, London School
of Economics, 1995.
[2] Andreas Cornet, Race 2050 – A vision for the European automotive industry,
January 2019
[3] LMC Automotive (2016), European Automotive Industry Outlook, 2016 LMC
Automotive Limited
[4] European Commission. 2016. "Statistics on the trading of goods- user guide."
pp. 16.
[5] LMC Automotive (2017), European Automotive Industry Outlook, 2016 LMC
Automotive Limited
[6] European Commission. 2016. ”EU-South Korea Free Trade Agreement: 10 Key
Benefits for the European
[7] World Trade Report, 2012. “Trade and Public policies: A Closer Look at NonTariff Measures in the 21st Century”. World Trade Organisation.
13