international textbook of obesity
Bạn đang xem bản rút gọn của tài liệu. Xem và tải ngay bản đầy đủ của tài liệu tại đây (12.09 MB, 499 trang )
International Textbook of
Obesity
Edited by
Per Bjo¨ rntorp
Sahlgrenska Hospital, Go¨ teborg, Sweden
JOHN WILEY & SONS, LTD
Chichester
(
New York
(
Weinheim
(
Brisbane
(
Singapore
(
Toronto
International Textbook of Obesity. Edited by Per Bjorntorp.
Copyright © 2001 John Wiley & Sons Ltd
Print ISBNs: 0-471-988707 (Hardback); 0-470-846739 (Electronic)
huangzhiman 2002.12.19
Copyright © 2001 by John Wiley & Sons, Ltd.,
Baffins Lane, Chichester,
West Sussex PO19 1UD, UK
National 01243 779777
International ( ; 44) 1243 779777
e-mail (for orders and customer service enquiries):
Visit our Home Page on: or
All Rights Reserved. No part of this publication may be reproduced, stored in a retrieval
system, or transmitted, in any form or by any means, electronic, mechanical, photocopying,
recording, scanning or otherwise, except under the terms of the Copyright, Designs and Patents Act
1988 or under the terms of a licence issued by the Copyright Licensing Agency Ltd, 90 Tottenham Court
Road, London W1P 0LP, UK, without the permission in writing of the publisher.
Cover illustration copyright ©
Sofia Karlsson and Lars Sjo¨ stro¨m.
Reproduced by permission.
Other Wiley Editorial Offices
John Wiley & Sons, Inc., 605 Third Avenue,
New York, NY 10158-0012, USA
WILEY-VCH Verlag GmbH, Pappelallee 3,
D-69469 Weinheim, Germany
John Wiley & Sons Australia, Ltd., 33 Park Road, Milton,
Queensland 4064, Australia
John Wiley & Sons (Asia) Pte, Ltd., 2 Clementi Loop 02-01,
Jin Xing Distripark, Singapore 129809
John Wiley & Sons (Canada), Ltd., 22 Worcester Road,
Rexdale, Ontario M9W 1L1, Canada
Library of Congress Cataloging-in-Publication Data
International textbook of obesity / edited by Per Bjo¨ rntorp,
p. cm.
Includes bibliographical references and index.
ISBN 0-471-98870-7 (cased)
1. Obesity. I. Bjo¨ rntorp, Per.
RC628.I58 2001
616.398—dc21 00-048591
British Library Cataloguing in Publication Data
A catalogue record for this book is available from the British Library
ISBN 0-471-98870-7
Typeset in 10/11.5pt Times from the author’s disks by Vision Typesetting, Manchester
Printed and bound in Great Britain by Bookcraft (Bath) Ltd, Midsomer Norton, Somerset
This book is printed on acid-free paper responsibly manufactured from sustainable forestry,
in which at least two trees are planted for each one used for paper production.
MMMM
International Textbook of Obesity. Edited by Per Bjorntorp.
Copyright © 2001 John Wiley & Sons Ltd
Print ISBNs: 0-471-988707 (Hardback); 0-470-846739 (Electronic)
Contents
List of Contributors vii
Preface xi
P IE 1
1. Obesity as a Global Problem 3
Vicki J. Antipatis and Tim P. Gill
2. The Epidemiology of Obesity 23
Jacob C. Seidell
3. Body Weight, Body Composition
and Longevity 31
David B. Allison, Moonseong Heo,
Kevin R. Fontaine and
Daniel J. Hoffman
P II D 49
4. Anthropometric Indices of Obesity and
Regional Distribution of Fat Depots .51
T.S. Han and M.E.J. Lean
5. Screening the Population 67
Bernt Lindahl
6. Evaluation of Human Adiposity 85
Steven B. Heymsfield, Daniel J.
Hoffman, Corrado Testolin and
ZiMian Wang
P III A R
O P 99
7. Role of Neuropeptides and Leptin
in Food Intake and Obesity 101
Bernard Jeanrenaud and
Franc¸oise Rohner-Jeanrenaud
8. Regulation of Appetite and the
Management of Obesity 113
John E. Blundell
9. Physiological Regulation of
Macronutrient Balance 125
Susan A. Jebb and Andrew M.
Prentice
10. Fat in the Diet and Obesity 137
Berit Lilienthal Heitmann and
Lauren Lissner
11. Energy Expenditure at Rest and
During Exercise 145
Bjo¨ rn Ekblom
12. Exercise and Macronutrient
Balance 155
Angelo Tremblay and
Jean-Pierre Despre´ s
P IV P T
O 163
13. The Specificity of Adipose Depots . . 165
Caroline M. Pond
14. Causes of Obesity and
Consequences of Obesity Prevention
in Non-human Primates and Other
Animal Models 181
Barbara C. Hansen
15. Social Status, Social Stress and Fat
Distribution in Primates 203
Carol A. Shively and Jeanne M.
Wallace
16. Centralization of Body Fat 213
Per Bjo¨ rntorp
International Textbook of Obesity. Edited by Per Bjorntorp.
Copyright © 2001 John Wiley & Sons Ltd
Print ISBNs: 0-471-988707 (Hardback); 0-470-846739 (Electronic)
17. Obesity and Hormonal
Abnormalities 225
Renato Pasquali and Valentina
Vicennati
18. Cortisol Metabolism 241
Brian R. Walker and Jonathan
R. Seckl
19. Drug-induced Obesity 269
Leif Breum and Madelyn H.
Fernstrom
20. Pregnancy 283
Helen E. Harris
21. Social and Cultural Influences on
Obesity 305
Jeffery Sobal
22. Cessation of Smoking and Body
Weight 323
Kenneth D. Ward, Robert C. Klesges
and Mark W. Vander Weg
P VC 337
23. Visceral Obesity and the Metabolic
Syndrome 339
Roland Rosmond
24. Obesity and Type 2 Diabetes
Mellitus 351
Allison M. Hodge, Maximilian P. de
Courten and Paul Zimmet
25. Cardiovascular Disease 365
Antonio Tiengo and Angelo Avogaro
26. Obesity, Overweight and Human
Cancer 379
Michael Hill
27. Pulmonary Diseases (Including Sleep
Apnoea and Pickwickian Syndrome) 385
Tracey D. Robinson and Ronald
R. Grunstein
28. Obesity and Gallstones 399
S. Heshka and S. Heymsfield
P VI M 411
29. Health Benefits and Risks of Weight
Loss 413
Lalita Khaodhiar and George L.
Blackburn
30. Treatment: Diet 441
Stephan Ro¨ ssner
31. Recent and Future Drugs for the
Treatment of Obesity 451
Luc F. van Gaal, Ilse L. Mertens
and Ivo H. De Leeuw
32. Treatment: Hormones 471
Bjo¨ rn Andersson, Gudmundur
Johannsson and Bengt-A ke Bengtsson
33. Why Quality of Life Measures Should
Be Used in the Treatment of Patients
with Obesity 485
Marianne Sullivan, Jan Karlsson,
Lars Sjo¨ stro¨ m and Charles Taft
34. Surgical Treatment of Obesity 511
John G. Kral
35. Swedish Obese Subjects, SOS 519
Lars Sjo¨ stro¨m
Index 535
vi CONTENTS
loss
Contributors
David B. Allison Obesity Research Center,
St Lukes/Roosevelt Hospital Center, 1090
Amsterdam Avenue, 14th Floor, New York, NY
10025, USA
Email:
Bjo¨ rn Andersson Department of Medicine,
Sahlgrenska University Hospital, University of
Go¨teborg, S-413 45 Go¨teborg, Sweden
Email:
Vicki J. Antipatis MSc International Obesity Task
Force, Rowett Research Institute, Greenburn
Road, Bucksburn, Aberdeen AB21 9SB, UK
Email:
Angelo Avogaro Department of Clinical and
Experimental Medicine, University of Padova, Via
Giustiniani 2, 35100 Padova, Italy
Bengt-A ke Bengtsson Research Center for
Endocrinology and Metabolism, Sahlgrenska
University Hospital, University of Go¨teborg,
S-413 45 Go¨teborg, Sweden
Per Bjo¨ rntorp MD PhD Professor, Department
of Heart and Lung Diseases, Sahlgrenska
University Hospital, University of Go¨teborg,
S-413 45 Go¨teborg, Sweden
Email:
George L. Blackburn MD PhD Professor and
Director of Nutritional Services, Department of
Surgery, Beth Israel Deaconess Hospital, 330
Brookline Avenue, Boston MA 02215, USA
Email:
John E. Blundell BioPsychology Group, University
of Leeds, Leeds LS2 9JT, UK
Email:
Leif Breum MD Department of Medicine,
Endocrine Unit, Køge Hospital, DK-4600 Køge,
Denmark
Email:
Maximilian P. de Courten MD MPH
International Diabetes Institute, 260 Kooyong
Road, Caulfield Vic 3162, Australia
Ivo H. De Leeuw Department of Endocrinology,
Metabolism and Clinical Nutrition, University
Hospital Antwerp, Wilrijkstraat 10, 2650 Edegem,
Antwerp, Belgium
Jean-Pierre Despre´ s Division of Kinesiology and
Department of Food Sciences and Nutrition, Laval
University, Ste-Foy, Quebec, Canada G1K 7P4
Bjo¨ rn Ekblom Department of Physiology and
Pharmacology, Lidingo¨va¨gen 2, Karolinska
Institute, 11486 Stockholm, Sweden
Madelyn H. Fernstrom PhD Professor, Weight
Management Center, University of Pittsburgh
School of Medicine, Western Psychiatric Institute
and Clinic, 3811 O’Hara Street, Pittsburgh PA
15213, USA
Email:
Kevin R. Fontaine Department of Medicine,
Division of Gerontology, University of Maryland,
VA Medical Center, Baltimore, Maryland, USA
Tim P. Gill PhD RPHNutr International Obesity
TaskForce, Rowett Research Institute, Greenburn
Road, Bucksburn, Aberdeen AB21 9SB, UK
Email:
Ronald R. Grunstein FRACP PhD MD Centre
for Respiratory Failure and Sleep Disorders, Level
9, E Block, Royal Prince Alfred Hospital,
Camperdown, Sydney NSW 2050, Australia
Email:
International Textbook of Obesity. Edited by Per Bjorntorp.
Copyright © 2001 John Wiley & Sons Ltd
Print ISBNs: 0-471-988707 (Hardback); 0-470-846739 (Electronic)
T.S. Han PhD Wolfson College, University of
Cambridge, Cambridge CB3 9BB, UK
Email:
Barbara C. Hansen PhD Professor and Director,
Obesity and Diabetes Research Center, University
of Maryland School of Medicine, 10 South Pine
Street 6-00, Baltimore, Maryland 21201, USA
Email:
Helen H. Harris PHLS Communicable Disease
Surveillance Centre, 61 Collindale Avenue,
London NW9 5EQ, UK
Email:
Berit Lilienthal Heitman Institute of Preventive
Medicine, Copenhagen Health Services,
Copenhagen Municipal Hospital, DK-1399
Copenhagen K, Denmark
Email:
Moonseong Heo Obesity Research Center,
St Luke’s/Roosevelt Center, 1090 Amsterdam
Avenue, 14th Floor, New York, NY 10025, USA
S. Heshka St Luke’s/Roosevelt Hospital Center,
1111 Amsterdam Avenue, New York, NY 10025,
USA
Steven B. Heymsfield PhD Weight Control Unit,
Obesity Research Center, St Luke’s/Roosevelt
Hospital Center, 1090 Amsterdam Avenue, 14th
Floor, New York, NY 10025, USA
Email:
Michael Hill DSc FRCPath Chairman, European
Cancer Prevention Organisation; Professor,
Nutrition Research Centre, South Bank University,
103 Borough Road, London SE1 0AA, UK
Allison M. Hodge BAgSc BSc GradDipDiet
International Diabetes Institute, 260 Kooyong
Road, Caulfield, Victoria 3162, Australia
Email:
Daniel J. Hoffman PhD MPH Obesity Research
Center, St Luke’s/Roosevelt Medical Center,
1090 Amsterdam Avenue, 14th Floor, New York,
NY 10025, USA
Email:
Bernard Jeanrenaud Lilly Research Laboratories,
Division of Endocrine Research and Clinical
Investigation, Lilly Corporate Center,
Indianapolis, Indiana 46285, USA
Susan A. Jebb MRC Human Nutrition Research,
Downhams Lane, Cambridge CB4 1XJ, UK
Email:
Gudmundur Johannsson Research Center for
Endocrinology and Metabolism, Sahlgrenska
University Hospital, University of Go¨teborg,
S-413 45 Go¨teborg, Sweden
Jan Karlsson Health Care Research Unit,
Sahlgrenska University Hospital, University of
Go¨teborg, S-413 45 Go¨teborg, Sweden
Lalita Khaodhiar MD Fellow in Clinical
Nutrition, Beth Israel Deaconess Medical Center,
1 Autumn Street, Harvard Medical School, Boston,
Massachusetts 02215, USA
Robert C. Klesges PhD University of Memphis
Center for Community Health, 5350 Poplar
Avenue, Memphis, TN 38119, USA
John G. Kral MD PhD SUNY Downstate Medical
Center, 450 Clarkson Avenue, Box 40, Brooklyn,
New York 11203, USA
Email:
M.E.J. Lean MA MD FRCP Department of
Human Nutrition, University of Glasgow, Glasgow
Royal Infirmary, Glasgow G31 2ER, UK
Email:
Bernt Lindahl MD Behavioural Medicine,
Department of Public Health and Clinical
Medicine, Umea˚ University, SE-901 87 Umea˚,
Sweden
Email:
Lauren Lissner Department of Medicine,
Sahlgrenska University Hospital, University of
Go¨teborg, S-413 45 Go¨teborg, Sweden
Ilse L. Mertens Department of Endocrinology,
Metabolism and Clinical Nutrition, University
Hospital Antwerp, Wilrijkstraat 10, 2650 Edegem,
Antwerp, Belgium
Renato Pasquali MD Endocrinology Unit,
Department of Internal Medicine and
Gastroenterology, S. Orsola-Malphighi Hospital,
Via Massarenti 9, 40138 Bologna, Italy
Email:
C.M. Pond Department of Biology, The Open
University, Milton Keynes MK7 6AA, UK
Email:
viii CONTRIBUTORS
Andrew M. Prentice MRC Human Nutrition
Research, Elsie Widdarson Laboratory, Fulbourn
Road, Cambridge CB1 9NL, UK
Email:
Tracey D. Robinson MB BS FRACP Centre for
Respiratory Failure and Sleep Disorders, Royal
Prince Alfred Hospital, Camperdown, Sydney
NSW 2050, Australia
Email:
Franc¸ oise Rohner-Jeanrenaud Laboratoires de
Recherches Metaboliques, Geneva University
School of Medicine, Geneva, Switzerland
Email: Jeanrenaud—
Roland Rosmond Department of Heart and Lung
Diseases, Sahlgrenska University Hospital,
University of Go¨teborg, S-413 45 Go¨teborg,
Sweden
Stephan Ro¨ ssner Professor, Obesity Unit, M73,
Huddinge University Hospital, S-141 86
Stockholm, Sweden
Email:
Jonathan R. Seckl University of Edinburgh,
Endocrinology Unit, Department of Medical
Sciences, Western General Hospital, Edinburgh
EH4 2XU, UK
Jacob C. Seidell PhD Department of Chronic
Diseases Epidemiology, National Institute of
Public Health and Environmental Protection,
Institute for Research in Extramural Medicine,
Free University Amsterdam, PO Box 1, 3720 BA
Bilthoven, Amsterdam, The Netherlands
Email:
Carol A. Shively PhD Department of Pathology
(Comparative Medicine), Wake Forest University
School of Medicine, Medical Center Boulevard,
Winston-Salem, NC 27157-1040, USA
Email:
Lars Sjo¨ stro¨ m Department of Internal Medicine,
Sahlgrenska University Hospital, University of
Go¨teborg, S-413 45 Go¨teborg, Sweden
Email:
Jeffery Sobal PhD MPH Division of Nutritional
Sciences, Cornell University, 303 MVR Hall,
Ithaca NY 14853, USA
Email:
Marianne Sullivan Professor, Health Care
Research Unit, Sahlgrenska University Hospital,
University of Go¨teborg, SE-413 45 Go¨teborg,
Sweden
Email:
Charles Taft Health Care Research Unit,
Sahlgrenska University Hospital, University of
Go¨teborg, SE-413 45 Go¨teborg, Sweden
Corrado Testolin Obesity Research Center,
St Luke’s/Roosevelt Hospital Medical Center,
1090 Amsterdam Avenue, 14th Floor, New York,
NY 10025, USA
Antonio Tiengo Department of Clinical and
Experimental Medicine, University of Padova, Via
Giustiniani 2, 35100 Padova, Italy
Email:
Angelo Tremblay Division of Kinesiology and
Department of Food Sciences and Nutrition,
Physical Activity Sciences Laboratory, Laval
University, Ste-Foy, Quebec, Canada G1K 7P4
Email:
Luc F. van Gaal Professor, Department of
Endocrinology, Metabolism and Clinical
Nutrition, University Hospital Antwerp,
Wilrijkstraat 10, 2650 Edegem, Antwerp, Belgium
Mark W. Vander Weg PhD Professor, University
of Memphis Center for Community Health, 5350
Poplar Avenue, Memphis, TN 38119, USA
Valentina Vicennati Endocrinology Unit,
Department of Internal Medicine and
Gastroenterology, S. Orsola-Malpighi Hospital,
Via Massarenti 9, 40138 Bologna, Italy
Brian R. Walker University of Edinburgh,
Endocrinology Unit, Department of Medical
Sciences, Western General Hospital, Edinburgh
EH4 2XU, UK
Email:
Jeanne M. Wallace Department of Pathology
(Comparative Medicine), Wake Forest University
School of Medicine, Medical Center Boulevard,
Winston-Salem, NC 27157-1040, USA
ZiMian Wang Obesity Research Center,
St Luke’s/Roosevelt Hospital Center, 1090
Amsterdam Avenue, 14th Floor, New York,
NY 10025, USA
ixCONTRIBUTORS
Kenneth D. Ward PhD Assistant Professor,
University of Memphis Center for Community
Health, 5350 Poplar Avenue, Suite 675, Memphis,
TN 38119, USA
Email:
Paul Zimmet MD PhD FRACP Professor,
International Diabetes Institute, 260 Kooyong
Road, Caulfield, Victoria 3162, Australia
Email:
x CONTRIBUTORS
Preface
Why another book on obesity? Recently we have
seen several similar books of which some are very
comprehensive. The finalizing of this book has been
delayed. It was originally meant to be presented at
the Paris Congress as another armament in the
current worldwide fight against obesity. This first
planned book was rather limited in contents, but it
was eventually decided to cover additional fields,
and here is the result.
The field of modern obesity research is fairly
young and has expanded considerably with time.
The ‘pioneers’ who began this research are still to a
large extent active, and several have contributed to
this book with reviews in their respective sub-
speciality of obesity research. One ambition with
the present book was to invite several younger re-
searchers to write chapters. In this way new angles
of the problem have been presented. Rethinking
and research should go hand in hand.
Although things appear to improve, I have the
impression that at least in certain countries obesity
is still not considered with sufficient seriousness.
The economic arguments seem to have made some
politicians and decision makers raise their eye-
brows. The involvement of central, international
organizations in making recommendations should
have an effect. National problems of obesity are
now also the subject of surveys in several countries
and counteractions are planned.
A major problem is, however, that we still have
difficulties impressing ourselves on adjacent areas
of research. To take one example, during a recent
major congress on diabetes mellitus I asked a hand-
ful of leading diabetes researchers the following
questions: Which is the major problem in diabetes
research? Unanimous answer: diabetes mellitus
type 2. Which is the most frequent risk factor or
precursor state to this type of diabetes? Unanimous
answer: obesity. I then suggested that we should
join forces and see what can be done to prevent and
treat obesity more successfully than is possible to-
day. This was met with considerable enthusiasm.
The obesity and diabetes fields are largely over-
lapping. As a matter of fact obesity might be con-
sidered as the first step towards diabetes, where
beta-cell insufficiency is eventually added. I think it
would be extremely useful for both fields to collab-
orate more than is now the case. In a way the
current situation is reminiscent of the clinical sub-
specialization where various organs are treated by
different specialists, who have difficulties in seeing
the world outside the fence, and thereby miss im-
portant information that might benefit the patient.
What we could do, as an initial step, is to reserve
large parts of obesity meetings for diabetes and vice
versa. Several presidents for upcoming congresses
in both obesity and diabetes have, as a response to a
direct question, agreed that this is a good idea, and
we will see if this is only lip-service or if the idea has
been taken seriously.
The concept of the metabolic syndrome, a syn-
drome strongly associated with abdominal obesity,
has been very helpful in facilitating the realization
that we are to a large extent dealing with a common
background to prevalent diseases. The awareness of
this syndrome has had the consequence that the
complex obesity—insulin resistance—dyslipidaemia—
hypertension is often discussed as a cluster in con-
gresses of diabetes, cardiology and hypertension.
The realization of this clustering of symptoms has
also had an impact on clinical activities, and has led
to work-up outside one particular specialty. It is
now more frequent that hypertensiologists deter-
mine circulating lipids and that cardiologists exam-
ine insulin resistance, and, most importantly,
register height, weight and body circumferences.
International Textbook of Obesity. Edited by Per Bjorntorp.
Copyright © 2001 John Wiley & Sons Ltd
Print ISBNs: 0-471-988707 (Hardback); 0-470-846739 (Electronic)
This is clearly a large step forward.
Writing chapters for a book like this is a major
task, interfering with the activities of an already
busy day. I would like to thank the contributors
who have taken on the task of writing chapters for
this book, and also Wiley who asked me to organize
it. The collaboration with Michael Osuch and Han-
nah Bradley has been very pleasant.
Per Bjo¨ rntorp
University of Go¨ teborg, Sweden
x PREFACE
Part I
Epidemiology
MMMM
1
Obesity as a Global Problem
Vicki J. Antipatis and Tim P. Gill
Rowett Research Institute, Aberdeen, UK
INTRODUCTION
Obesity is a major public health and economic
problem of global significance. Prevalence rates are
increasing in all parts of the world, both in affluent
Western countries and in poorer nations. Men,
women and children are affected. Indeed, over-
weight, obesity and health problems associated
with them are now so common that they are replac-
ing the more traditional public health concerns
such as undernutrition and infectious disease as the
most significant contributors to global ill health (1).
In 1995, the excess adult mortality attributable to
overnutrition was estimated to be about 1 million
deaths, double the 0.5 million attributable to under-
nution (2).
This chapter looks at obesity as a global problem.
It begins with a brief overview of methods of classi-
fication, a critical issue for estimating the extent of
obesity in populations. The serious impact of excess
body weight on individuals and societies through-
out the world in terms of associated health, social
and economic costs is considered next. The body of
the chapter concentrates on current prevalence and
trends of adult obesity rates around the world, in-
cluding projections for the year 2025. Comment is
made on key features and patterns of the global
epidemic followed by discussion of the major fac-
tors that are driving it. An overview of the emerging
childhood obesity problem is given next. The chap-
ter concludes with a call for global action to tackle
the epidemic.
WHAT IS OBESITY AND HOW IS IT
MEASURED?
At the physiological level, obesity can be defined as
a condition of abnormal or excessive fat accumula-
tion in adipose tissue to the extent that health may
be impaired. However, it is difficult to measure
body fat directly and so surrogate measures such as
the body mass index (BMI) are commonly used to
indicate overweight and obesity in adults. Addi-
tional tools are available for identification of indi-
viduals with increased health risks due to ‘central’
fat distribution, and for the more detailed charac-
terization of excess fat in special clinical situations
and research.
Measuring General Obesity
The BMI provides the most useful and practical
population-level indicator of overweight and obes-
ity in adults. It is calculated by dividing body-
weight in kilograms by height in metres squared
(BMI : kg/m). Both height and weight are
routinely collected in clinical and population health
surveys.
In the new graded classification system develop-
ed by the World Health Organization (WHO), a
BMI of 30 kg/m or above denotes obesity (Table
1.1). There is a high likelihood that individuals with
a BMI at or above this level will have excessive
body fat. However, the health risks associated with
overweight and obesity appear to rise progressively
International Textbook of Obesity. Edited by Per Bjo¨ rntorp.
© 2001 John Wiley & Sons, Ltd.
International Textbook of Obesity. Edited by Per Bjorntorp.
Copyright © 2001 John Wiley & Sons Ltd
Print ISBNs: 0-471-988707 (Hardback); 0-470-846739 (Electronic)
Table 1.1 Classification of overweight and obesity in adults
according to BMI
Classification BMI (kg/m)
Underweight :18.5
Normal range 18.5—24.9
Overweight P25
Pre-obese 25.0—29.9
Obese class I 30.0—34.9
Obese class II 35—39.9
Obese class III P40
Source: WHO (1).
Table 1.2 Sex-specific waist circumference measurements for
identification of individuals at increased health risk due to
intra-abdominal fat accumulation
Waist circumference
(cm)
Risk of metabolic
complications Men Women
Alerting zone Increased 94 80
Action zone Substantially increased 102 88
Adapted from WHO (1).
with increasing BMI from a value below 25 kg/m,
and it has been demonstrated that there are benefits
to having a measurement nearer 20—22 kg/m,at
least within industrialized countries. To highlight
the health risks that can exist at BMI values below
the level of obesity, and to raise awareness of the
need to prevent further weight gain beyond this
level, the first category of overweight included in the
new WHO classification system is termed ‘pre-
obese’ (BMI 25—29.9 kg/m).
Caution is required when interpreting BMI
measurements in certain individuals and ethnic
groups. The relationship between BMI and body fat
content varies according to body build and body
proportion, and a given BMI may not correspond
to the same degree of fatness across all populations.
Recently, a meta-analysis among different ethnic
groups showed that for the same level of body fat,
age and gender, American blacks have a 1.3 kg/m
higher BMI and Polynesians have a 4.5 kg/m high-
er BMI compared to Caucasians. By contrast,
BMIs in Chinese, Ethiopians, Indonesians and
Thais were shown to be 1.9, 4.6, 3.2 and 2.9 kg/m
lower than in Caucasians (3). This suggests that
population-specific BMI cut-off points for obesity
need to be developed.
Measuring Central Obesity
For a comprehensive estimate of weight-related
health risk it is also desirable to assess the extent of
intra-abdominal or ‘central’ fat accumulation. This
can be done by simple and convenient measures
such as the waist circumference or waist-to-hip
ratio. Changes in these measures tend to reflect
changes in risk factors for cardiovascular disease
and other forms of chronic illness. Some experts
believe that a health risk classification based on
waist circumference alone is more suitable as a
health promotion tool than either BMI or waist-to-
hip ratio, alone or in combination (4). Recent work
from the Netherlands has indicated that a waist
circumference greater than 102 cm in men, and
greater than 88 cm in women, is associated with a
substantially increased risk of obesity-related meta-
bolic complications (Table 1.2). The level of health
risk associated with a particular waist circumfer-
ence or waist-to-hip ratio may vary across popula-
tions.
THE HEALTH, SOCIAL AND
ECONOMIC COSTS ASSOCIATED
WITH OVERWEIGHT AND OBESITY
There is reason to be concerned about overweight
and obesity as overwhelming evidence links both to
substantial health, social and economic costs.
Overview of the Health Costs
US figures suggest that about 61% of non-insulin-
dependent diabetes mellitus (NIDDM) and 17% of
both coronary heart disease (CHD) and hyperten-
sion can be attributed to obesity. Indeed, as a per-
son’s BMI creeps up through overweight into the
obese category and beyond, the risk of developing a
number of chronic non-communicable diseases
such as NIDDM, CHD, gallbladder disease, and
certain types of cancer increases rapidly. There is
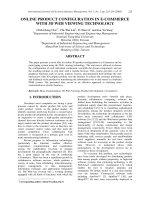
also a graded increase in relative risk of premature
death (Figure 1.1).
Before life-threatening chronic disease develops,
however, many overweight and obese patients de-
4 INTERNATIONAL TEXTBOOK OF OBESITY
Figure 1.1 The relationship between risk of premature death
and BMI. The figure is based on data from professional, white
US women who have never smoked and illustrates the graded
increase in relative risk of premature death as BMI increases.
Adapted from WHO (1)
Table 1.3 Relative risk of health problems associated with
obesity
Greatly increased
(relative risk much
Moderately
increased Slightly increased
greater than 3) (relative risk 2—3) (relative risk 1—2)
NIDDM CDH Certain cancers
Gallbladder disease Hypertension Reproductive
hormone
abnormalities
Dyslipidaemia Osteoarthritis
(knees)
Polycystic ovary
syndrome
Insulin resistance Hyperuricaemia
and gout
Impaired fertility
Breathlessness Low back pain due
to obesity
Sleep apnoea Increased
anaesthetic risk
Fetal defects arising
from maternal
obesity
Source: WHO (1).
velop at least one of a range of debilitating condi-
tions which can drastically reduce quality of life.
These include musculoskeletal disorders, respir-
atory difficulties, skin problems and infertility,
which are often costly in terms of absence from
work and use of health resources. Table 1.3 lists the
health problems that are most commonly asso-
ciated with overweight and obesity. In developed
countries, excessive body weight is also frequently
associated with psychosocial problems.
The risk of developing metabolic complications is
exaggerated in people who have central obesity.
This is related to a number of structural differences
between intra-abdominal and subcutaneous adi-
pose tissues which makes the former more suscep-
tible to both hormonal stimulation and changes in
lipid metabolism. People of Asian descent who live
in urban societies are particularly susceptible to
central obesity and tend to develop NIDDM and
CHD at lower levels of overweight than other
populations.
Overview of the Economic Costs
Conservative estimates clearly indicate that obesity
represents one of the largest costs in national health
care budgets, accounting for up to 6% of total
expenditure in several developed countries (Table
1.4). In the USA in 1995, for example, the overall
direct costs attributed to obesity (through hospital-
izations, outpatients, medications and allied health
professionals’ costs) were approximately the same
as those of diabetes, 1.25 times greater than those of
coronary heart disease, and 2.7 times greater than
those of hypertension (5). The costs associated with
pre-obesity (BMI 25—30 kg/m) are also substantial
because of the large proportion of individuals in-
volved.
The economic impact of overweight and obesity
does not only relate to the direct cost of treatment in
the formal health care system. It is also important to
consider the cost to the individual in terms of ill
health and reduced quality of life (intangible costs),
and the cost to the rest of society in terms of lost
productivity due to sick leave and premature dis-
ability pensions (indirect costs). Overweight and
obesity are responsible for a considerable propor-
tion of both. Thus, the cost of lost productivity
attributed to obesity in the USA in 1994 was $3.9
billion and reflected 39.2 million days of lost work.
In addition, there were 239 million restricted-activ-
ity days, 89.5 million bed-days, and 62.6 million
physician visits.
Estimates of the economic impact of overweight
and obesity in less developed countries are not
available. However, the relative costs of treatment if
available are likely to exceed those in more affluent
countries for a number of reasons. These include the
accompanying rise in coronary heart disease and
other non-communicable diseases, the need to im-
port expensive technology with scarce foreign ex-
change, and the need to provide specialist training
5OBESITY AS A GLOBAL PROBLEM
Table 1.4 Conservative estimates of the direct economic costs of obesity
Country Year Obesity definition Estimated direct costs % National health care costs
USA 1995 BMI P30 US$52 billion 5.7
Australia 1989/90 BMI 930 AUD$464 million 92
Netherlands 1981—89 BMI 925 Guilders 1 billion 4
France 1992 BMI P27 FF 12 billion 2
Table 1.5 Estimated world prevalence of obesity
Population aged P15
years (millions)
Prevalence of
obesity (%)
Approximate estimate (mid-point) of
number of obese individuals (millions)
Established market economies 640 15—20 96—128 (112)
Former socialist economies 330 20—25 66—83 (75)
India 535 0.5—1.0 3—7 (5)
China 825 0.5—1.0 4—8 (6)
Other Asian countries and Islands 430 1—34—12 (8)
Sub-Saharan Africa 276 0.5—1.0 1—3 (2)
Latin America and Caribbean 280 5—10 14—28 (21)
Middle East 300 5—10 15—30 (22)
World 3616 (251)
Source: Seidell (4).
for health professionals. As many countries are still
struggling with undernutrition and infectious dis-
ease, the escalation of obesity and related health
problems creates a double economic burden.
THE GLOBAL OBESITY PROBLEM
The number of people worldwide with a BMI of 30
or above is currently thought to exceed 250 million,
i.e. 7% of the world’s adult population (Table 1.5)
(4). When individual countries are considered, the
range of obesity prevalence covers almost the full
spectrum, from below 5% in China, Japan and
certain African nations to more than 75% in urban
Samoa. It is difficult to calculate an exact global
figure because good quality and comparable data
are not widely available. The assessment in Table
1.5 is a conservative estimate.
Important Issues Associated with Data
Collation
Discussion and comparison of overweight and
obesity rates throughout the world are complicated
by a number of important issues associated with
data collation. The first of these relates to the
limited availability of suitable data for an accurate
assessment of obesity prevalence and trends in dif-
ferent countries. Although it is half a century since
obesity was introduced into the International Clas-
sification of Diseases (ICD), overweight and obesity
are rarely recognized by health professionals as a
distinct disease or cause of death, and so are infre-
quently recorded on morbidity or mortality statis-
tics. This means that we have to rely on BMI data
collected as part of specific health screening surveys
or scientific studies. Unfortunately, very few coun-
tries conduct national surveys on a regular basis,
and even fewer report obesity prevalence. This re-
flects the fact that most national nutrition surveys,
at least in developing countries, are still used to
provide information about undernutrition in
women and young children. The costs and re-
sources required to conduct regular comprehensive
national surveys are a major barrier to implementa-
tion.
The second issue relates to the need for caution
when making comparisons of obesity rates between
studies and countries. Comparison is complicated
by a number of factors including differences in obes-
ity classification systems, mismatched age groups,
inconsistent age-standardization of study popula-
tions, discordant time periods and dates of data
collection, and use of unreliable self-reported
weight and height measurements for calculation of
6 INTERNATIONAL TEXTBOOK OF OBESITY
BMI. In particular, the use of BMI cut-off points
either above or below 30 kg/m to denote obesity
has a great impact on estimates of obesity preva-
lence in a given population. In the US, obesity has
until very recently been routinely classified as a
BMI at or above 27.8 kg/m in men and 27.3 kg/m
in women. With these cut-off points, 31.7% of men
and 34.9% of women were deemed obese in the
period 1988—1994. These estimates fall to 19.9% of
men and 24.9% of women when a BMI of 30 kg/m
is applied. Projects such as the WHO MONICA
(MONItoring of trends and determinants in CAr-
diovascular diseases) study (see below), where data
are collected from a large number of populations in
the same time periods according to identical proto-
cols, are particularly valuable for comparison pur-
poses.
A third issue is the need to be aware that many
countries such as Brazil and Mexico show great
variation in wealth by region. Combining data from
all areas into a single country figure, or from a
number of countries into a regional figure, is likely
to mask patterns of relationships between social
variables and obesity.
Current Prevalence of Obesity
Despite the limited availability and fragmentary
nature of suitable country-level data, it is clear that
obesity rates are already high and increasing rapid-
ly in all regions of the world. Table 1.6 shows the
most current estimates of obesity prevalence, ac-
cording to a BMI of 30 or greater, in a selection of
countries from around the globe. Nationally repre-
sentative data sets based on measured weight and
height are presented where possible.
Examination of Table 1.6 reveals large variations
in obesity prevalence between countries, both with-
in and between regions. In Africa, for example,
obesity rates are extremely high among women of
the Cape Peninsula but very low among women in
Tanzania.
Much of the developed world already has excep-
tionally high levels of overweight and obesity. In
Europe, obesity prevalence now ranges from about
6 to 20% in men and from 6 to 30% in women.
Rates are highest in the East (e.g. Russia, former
East Germany and Czech Republic) and lowest in
some of the Central European and Mediterranean
countries. Recent data from the Russian Longitudi-
nal Monitoring Survey indicate that Russia has a
particularly serious obesity problem, especially
among women where 28% of the population was
obese in 1996. Results from the Italian National
Health Survey indicate that Italy has one of the
lowest levels of obesity in Europe. However, the
Italian data may be underestimated due to self-
reporting of weight and height measurements.
National figures for North America are similar to
those of Europe, with approximately 20% of males
and 25% of females currently obese in the USA, and
15% of all adults obese in Canada. Rates in the
general populations of Australia and New Zealand
are also in the range of 15—18%. Japan, at less than
3%, still has a very low level of obesity for an
industrialized country.
In the oil-exporting countries of the Middle East,
the adult populations appear to have a major obes-
ity problem. Women in particular are affected, with
prevalence several fold higher than that reported for
many industrialized countries. Bahrain (urban),
Kuwait, Jordan, Saudi Arabia (urban), and the
United Arab Emirates all document female obesity
rates well above 25%.
The highest obesity rates in the world are found
in the Pacific Island populations of Melanesia,
Polynesia and Micronesia. In urban Samoa, for
example, approximately 75% of women and 60% of
men were classified as obese in 1991. These figures
correspond with some of the highest rates in the
world of diabetes and other related chronic dis-
eases. With regard to obesity, it should be noted
that the prevalence figures may be slightly exag-
gerated because Polynesians are generally leaner
than Caucasians at any given BMI.
From a nutrition perspective, research and policy
in many Asian and lower-income countries have
focused on undernutrition. However, there are clear
indications that a number of these countries are
now beginning, or are already experiencing, high
levels of overweight and obesity. Urban China, ur-
ban Thailand, Malaysia and the Central Asian
countries that were members of the Societ Union
before 1992 (such as Kyrgyzstan) are all examples.
Overweight is also becoming a serious problem in
urban India, most notable in the upper-middle
class. The situation in China and India is further
complicated by the fact that chronic energy defi-
ciency is still a major problem for large parts of the
population.
7OBESITY AS A GLOBAL PROBLEM
Table 1.6 Prevalence of obesity (BMI P 30 kg/m) in a selection of countries
Prevalence of
obesity (%)?
Country Year Age Men Women
Europe Finland 1991/93 20—75 14 11
Netherlands 1995 20—59 8.4 8.3
UK England 1997 16—64 17 20
Scotland 1995 16—64 16 17
?Italy 1994 15; 6.5 6.3
France 1997? 15; 8.6 8.4
Czech Republic 1995 20—65 22.6 25.6
former East Germany 1992 25—69 21 27
former West Germany 1990 25—69 17 19
Russia 1996 Adults 10.8 27.9
North America Canada 1991 18—74 15 15
USA 1988—94 20—74 19.9 24.9
Central and Mexico (urban) 1995 Adults 11 23
South America Brazil 1989 25—64 5.9 13.3
Curac¸ao 1993/94 18; 19 36
Middle East Iran, Islamic 1993/94 20—74 2.5 7.7
Republic of (south)
Cyprus 1989/90 35—64 19 24
Kuwait 1994 18; 32 44
Jordan (urban) 1994—96 25; 32.7 59.8
Bahrain (urban) 1991/92 20—65 9.5 30.3
Saudi Arabia 1990/93 15; 16 24
Australasia Australia (urban) 1995 25—64 18.0 18.0
and Oceania New Zealand 1989 18—64 10 13
Samoa (urban) 1991 25—69 58.4 76.8
Papua New Guinea 1991 25—69 36.6 54.3
(urban)
South and East Japan 1993 20; 1.7 2.7
Asia India (urban Delhi 1997 40—60 3.19 14.28
middle class)
China 1992 20—45 1.2 1.64
Malaysia 18—60 4.7 7.9
Singapore@ 1992 Adults 4 6
Kyrgyzstan 1993 18—59 4.2 10.7
Africa Mauritius 1992 25—74 5.3 15.2
Tanzania 1986/89 35—64 0.6 3.6
Rodrigues (Creoles) 1992 25—69 10 31
Cape Peninsula 1990 15—64 7.9 44.4
(Coloured)
?Data are from the Italian National Health Survey and are self-reported.
@Obesity criterion: BMI P31 kg/m.
A similar picture is emerging in Central and
South America. Mexico and Brazil are already ex-
periencing high levels of obesity, especially among
low income and urban populations. Within the Af-
rican region too, there are clear pockets where obes-
ity is already a major problem. These include the
coloured population of Cape Peninsula and the
multiethnic island nation of Mauritius. Only the
very underdeveloped countries of Africa appear to
be avoiding the worldwide epidemic of obesity, al-
though the lack of good quality data makes it diffi-
cult to judge their true weight status.
8 INTERNATIONAL TEXTBOOK OF OBESITY
Recent Trends
Good quality data on trends in body composition
are even harder to find than cross-sectional data on
prevalence at one point in time, especially for coun-
tries outside Europe and the US. Fortunately, na-
tionally representative or large nationwide data sets
are now available for a small number of lower and
middle income countries including Brazil, China,
Mauritius, Western Samoa and Russia.
The countries of North America and Europe
have seen startling increases in obesity rates over
the last 10—20 years. In Europe, the most dramatic
rise has been observed in England, where obesity
prevalence more than doubled from 6% to 17% in
men and from 8% to 20% in women after 1980.
Prevalence has increased by about 10—40% over the
last 10 years in the majority of other European
countries.
Obesity rates in the USA have increased from
10.4% to 19.9% and from 15.1% to 24.9% in men
and women, respectively, over the period
1960—1962 until 1988—1994. The largest increases,
however, occurred from the period 1976—1980 on-
wards. In Japan, although overall rates of obesity
remain below 3%, prevalence increased by a factor
of 2.4 in the adult male population and by a factor
of 1.8 in women aged 20—29 years.
Russia has seen a consistent increase in adult
obesity from 8.4% to 10.8% in men and from 23.2%
to 27.9% in women in only 4 years. This is despite
marked shifts toward a lower fat diet in the post-
reform period, during which price subsidies of meat
and dairy products were removed. However, year-
to-year fluctuations underscore the fact that the
economy is in flux and that these changes cannot be
used to predict trends. It is also worth noting that
the prevalence of pre-obesity declined slightly be-
tween 1992 and 1994 in females but not in males.
Trend data from the western Pacific Islands indi-
cate that obesity levels are not only high in these
populations, but that the prevalence of obesity con-
tinues to increase considerably in each island (6).
Data from two comparable national surveys in
Brazil conducted 15 years apart show that adult
obesity has increased among all groups of men and
women, especially families of lower income. Nation-
al figures increased from 3 to 6% in men and from 8
to 13% in women. It is also of interest that the ratio
between underweight and overweight—a measure
of the relative importance of each problem in the
population—changed dramatically between 1974
and 1989. This reversed from a ratio of 1.5: 1 (under-
weight to overweight) in 1974 to a ratio of less than
0.5: 1 in 1989 (7).
The level of obesity among Chinese adults re-
mains low, but the marked shifts in diet, activity and
overweight suggest that major increases in over-
weight and obesity will occur. During the most
recent period of the national China Health and
Nutrition Survey (CHNS), an ongoing longitudinal
survey of eight provinces in China, data show a
consistent increase in adult obesity in both urban
and rural areas. Changes in diet and activity pat-
terns are rapid in urban residents of all incomes but
are even more rapid in middle and higher income
rural residents.
Few countries seem to have escaped the rapid
escalation in obesity rates in the last two decades.
The Netherlands, Italy and Finland are rare excep-
tions where population height and weight data col-
lected over this period indicate only small increases
or even stabilization of the rates of obesity.
The MONICA Study
The WHO MONICA project provides a compre-
hensive set of obesity prevalence data from cities
and regions. Information was collected in two risk
surveys, conducted approximately 5 years apart
from 38 populations. Most surveys were conducted
in European cities but there were a few centres in
North America, Asia and Australasia. Although
they are not national data, they were collected from
over 100 000 randomly selected participants aged
35 to 64 years, are age-standardized and are based
on weights and heights measured with identical
protocols. This provides a high level of confidence
in the detailed analysis of the data, including com-
parisons between centres and observations over
time. Such analysis is rarely possible with less rigor-
ously collected data sets.
Analysis of the results from the first round of data
collection between 1983 and 1986 showed that the
average prevalence of obesity among European
centres participating in the study was 15% in men
and 22% in women, with the lowest in Sweden
(Go¨ teborg: 7% in men, 9% in women) and the
highest in Lithuania (Kaunas: 22% in men, 45% in
women).
9OBESITY AS A GLOBAL PROBLEM
The average age-standardized absolute changes
in the prevalence of obesity over 5 years showed
that rates increased in three-quarters of the popula-
tions for men and in half of the populations for
women (8). The largest increases were observed in
Catalonia, where there was a 9.4% rise in absolute
prevalence in men and a 6.5% rise in women. A
small number of populations actually saw a statisti-
cally significant decrease in obesity prevalence over
the 5-year period. The most notable of these was in
Ticino (Switzerland), where absolute rates fell by
11.7% in men and 9.6% in women. Charleroi in
Belgium saw a 14.9% decrease in obesity prevalence
in women but not in men.
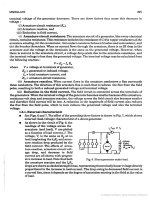
Future Projections
Worldwide growth in the number of severely over-
weight adults is expected to be double that of under-
weight adults between 1995 and 2025. Figure 1.2
presents some crude projections of the expected rise
in obesity rates over the next 25 years for five of the
countries included in Table 1.6. These estimates are
based on a simple linear extrapolation of increases
observed over the period 1975—1995 and indicate
that by the year 2025, obesity rates could be as high
as 40—45% in the USA, 30—40% in Australia, Eng-
land and Mauritius, and over 20% in Brazil. It has
even been suggested that, if current trends persist,
the entire US population could be overweight with-
in a few generations (9).
KEY FEATURES AND PATTERNS OF
THE GLOBAL OBESITY EPIDEMIC
Closer analysis of obesity prevalence and trend data
from around the world reveals a number of interest-
ing patterns and features. These include an increase
in population mean BMI with socioeconomic tran-
sition, a tendency for urban populations to have
higher rates of obesity than rural populations, a
tendency for peak rates of obesity to be reached at
an earlier age in the less developed and newly indus-
trialized countries, and a tendency for women to
have higher rates of obesity than men. These and
others are considered in some detail below.
Socioeconomic Status
Socioeconomic status (SES) is a complex variable
that is commonly described by one or more simple
indicators such as income, occupation, education
and place of residence. Substantial evidence sug-
gests that high SES is negatively correlated with
obesity in developed countries, particularly among
women, but positively correlated with obesity in
populations of developing countries. As developing
countries undergo economic growth, the positive
relationship between SES and obesity is slowly re-
placed by the negative correlation seen in modern
societies (see below, ‘What is Driving the Global
Obesity Epidemic?’
Modern Societies
In developed countries there is usually an inverse
association between level of education and rates of
obesity that is more pronounced among women. In
the MONICA survey, a lower educational level was
associated with higher BMI in almost all female
populations (both surveys) and in about half of
male populations. Between the two surveys, there
was a strengthening of this inverse association and
the differences in relative body weight by education
increased. This suggests that socioeconomic in-
equality in health consequences associated with
obesity may actually be widening in many countries
(10). One analysis has shown that reproductive his-
tory, unhealthy dietary habits, and psychosocial
stress may account for a large part of the associ-
ation between low SES and obesity among middle-
aged women (11).
There is some evidence to suggest that there are
racial differences between BMI and SES in develop-
ed countries. Although women in the USA with low
incomes or low education are more likely to be
obese than those of higher SES overall, this associ-
ation was not found in a large survey of Mexican
American, Cuban American, and Puerto Rican
adults (12). Similar findings have been reported for
young girls where a lower prevalence of obesity was
seen at higher levels of SES in white girls, but no
clear relationship was detected in black girls (13),
who tend to have much higher overall rates of obes-
ity.
10 INTERNATIONAL TEXTBOOK OF OBESITY
Figure 1.2 Projected increases in obesity prevalence. The figure illustrates the rate at which obesity prevalence is increasing in selected
countries. It is based on crude projections from repeated national surveys. Source: IOTF unpublished
Developing and Transition Societies
New evidence from India illustrates the positive
association between SES and obesity in developing
countries. Nearly a third of males, and more than
half of females, belonging to the ‘upper middle class’
in urban areas are currently overweight (BMI
9 25). This is in stark contrast to the prevalence of
overweight among slum dwellers (see Table 1.7)
(14).
In Latin American and a number of Caribbean
countries, a recent assessment of maternal and child
obesity from national surveys since 1982 also found
a tendency for higher obesity rates in poorly
educated women throughout the region, except in
Haiti and Guatemala where the reverse was true.
Urban Residence
Urban populations tend to have higher rates of
obesity than rural populations, especially in less
developed nations. Urbanization causes people to
move away from their traditional way of living and
is associated with a wide range of factors which
adversely affect diet and physical activity levels.
These include a shift to sedentary occupations, de-
pendency on automated transport, reliance on
processed convenience foods, and exposure to
aggressive food marketing and advertising. Detri-
mental changes to family structures and value sys-
tems may also be an important contributor to re-
duced physical activity and poor diet associated
with this shift.
In most countries, urbanization has led to popu-
lations consuming smaller proportions of complex
carbohydrates, greater proportions of fats and ani-
mal products, more sugar, more processed foods,
and more foods consumed away from home. Ur-
banization also has effects on physical activity
levels. In Asian cities, bicycles are rapidly being
displaced by motorbikes and cars with nearly
11OBESITY AS A GLOBAL PROBLEM
Table 1.7 Prevalence of overweight (BMI 925) in urban
adults by socioeconomic status in Delhi, India
% Overweight
Socioeconomic status Males Females
Middle class
1. High 32 50
2. Middle 16 30
3. Low 7 28
Slum (poor) 1 4
Source: Gopalan (14).
20–24 25–29 30–34 35–39 40–44 45–49 50–54 55–59
Age (years)
MEN WOMEN
%
0
10
20
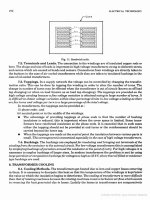
Figure 1.3 Obesity prevalence across the lifespan in the Neth-
erlands. There is a consistent rise in the prevalence of obesity
throughout all age groups in the Dutch population, reaching a
peak in the seventh decade. Source: Seidell (15)
10 000 cars being added to the automobile fleet
every month in Delhi. Meanwhile the rural popula-
tions are mainly engaged in agricultural occupa-
tions involving manual labour and a fairly high
level of physical activity.
Steady urban migration has been an important
feature of the ongoing developmental transition in
all developing countries. Asia’s urban population is
expected to exceed 1242 million by the year 2000, a
more than fivefold increase since 1950. This process
is expected to continue in the decades to follow. By
2025, the world’s urban population is expected to
reach 5 billion (61% of the world’s people), of whom
77% will live in less developed countries.
Age
Figure 1.3 shows the general pattern of overweight
and obesity in the Netherlands, where a general rise
in body weight and a modest increase in percentage
body fat occur over the lifespan, at least until 60—65
years of age. This is reflected by an increase in
obesity prevalence with age, reaching a maximum
in the 60s, and then declining steadily thereafter.
The decline is related in part to selective survival of
people with a lower BMI. The issue is further com-
plicated by the fact that BMI is not as reliable a
measure of adiposity in old age because a decrease
during this period often reflects a decrease in lean
body mass rather than fat mass.
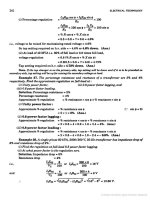
Peak rates of obesity and the associated health
effects tend to be reached at a much earlier age in
developing economies. In countries such as West-
ern Somoa, the maximum rates of obesity tend to be
reached at around 40 years of age (Figure 1.4).
Obesity rates tend to decline in age groups older
than this in association with the high mortality that
accompanies the rapidly developing diabetes and
cardiovascular disease (CVD).
Gender Differences
More women than men tend to be obese whereas
the reverse is true for overweight (BMI .25). This
can be seen in countries as diverse as England,
Mauritius, Japan and Saudi Arabia.
There are likely to be many social influences that
differentially influence male and female food intake
and energy expenditure patterns. However, it is
clear that biological and evolutionary components
are also important factors underlying the differen-
ces in rates of obesity between the sexes. In all
populations, from contemporary hunting and
gathering groups to those in complex industrial
countries, women have more overall fat and much
more peripheral body fat in the legs and hips than
men. In addition, there appears to be a tendency for
females to channel extra energy into fat storage in
contrast to men who utilize a higher proportion of
the energy to make protein and muscle. These gen-
der differences are believed to be associated with the
need for adequate fat deposits to ensure reproduc-
tive capacity in females. Men have, proportionally,
much more central body fat. They also have a high-
er proportion of lean muscle mass which leads to a
higher basal energy expenditure.
12 INTERNATIONAL TEXTBOOK OF OBESITY
Figure 1.4 Obesity prevalence across the lifespan in Western Samoa. Peak rates of obesity are reached at around 40 years in
communities of Western Samoa. Source: Hodge et al. (16)
High-risk Groups for Weight Gain
Minority Populations in Industrialized
Countries
In many industrialized countries, minority ethnic
groups are especially liable to obesity and its com-
plications. Some researchers believe that this is the
result of a genetic predisposition to store fat which
only becomes apparent when the individuals are
exposed to a positive energy balance promoted by
modern lifestyles. Central obesity, hypertension and
NIDDM are very common in urban Australian
Aborigines, but can be reduced or even eliminated
within a very short time by simply reverting to a
more traditional diet.
It is likely that other factors, especially those
associated with poverty, may also have a role to
play in the far higher levels of obesity and its com-
plications observed in minority populations. In na-
tive American and African American populations,
for instance, where poverty is common, low levels of
activity stem from unemployment and poor diets
reflect dependence on cheap high-fat processed
foods. Rates of hypertension among African Ameri-
can females below the poverty level are 40% com-
pared with 30% of those at or above the poverty
level. The particularly high levels of obesity among
minority groups living in the USA are illustrated
clearly in Figure 1.5.
Vulnerable Periods of Life
As outlined above, a general rise in body weight and
a modest increase in percent body fat can be ex-
pected with age. However, there are certain periods
of life when an individual may be particularly vul-
nerable to weight gain (Table 1.8).
Other Factors Promoting Weight Gain
A number of other groups have been identified as
being at risk of weight gain and obesity for genetic,
biological, lifestyle and other reasons. These include
family history of obesity, smoking cessation, excess-
ive alcohol intake, drug treatment for a wide range
of medical conditions, certain disease states,
changes in social circumstance, and recent success-
ful weight loss. Major reductions in activity as a
result of, for example, sports injury can also lead to
substantial weight gain when there is not a compen-
satory decrease in habitual food intake.
WHAT IS DRIVING THE GLOBAL
OBESITY EPIDEMIC?
The Changing Environment
Although research advances have highlighted the
importance of leptin and other molecular genetic
13OBESITY AS A GLOBAL PROBLEM
Figure 1.5 Obesity prevalence among ethnic groups in the USA, illustrating the disparity that exists between different ethnic groups,
particularly amongst women, in the level of overweight and obesity in the USA. Source: Flegal et al. (17)
factors in determining individual susceptibility to
obesity, these cannot explain the current obesity
epidemic. The rapid rise in global obesity rates has
occurred in too short a time for there to have been
any significant genetic modifications within popu-
lations. This suggests that changes to the environ-
ment—physical, socio-cultural, economic and pol-
itical—are primarily responsible for the epidemic
and that genetics, age, sex, hormonal effects and
other such factors influence the susceptibility of
individuals to weight gain who are living in that
environment.
There are a number of societal forces which
underlie the environmental changes implicated in
the obesity epidemic. These include modernization,
economic restructuring and transition to market
economies, increasing urbanization, changing occu-
pational structures, technical and scientific develop-
ments, political change, and globalization of food
markets. Many of these factors are associated with
improved standards of living and other societal ad-
vances but urban crowding, increasing unemploy-
ment, family and community breakdown, and dis-
placement of traditional foodstuffs by Westernized
high-fat products and other negative changes have
also been a product of this process. The end result is
often a move to weight-gain-promoting dietary
habits and physical activity patterns.
Economic Growth and Modernization
A key factor in the global coverage of the obesity
epidemic, particularly with respect to developing
and transition countries, is economic growth. Rapid
urbanization, changing occupational structures and
shifts in dietary structure related to socioeconomic
transition all affect population mean BMI. Demo-
graphic shifts associated with higher life expectancy
and reduced fertility rates, as well as shifts in pat-
terns of disease away from infection and nutrient
deficiency towards higher rates of non-communi-
cable diseases, are other components of this so-
called ‘transition’.
14 INTERNATIONAL TEXTBOOK OF OBESITY
Table 1.8 Vulnerable periods of life for weight gain and the
development of future obesity
Prenatal Poor growth and development of the unborn
baby can increase the risk of abdominal fatness,
obesity and related illness in later life.
Adiposity
rebound
(5—7 years)
‘Adiposity rebound’ describes a period, usually
between the ages of 5 and 7, when BMI begins
to increase rapidly. This period coincides with
increased autonomy and socialization and so
may represent a stage when the child is
particularly vulnerable to the adoption of
behaviours that both influence and predispose
to the development of obesity. Early adiposity
rebound may be associated with an increased
risk of obesity later in life.
Adolescence This is a period of increased autonomy which is
often associated with irregular meals, changed
food habits and periods of inactivity during
leisure combined with physiological changes.
These promote increased fat deposition,
particularly in females.
Early
adulthood
Early adulthood is often associated with a
marked reduction in physical activity. This
usually occurs between the ages of 15 and 19
years in women but as late as the early 30s in
men.
Pregnancy The average weight gain after pregnancy is less
than 1 kg although the range is wide. In many
developing countries, consecutive pregnancies
with short spacing often result in weight loss
rather than weight gain.
Menopause Menopausal women are particularly prone to
rapid weight gain. This is primarily due to
reductions in activity although loss of the
menstrual cycle also affects food intake and
reduces metabolic rate slightly.
Source: Gill (18).
Effect on BMI Distribution
Improvement in the socioeconomic conditions of a
country tends to be accompanied by a population-
wide shift in BMI so that problems of overweight
eventually replace those of underweight (Figure
1.6). In the early stages of transition, undernutrition
remains the principal concern in the poor whilst the
more affluent tend to show an increase in the pro-
portion of people with a high BMI. This often leads
to a situation where overweight coexists with
underweight in the same country. As transition pro-
ceeds, overweight and obesity also begin to increase
among the poor.
Even in affluent countries, the distribution of
body fatness within a population ranges from
underweight through normal to obese. When the
mean population BMI is 23 or below, there are very
few individuals with a value of 30 kg/m or greater.
However, when mean BMI rises above 23 kg/m,
there is a corresponding increase in the prevalence
of obesity. An analysis by Rose (20) of 52 communi-
ties in the large multi-country INTERSALT Study
found that there is a 4.66% increase in the preva-
lence of obesity for every single unit increase in
population BMI above 23 kg/m (Figure 1.7).
The ‘Nutrition Transition’
Generally, as incomes rise and populations become
more urban, diets high in complex carbohydrates
and fibre give way to varied diets with a higher
proportion of fats, saturated fats and sugars. Recent
analyses of economic and food availability data,
however, reveal a major shift in the structure of the
global diet over the last 30 years. Innate preferences
for palatable diets coupled with the greater avail-
ability of cheap vegetable oils in the global econ-
omic have resulted in greatly increased fat con-
sumption and greater dietary diversity among low
income nations. As a result, the classic relationship
between incomes and fat intakes has been lost, with
the so-called ‘nutrition transition’ now occurring in
nations with much lower levels of gross national
product than previously. The process is accelerated
by rapid urbanization (21).
The Relationship Between Undernutrition
and Later Obesity
In countries undergoing transition where overnu-
trition coexists with undernutrition, the shift in
population weight status has been linked to exag-
gerated problems of obesity and associated non-
communicable diseases in adults.
Recent studies have shown that infants who were
undernourished in utero and then born small have a
greater risk of becoming obese adults (22,23). In
particular, poor intrauterine nutrition appears to
predispose some groups to abdominal obesity and
results in an earlier and more severe development of
comorbid conditions such as hypertension, CHD
and diabetes (24—26). The apparent impact of in-
trauterine nutrition on the later structure and func-
tioning of the body has become known as ‘program-
ming’ and is often referred to as the ‘Barker
hypothesis’, after one of the key researchers in-
volved in developing this concept.
15OBESITY AS A GLOBAL PROBLEM
Figure 1.6 BMI distribution for various adult populations worldwide (both sexes). As the proportion of the population with a low
BMI decreases there is a consequent increase in the proportion of the population with an abnormally high BMI. Many countries have a
situation of unacceptably high proportions of both under- and overweight. Source: WHO (19)
Figure 1.7 The relationship between population mean BMI and the prevalence of obesity, illustrating the direct association between
population mean BMI and the prevalence of deviant (high) BMI values across 52 population samples from 32 countries (men and
women aged 20—59 years). r : 0.94; b : 4.66% per unit BMI. Source: Rose (20)
16 INTERNATIONAL TEXTBOOK OF OBESITY