drug–dna interaction protocols
Bạn đang xem bản rút gọn của tài liệu. Xem và tải ngay bản đầy đủ của tài liệu tại đây (17.62 MB, 274 trang )
1
DNase I Footprinting
Keith R. Fox
1. Introduction
Footprmtmg provides a simple, quick, and reasonably mexpensive method
for assessing the sequence specific mteraction of ligands with DNA. Although
the techmque was developed in 1978 for studying the mteraction of DNA-
binding proteins with then target sites
(I),
it has proved invaluable for deter-
mining the sequence specificity of many small hgands
1.1. Footprinting ,
Footprmting is essentially a protection assay, m which cleavage of DNA is
inhibited at discrete locations by the sequence specific binding of a hgand or
protein. In this technique, a DNA fragment of known sequence and length (typi-
cally a restriction fragment of 100-200 bp), which has been selectively radiola-
beled at one end of one strand, IS lightly dtgested by a suitable endonucleolytic
probe m the presence and absence of the drug under investigation The cleav-
age agent is prevented from cutting around the drug-binding sites so that, when
the products of reaction are separated on a denaturing polyacrylamide gel and
exposed to autoradiography, the position of the ligand can be seen as a gap m
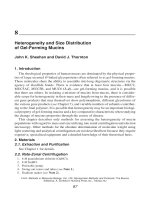
the otherwise continuous ladder of bands (see Fig. 1). In this figure, cleavage
at position “a” will produce, after denaturing the DNA, one long fragment (9
bases) corresponding to the left hand strand, and two short fragments (7 bases
and 2 bases) from cleavage of the right hand strand. Since the bands are located
by autoradiography, only the shortest of these species bearing the radioactive
label will be visualized. The condittons of the cleavage reaction are adjusted so
that, on average, each DNA fragment is cut no more than once. As a result,
each of the bands on the autoradiograph is produced by a single cleavage event,
i.e., single-hit kmetics. If an excessive amount of cleavage agent is used, then
From Methods m Molecular Biology, Vol 90 Drug-DNA Interactron Protocols
Edited by K R Fox Humana Press Inc , Totowa. NJ
1
Fox
gel eleotrophoresis
Fig 1 Schemattc representation of the footprtntmg experiment The DNA is labeled
(*) at the 3’ end of the right-hand strand
labeled products can arose from more than one cleavage event, biasing the dls-
tribution of fragments toward short products. In general, the extent of cleavage
1s adjusted so that between 60 and 90% of the radtolabeled DNA remains uncut,
though longer fragments require greater amounts of digestion to produce suit-
able
band intensities.
DNase I footprmtmg has been successfully employed for mdentrfymg or
conlirmmg the preferred DNA binding sites for several hgands mcludmg acti-
nomycm (2-4), mtthramycin (5), quinoxalme antrbrotrcs (6,7), daunomycm
(8,9), nogalamycin (1/J), vartous minor groove binding agents (2,3,12), and
triplex binding ohgonucleottdes (12,13). Various other cleavage agents, both
enzymrc and chemical, have also been used as footprinting probes for drug-
DNA
interactions including micrococcal nuclease (24), DNase II (6,15), cop-
per phenanthrolme (16,17), methtdiumpropyl-EDTA.Fe(II) (MPE) (18-21),
uranyl photocleavage (22,23), and hydroxyl radicals
(24-26). Each of these
has a different cleavage mechanism, revealmg different aspects of drug-DNA
interactions.
An ideal footprmtmg agent should be sequence neutral and generate an even
ladder of DNA cleavage products in the absence of the hgand This property is
almost achieved by certain chemical probes, such as MPE and hydroxyl radi-
cals. However, the most commonly used cleavage agent (because of its cost
and ease of use) 1s the enzyme DNase I, which produces an uneven cleavage
pattern that varies according DNA sequence and local structure
(see Subhead-
ing 1.2.). Cleavage at mdrvtdual phosphodiester bonds can vary by over an order
DNase I Foo tprinting
3
of magnitude m a manner determined by both local and global DNA structure
(27,28). In addltlon, drugs that modrfy DNA structure can induce enhanced
DNase I activity m regions surroundmg their binding sites if they alter the
DNA structure so as to render it more suscepttble to cleavage (3,6,15,29,30).
This IS most frequently seen m regions that are particularly refractory to cleav-
age m the drug-free controls.
1.2. DNase I
DNase I 1s a monomeric glycoprotem of mol wt 30,400. It IS a double strand-
specific endonuclease, which introduces single strand nicks m the phosphodiester
backbone, cleaving the 03’-P bond. Single stranded DNA is degraded at least
four orders of magmtude more slowly (32,32). The enzyme requires divalent
cations and shows opttmal actlvlty m the presence of calcmm and magnesium
(33). Although it cuts all phosphodiester bonds, and it does not
possess
any
simple sequence dependency, its cleavage
pattern
1s very uneven and 1s thought
to reflect variations m DNA structure (27,34). In particular, A, * T, tracts and
GC-rich regions are poor substrates for the enzyme. The most important fac-
tors affecting Its cleavage are thought to be mmor groove width (27,28) and
DNA flexibility (35,36).
Several crystal structures have been determined for both the enzyme and its
complex with oligonucleotides (37-42). These show that DNase I bmds by
inserting an exposed loop mto the DNA minor groove, Interacting with the
phosphate backbone, as well as the walls of the groove. This explains why
cleavage is poor in regions, such as A,, * T, tracts on account of their narrow
minor groove, to which the enzyme cannot bind. An additional feature of these
crystal structures 1s that the DNA 1s always bent by about 2 lo toward the major
groove, away from the enzyme. If this bendmg 1s a necessary feature of the
catalytic reaction, then rigid regions, such as GC-rich sequences, may be refrac-
tory to cleavage. However, these factors do not explain the very different cutting
rates that are often observed at adjacent dinucleotide steps. It 1s possible that this
is determined by precise orientation of the sclssile phosphodlester bond, How-
ever, the crystal structures show that there may be other specific interactions
between the exposed loop and DNA bases removed from the cutting site. In
particular, tyrosme-76 mteracts with the base 2 posItIons to the 5’ side of the
cutting site and arginme-4 1 binds to the base at position -3. This latter mterac-
tion 1s sterically hindered by a GC base pair in thts position. By examining the
characteristics of several good DNase I cleavage sites, Herrera and Chaires
(43) suggested that the best cleavage site was WYWIWVN (where W = A or T,
Y = C or T, and V = any base except T).
The DNA-binding surface of DNase I covers about 10 bp, i.e., one complete
turn the DNA helix. This has tmportant consequences for interpreting
4
A
Fox
B
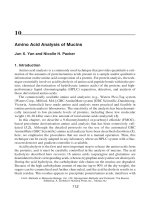
Fig 2. Schemattc representatron of the 3’staggered cleavage produced by DNase I
The DNA helix has been opened out and IS viewed along the minor groove The
hatched box represents DNase I. the tilled box represents a DNA-binding ligand
footprmtmg results and explams the observatton that the enzyme overesttmates
drug-binding site sizes Although DNA bases he perpendtcular to the hellcal
axis, they are mclmed relative to the phosphodtester backbone. As a result, clos-
est phosphates, postttoned across the minor groove, are not attached to a single
base pan, but are staggered by about 2-3 bases m the 3’ direction. This is illus-
trated m Fig. 2A, m which the DNA has been drawn lookmg along the minor
groove, showmg the inclmatton of the DNA base pans. Since DNase I (hatched
box) binds across this groove, its bmdmg sate on the top strand 1s located 2 bases
to the 3’ side of that on the lower strand. When a DNA-binding hgand is added
(filled box in Fig. 2B), it can
be seen
that the closest approach of the enzyme is
not the same on each strand. DNase I can approach closer to the enzyme on the
lower strand; the region of the upper strand protected extends by about 2 bases
beyond the actual ligand-bmdmg sate. As a result, DNase I footprmts are stag-
gered by about 2-3 bases m the 3’ direction across the two strands
2. Materials
2.1. DNase I
For most footprintmg experiments the DNase I does not need to be espe-
cially pure. There 1s ltttle advantage m purchasmg HPLC-pure, RNase-free
enzymes. Currently purchased 1s the type IV enzyme, from bovme pancreas,
from Sigma (St. Louis, MO). This should be dtssolved m 0.15 MNaCl contam-
ing 1 mMMgC1, at a concentratton of 7200 Kumtz U/mL. Thts can be stored at
-20°C, and is stable to frequent freezing and thawing. The enzyme 1s diluted to
workmg concentrattons immedtately before use; the remainder of the diluted
enzyme should be discarded
DNase I Footprinting
5
Table 1
Sequence of the tyrT DNA Fragment
AATTCCGGTTACCTTTAATCCGTTACGGATGAAAATTACGC~CCAGTTCATTTTTCTC~CGT~CAC
0 10 20 30 40 50 60
3'-AAGGCCAATGGAAATTAGGCAATGCCTACTACTTTT~TGCGTTGGTC~GT~GAGTTGCATTGTG
TTTACAGCGGCGCGTCATTTGATATGATGCGCCCCGCTTCCCGAT~GGGAGCAGGCCAGT~GCATT
70 80 90 100 110 120 130
AAATGTCGCCGCGCAGTAAACTATACTACGCGGGGCGAAG
ACCCCGTGGTGGGGGTTCCC
140
150
TGGGGCACCACCCCCAAGGGCT-5'
The fragment IS obtained by cutting with
EcoRI
and AvuI a-32P-dATP IS used to label the 3’ end of
the lower strand, whereas a-32P-dCTP IS used to label the upper strand
2.2. Choice of DNA Fragment
2.2.1. Natural DNA Fragments
For footprinting experiments, the length of fragment used depends on both
convenience (how easily a specific fragment can be generated) and the resolu-
tion limit of the polyacrylamide gels. The chosen fragment length is typically
between 50 and 200 bp. Although different laboratories have adopted different
natural fragments as standard substrates for footprmtmg experiments, a few have
been used more widely Among these are the 160 bp tyrT fragment (sequence
shown m Table 1) t&8)), the EcoRI-PvuII fragments from PBS (Stratagene)
(4&M), and several fragments from pBR322 (HindIII-HueIII, HindIII-AM,
or EcoRI-RsaI). The plasmids from which these can be prepared are available
from commercial sources or from the author’s laboratory. In many ways it
would be convenient if a few fragments did become recognized standards, since
this would facilitate direct comparison of the relattve specrfictttes of hgands
prepared in different laboratories. Since many sequence selective small mol-
ecules have recognition sites of between 2 and 4 bp, there is a reasonable prob-
ability that their preferred sites will be present in a lOO- to 200-bp restriction
fragment. However, it should be noted that there are 2 different bp, 10 different
dmucleotides, 32 trmucleotides, 136 tetranucleotides, 5 12 pentanucleotides,
and 2080 hexanucleotides. It can therefore be seen that the chance of finding a
particular binding site within a given DNA fragment becomes more remote the
greater the selectivity of the ligand. A further complicatmg factor is that,
although many ltgands spectfically recognize only a dmucleotlde step, their
binding affinity is often influenced by the nature of the surrounding bases,
6 Fox
which alter the local DNA structure (47-49). It IS therefore possible that using
a natural fragment may fail to detect the optimum bmdmg sites for the most
selective hgands. This becomes especially relevant since many novel synthetic
ligands possess enhanced sequence recogmtton properties, with binding sites
of eight or more base pairs.
2.2.2. Synthetic Oligonucleotides
As explamed, although footprmtmg experiments with natural DNA frag-
ments provide a reasonable estimate of a ligand’s preferred bmdmg sites, these
are complicated by the limited number of sequences studied, together with
ambiguities over the exact bmdmg site within a larger footprmt. The next step
m confirmmg the sequence preference may be to prepare a synthetic DNA
fragment containing the putative binding site and to use this as a substrate for
footprmting experiments (50,51). In addition, for compounds that have been
produced as the result of rational design, one may be able to predict their pre-
ferred bmdmg site. Synthesis of suitable length ohgonucleotides (50 bases or
longer) IS now routine. However, the results obtained with short oligonucle-
otides need to be interpreted with caution and rigorously controlled for several
reasons. First, binding sites located close to the ends of short ohgonucleotides
may not adopt the same configuration as when located within longer sequences
because of “end effects.” Second, smce the synthetic fragments will contam
only one or two binding sites, it is necessary to ensure that other sequences
with equal or greater affinity have not been excluded. This can be investigated
by comparing the mteraction with other closely related sequences, m which
one or two bases m or around the cognate sequence are altered m turn. Analy-
sis is simphfied further if the variant sites are contamed withm the same DNA
fragment.
2.2.3. Synthetic Fragments
A frequent variant on the above is to clone the synthetic oligonucleottdes
mto longer DNA fragments. This removes the problems associated with end
effects and provides other common flanking sequences to which ligand bind-
ing can be compared. An added advantage is that, once it has been cloned, the
sequence can be readily isolated from bacteria. The authors usually clone syn-
thetic ohgonucleotides mto the BamHI site of pUC plasmids. They have pre-
pared a wide range of such cloned inserts, containing central GC, CG, or (A/T),,
sites (11,15,29,30), which are available from the authors’ laboratory on request.
DNA fragments contammg the synthetic inserts can be prepared and radiola-
beled at either end (see Subheading 3.2.) by isolatmg the modified polylmker.
Once again a proper analysis will requtre fragments contammg both cognate
and closely related noncognate sequences.
DNase I Footprinting
7
2.3. Buffers
2.3.1. Solutrons for Plasmid Preparation
1 Resuspenston solution 50 mM Trts-HCl. pH 7 5, contammg 10 mM EDTA.
2. Lysis solution. 0.1% SDS, 0.1 MNaOH.
3 Neutralization solutton 3 M potassium acetate, 2 A4 acettc acid
2.3.2. Genera/ Buffers
1 10 mA4Tris-HCl, pH 7 5, contannng 0 1 mA4EDTA This is used for dtssolvmg DNA.
2. 10 mM Trts-HCl, pH 7.5, containing 10 mA4 NaCl. This is used for preparing
drug solutions
3 DNase I buffer 20 mMNaC1,2 mM MgCl*, 2 mM MnC&
2.3.3. Reagents for Electrophoresis
1. TBE electrophorests buffer This should be made up as a 5X stock solutton con-
taining 108 g Tns, 55 g Boric acid, and 9.4 g EDTA made up to 2 L with water
2 Acrylamide solutions Polyacrylamide sequencing gels are made from a mixture
containing acrylamtde*btsacrylamtde in the ratio 19.1. Because of the toxic nature
of these compounds. acrylamide solution are best purchased from a commerctal
supplier (National Diagnostics [Atlanta, GA], Anachem [Luton, Beds, UK]) and
should be used according to the manufacturers mstructions
3 DNase I stop solution. Formamide containing 10 mM EDTA and 0 1% (w/v)
bromophenol blue
3. Methods
3.1. Plasmid Preparation
Several methods are available for preparing plasmid DNA, which IS suitable
for restriction digestion and radiolabeling, including several commerctal kits
(including Qiagen or Wizard) and caesium chloride density gradient centrifu-
gation. It 1s beyond the scope of this article to review the relative merits of each
procedure, except to note that in many instances it is not necessary to generate
high purity plasmid preparations. Since the radtolabeled restrtction fragments
are eventually isolated and purified by gel electrophoresis, prior purification of
the plasmids may not be necessary, so long as the preparations do not contain
nucleases or any agents that inhibit restriction enzymes or polymerases. As a
result, plasmtds are usually prepared by standard alkaline lysts procedures, fol-
lowed by extraction with phenol/chloroform. A very brief protocol for extract-
mg pUC plasmids 1s described as follows:
1 Grow 50 mL bacteria overnight.
2 Spin culture at 3000g (I e., 5000 rpm m a Beckman JA20 rotor) for 5 mm m
Oakridge tube.
8
Fox
3
4.
10
11
12.
13
Resuspend the bacterial pellet m 5 mL cell resuspension solution (50 mM Tns-HCl,
pH 7.5, containing 10 mM EDTA)
Add 5 mL cell lysis solution (0 1% SDS, 0 1 MNaOH) and mix gently until the
solution becomes clear
Add 5 mL neutralization solution (3 M potassium acetate, 2 M acetic acid)
Spin at 17,000g (12,000 rpm) for 15 mm
Remove the supernatant and add 0 6 vol of lsopropanol.
Spin at 17,OOOg (12,000 rpm) for 15 mm
Remove the supernatant and wash the crude DNA pellet with 5-10 mL 70% etha-
nol Transfer the pellet to an Eppendorf tube and dry
Redissolve pellet m 0 5 mL 10 mA4 Tns-HCl, pH 7 5, containing 0.1 mM EDTA
and 100 pg/mL RNase Leave at 37°C to dissolve for at least 30 mm
Extract twice with 0 5 mL phenol/chloroform (phenol forms the bottom layer and
should be discarded) The interface will probably be very messy, leave the Junk
behind
Remove any dissolved phenol by extracting twice with 0 5 mL ether (which forms
the top layer and should be discarded) Allow excess ether to evaporate by stand-
ing at 37°C for a few minutes
Precipitate with ethanol, dry and dissolve m 100-l 50 JJL Tns-HCI, pH 7 5, con-
taining 0.1 mM EDTA
3.2. Radiolabeling the DNA
DNA fragments can be efficiently labeled at either the 5’ end (using poly-
nucleotlde kmase) or 3’ end using a DNA polymerase. However, the results of
DNase I digestion are easiest to interpret for 3’-end-labeled fragments. Smce
DNase I cuts the 03’-P bond, the products of dlgestlon possess a 3’-hydroxyl and
5’-phosphate group. In contrast, Maxam-Gilbert sequencing reactions, which are
used as markers in footprmtmg gels
(see Subheading 3.3.),
leave phosphate
groups on both sides of the cleavage pomt (52). As a result, the radlolabeled
products of DNase I cleavage and Maxam-Gilbert sequencmg reactions will be
identical if the DNA 1s labeled at the 3’ end (i.e., both possess a phosphate at the
5’ end). However, if the DNA 1s labeled at the 5’ end then the labeled DNase I
products will possess an extra phosphate group and so run slightly faster than the
correspondmg Maxam-Gllbert products. Although this difference 1s often over-
looked in footprmtmg gels, it becomes significant for short fragments for which
the difference m mobility may be as great as 2-3 bands. For enzymes that cut the
O-5’ bond, such as DNase II and mtcrococcal nuclease, 5’-end-labeled fragments
comlgrate with the Maxam-Gilbert marker lanes.
3.2.1. 3’-End Labeling with Reverse Transcriptase
The production of 3’-end-labeled DNA fragments can be achieved by cut-
ting with a restrlction enzyme that generates sticky ends with 3’-overhanging
DNase I Footprmting
9
ends, followed by filling m with a polymerase using a suitable [a-32P]-dNTP.
The fragment of interest IS then released from the remamder of the plasmid by
cleaving with a second enzyme that cuts the other side of the region of interest.
The two restriction enzymes usually cut at single locatlons in the plasmid,
though this 1s not necessary so long as the various radiolabeled fragments can
be separated from each other. The most commonly used polymerase is the
Klenow fragment. However, it is found that the most efficient labeling is
achieved using AMV reverse transcriptase, even though this 1s actually an
RNA-dependent DNA polymerase. However, not all commercially sources of
this enzyme are equally reltable; consistent results are obtained with reverse
transcrlptase from Promega or Pharmacia
3 2 1
.l
RESTRICTION DIGESTION AND a’-END LABELING
Using the aforementioned procedure for DNA isolation, the followmg 1s
used for generating radlolabeled Hindlll-EcoRl polylmker fragments from
pUC plasmids.
1. Mix 30
pL
plasmld (about 50 pg DNA) with 10 pL of 10X restrlctlon enzyme
buffer (as supplied by the manufacturer), 45 PL water.
2 Add 3 pL HzndIII (A/AGCTT)
and
incubate at 37°C for 2 h
3. Add 1 PL [a-32P]-dATP
(3000 Wmmol, Amersham) together with 1 PL reverse
transcriptase and Incubate for a further 1 h
4 The reverse transcriptase IS then Inactivated (to prevent further mcorporatlon of
radiolabel at the 3’ end of the second restrlctlon site) by heatmg at 65°C for 5 mm
5 After cooling to 37”C, 3 pL EcoRI (G/AATTC) is added and the mixture mcu-
bated for a further 1-2 h In this case, the DNA can be labeled on the opposite
strand by reversing the order of addition of EcoRI and HzndIII
If the second enzyme produces blunt ends or sticky ends with 5’ overhangs,
or if the 3’ overhangs sites can not be filled m with dATP, then all the enzymes
can be added simultaneously. Examples of such combinations for pUC
polylinker fragments are HzndlII-SacI, and EcoRI-&I. The @rT fragment can
be prepared by simultaneous digestion with EcoRl and Aval. In this instance
the EcoRl end is labeled with [a-32P]-dATP, whereas the Aval end can be
labeled with [a-32P]dCTP. Although various enzymes are supplied with dlffer-
ent reaction buffers, it 1s found that there IS usually no need to change buffers
between the first and second enzymes.
6 The mixture of radlolabeled fragments is preclpltated by addmg 10 PL of 3 M
sodium acetate and 300 pL ethanol, followed by centrlfugatlon m a suitable
microfuge, at top speed The pellet 1s washed with 70% ethanol, dried and dls-
solved m 15-20 FL Tris-HCl containing 0 1 mA4 EDTA. Then 4 PL of loading
dye (20% F~oll, 10 mA4EDTA, 4 1% [w/v] bromophenol blue) is added before
10 Fox
loading onto a polyacrylamide gel (typically 6-8%). The gel should be run cold,
so as not to denature the DNA, it is usually run 0 3-mm-thick, 40-cm-long gels in
1 X TBE at 800 V Samples are loaded into slots 10 mm wide by 15 mm deep
After the bromophenol blue has reached the bottom of the gel (about 2 h), the
plates are separated and the gel covered with Saran wrap Scanning the gel with a
hand-held Geiger counter should give a reading off scale (1 e , at least 3000 cps)
over the radiolabeled bands The precise location of the radiolabeled bands is
determined by short (2-10 min) autoradiography This autoradlograph IS placed
under the glass plates and used to locate the band of Interest, which IS cut out
using a sharp razor blade
3.2.1.2 EXTRACTION OF RADIOLABELED DNA FRAGMENTS
The simplest, cheapest, and most efficient method for extracting radio-
labeled DNA fragments from polyacrylamlde gel slices IS by diffusion Place a
small glass wool plug m the bottom of a 1 mL (PlOOO) pipet tip and seal the
bottom end with parafilm. Add the gel slice containing the radiolabeled DNA
and cover this with 10 mA4 Tris-HCl, pH 7 5, containing 10 mM EDTA (about
300 pL is sufficient). Cover the top of the pipet tip with parafilm and incubate
at 37°C with gentle agitation. This is usually incubated overmght, though most
of the DNA elutes after 2 h. Remove the parafilm from the top and bottom of
the tip and expel the buffer mto an Eppendorf tube using a pipet and/or low-
speed centrifugation (15OOg m an Eppendorf centrifuge). The gel slice should
be retamed in the pipet tip by the plug of glass wool, though a small amount of
polyacrylamide does occasionally come through This can be removed by cen-
trifugation. For fragments shorter than 200 bp, this procedure recovers about
95% of the radiolabel m the gel slice, though the efficiency decreases for longer
fragments. The DNA should then be precipitated with ethanol and redissolved m
Tris-HCI containing 0.1 mA4 EDTA so as to generate at least 10 cps per pL on
a hand-held counter. For most footprintmg experiments it is not necessary to
know the absolute DNA concentration, since this is vamshmgly small. The
important factor is concentration of the radiolabel, which should be sufficient
to produce an autoradiograph within l-2 d exposure.
3.3. Maxam-Gilbert Marker Lanes
Bands in the DNase I digestion patterns are identified by comparison with
suitable marker lanes. Since each DNA fragment produces a characteristic sequence
dependent digestion pattern, it is sometimes possible to identify the bonds by
comparison with a previous (published) pattern.
3.3.1. G-Tracks
The simplest and most commonly used marker lane is the dimethylsulfate-
piperidme marker specific for guanine (52). Since the procedure is more time-
DNase I Footprintmg
11
consuming than DNase I digestion itself, it is usual to prepare sufficient quantity of
“G-track” for several footprmting experiments with the batch of radiolabeled DNA.
Add 10 uL radiolabeled DNA to 200
pL of
10 mA4 Tris-HCl, pH 7.5, con-
tammg 10 mM NaCl. To this add 1 pL dtmethylsulfate and mcubate at room
temperature for 1 mm before stopping the reaction by addmg 50 uL of a solution
containing 1.5 Msodmm acetate and 1 Mmercaptoethanol followed by 750 pL
ethanol. Some laboratortes include tRNA in this G-stop, as a coprectpttant, but
it is found that this is not generally necessary. Leave the mixture on dry ice for
10 min, then spin at full speed in an Eppendorf centrifuge (12,000g) for 10 min.
Remove the supernatant and wash the pellet twice with 70% ethanol. After
drying the pellet, add 50-l 00 yL of 10% (v/v) plperidme and heat at 100°C for
between 20 and 30 min. Remove the ptpertdme by either lyophilizatton or m a
speed-vat. Redissolve the sample m loading dye (formamlde containing 10 mJ4
EDTA and 0.1% [w/v] bromophenol blue) so that each electrophorests sample
contains about 10 cps.
3.3.2. G+A Tracks
Although the preparation of a G-track is reliable, it is time-consummg and
mvolves some
highly toxic compounds (dimethylsulfate). G+A marker lanes
are also widely used and are usually prepared by limited acid depurmation
using formtc acid-ptperidme reactions. During the DNase I footprintmg work
it was noted that occastonal careless handling of the samples resulted m put-me
tracks appearing m the DNase I cleavage lanes. This observatton has been used
to establish an empirical method for rapidly preparing G+A marker lanes
To 2 pL of radiolabeled DNA, add 15-20 pL of Trts-HCl, pH 7.5, contam-
ing
10 MNaCl and 5 pL of loading dye (formamide containing 10 mM EDTA
and 0.1% [w/v] bromophenol blue). Heat at 100°C for about 20 mm in an Ep-
pendorf tube, with the cap open This reduces the volume to about 5-6 pL,
sufficient for loading onto the gel and generates a clean G+A track. Since this
method 1s rapid, each marker lane can be freshly prepared while performing
the DNase I digestions.
3.4.
DNase I Footprinting
3.4. I. Basic Footprinting Protocol
The basic procedure for DNase I footprinting is quick and snnple (hence its popu-
larity as a footpnnting agent) and can readily be adapted to suit a range of conditions.
1. Mix 2 uL radiolabeled DNA (dissolved m 10 mMTrrs-HCl, pH 8.0, contannng
0.1 rniI4 EDTA) with 2 uL ligand (dissolved in a surtable buffer, such as 10 n&I
Trrs-HCl, pH 7.5, containing 10 m&I NaCl). See Note 5 for suitable hgand
concentrations.
12 Fox
2 Leave this to equihbrate for an approprtate length of time. For most small hgands,
such as minor groove binding ligands or simple intercalators, the interaction with
DNA is very fast, though some hgands require in excess of 30 mm for equiltb-
rium distribution.
3. Start the digestion by adding 2 PL DNase I (dissolved in 2 mM MgCI,, 2 mM
MnCl,, 20 mM NaCi)
4 After 1 minute stop the reaction by adding 3 pL of formamide containing 10 mh4
EDTA and 0 1% (w/v) bromophenol blue
The concentratton of DNase I requtred will depend on the reaction condrttons,
1-e , temperature, pH, DNA concentration, tonic strength This should be adjusted
emptrtcally so as to give suitable extent of dtgestton (see Notes l-4). It 1s
typically found that, at 20°C with 10 mM NaCl, a suitable enzyme concentra-
tion is about 0.03 Kunitz U/rnL (i.e., dilute 2 PL of stock DNase I [7200 U/mL] m
1 mL DNase I buffer, followed by adding 2 l.rL of this dtlutton to a further 1 mL
buffer Each of these dilutions should be mixed gently, avotdmg vtgorous agi-
tation) The enzyme should be freshly diluted immediately before use.
3.5. Electrophoresis and Autoradiography
1 After DNase I digestion the samples should be denatured by boiling for about
3 mm, before loading onto a denaturing polyacrylamide gel Samples can be
loaded directly from the boiling conditions, though excessive heating can pro-
duce some depurmation. However, it is probably best rapidly to cool the samples
on ice before loading For most footprmtmg reactions there ts no need to use
sharks teeth combs, and simple slots are sufficient
Denaturing polyacrylamide gels (6-l 2% depending on fragment length)
should contam 8 M urea and are run m 1X TBE buffer, For some CC-rich
DNAs these denaturing conditions are not harsh enough and some bands are
compressed. Thts can be alleviated by including formamtde (up to 30%) m the
gel mixture and can be further improved by prerunning the gel for 30 mm
before use. Formamtde contammg gels run slightly slower than conventtonal
gels and should be of a slightly higher percentage. For footprmtmg expert-
ments 0.3-mm-thick gels are normally used that are 40 cm long; these are run
at 1500 V until the bromophenol blue reaches the bottom (about 2 h). The gels
should be run hot, maintaining the DNA m a denatured form. Although many
modern electrophoresls tanks are thermostatically controlled, “smtling” of the
lanes can also be avoided by clamping a metal plate over the glass surface,
ensuring an even dtstributton of heat.
2. After electrophoresis the plates are separated and the gel is soaked in 10% (v/v)
acetic acid. This serves to fix the DNA and remove much of the urea, prior to
drying Each 2 L of 10% acetic acid can be used to fix up to three gels.
DNase I Foo tpnn trng
13
3 After fixing, the gels are transferred to Whatman 3MM paper, covered with Saran
wrap and dried at 80°C m a commercial gel drier
4. The dried gels are exposed to autoradiography If the DNA IS suitably “hot,” then
1-2 d exposure at -70°C with an Intensifying screen should be sufficient.
3.6. Analysis
Although rigorous quantitative analysis is required for assessing the relative
binding affinity at different sites, and for measuring bmdmg constants, the
locatton of drug-induced footprmts can usually be directly assessed by visual
mspectlon. Quantitative analysis requires
additional equipment (densitometer
or phosphorimager) and 1s beyond the scope of this chapter (see Chapter 2).
However, since DNase I footprmts are necessarily larger than the actual hgand
binding site, on account of the size of the enzyme, both visual and quantitative
analyses leave some uncertainties. The footprint will be larger than the binding
site, and this too may be larger than the recognition site. For example, although
actinomycm D specttically recognizes the dmucleotide GpC, tt covers about 4 bp
and protects about 6 bases from DNase I cleavage. For small hgands that rec-
ognize only 2 or 3 bp, and which may generate several discrete footprmts on
any given DNA fragment, the ambiguity concermng the exact bindmg can often
be resolved by determmmg the sequences that are common to each of the foot-
prints. Additional mformatton is gleaned by comparmg the location of the foot-
prints on each of the DNA strands, visualized by performing separate
experiments with DNA labeled on each strand. Since DNase I footprmts are
staggered in the 3’ direction by 2-3 bases, the exact binding site will be located
toward the 5’ end of each footprint and will be contained m the region of over-
lap protected on both strands. If there are still uncertamtres about the sequence
recognitton properties, then it may be necessary to synthesize (a series of) syn-
thetic fragments that contam putative binding sites based on the preliminary
footprinting data. An example of this is the AT-selective bifuncttonal
intercalator TANDEM Footprmting experiments with natural DNA fragments
confirmed the AT-selectivity, but could not determine whether the recognition
site was ApT or TpA (7). This was resolved by producmg fragments contain-
ing a series of different AT-rich binding sites, i.e., ATAT, TATA, TTAA, and
AATT (53). These demonstrated that the recognition sate is TpA not ApT. An
alternative strategy is to use another footprmting agent such as MPE, hydroxyl
radicals, mrcrococcal nuclease, DNase II, or uranyl radicals, though these suf-
fer to different degrees from the same problems of locating the exact ligand
binding site.
3.7. A Worked Example
Figure 3 shows DNase I digestion of the tyr?” DNA fragment m the pres-
ence of varying concentratrons of the AT-selective anttbiotrc distamycm. The
14
Fox
20-
Fig. 3. DNase I footprinting of distamycin on the 160 bp Qv-T DNA fragment, whose
sequence is presented in Table 2. The EcoRI-AvaI fragment is labeled at the 3’ end of
the EcoRI site. The distamycin concentration (pA4) is shown at the top of the lanes.
Each pair of lanes corresponds to cleavage by the enzyme for 1 and 5 min.
sequence of this DNA fragment is presented in Table 1. The DNA fragment in
Fig. 3 has been obtained by digesting with EcoRI and AvaI and has been labeled
at the 3’ end of the EcoRI site with a-32P dATP, using reverse transcriptase,
revealing the bottom strand in Table 1. Since this fragment has been widely
used as a footprinting substrate, the bands have been assigned by comparison
with other published data. Samples have been removed from the digestion mix-
ture at times of 1 and 5 min. This figure will be used to illustrate several aspects
of DNase I footprinting.
It can be seen that DNase I cleavage in the drug-free control is not even (see
Note 6). Some regions are cut poorly, particularly between 26-32 and 42-50.
These are staggered to the 3’ side of the
A,
1
T,
blocks at 27-33 and 46-52.
D Nase I Foo tpnn tmg
75
Cleavage is also poor around position 100, m a GC-rich block. In addition
some positions are cut much better than the surroundmg bonds (e.g., 41, 69,
and 81), whereas others are cut less well (e.g., 39,58, 83). The poor cutting m
the AT-rich regions of the control presents an obvious problem for this hgand
that 1s AT-selective since the binding sites correspond to regions where there is
little or no cleavage m the control.
Visual inspection reveals that distamycm has altered the DNase I cleavage
pattern. Clear protections from DNase I cleavage are evident at the lowest
hgand concentration (0.2 PM) at positions 26-32 and 43-50. These sites corre-
spond to regtons that are poor sites of DNase I cleavage in the control. Other
regions of protection can be seen at 1 and 5 )L&! at 56-68, 78-89, and around
110. Each of these positions corresponds to an AT-rich sequence. The first
contains two distamycin bmdmg sites (TTA and TAAA) that produce a single
overlappmg footprint, as does the second (AAT and ATAT), whereas the third
contams a single site TTAT. At concentrations of 25 and 100 uM most of the
cleavage in the lower portion of the fragment is protected. It can be seen that
each of these protections is staggered by 2-3 bases in the 3’ (lower) direction
relative to the actual binding site For example, the protection around posi-
non 60 extends down at least as far as posttion 56, whereas the AT-bindmg
site ends at position 59 In contrast, the 5’ (upper) end of the footprmt is
coincident with the edge of the binding sites (position 69) As a result of the
overlapping footprints, and the poor cleavage of the enzyme around some
bmdmg sites, it is not possible to determine the ligand bmdmg site size from
these footprmts.
The intensity of certain bands is increased at distamycm concentrations of
5 wand above, especrally at positions 72/73,94/95, and 99/l 00, each of which
is located m a GC-rich region. Indeed at the highest lrgand concentration the
bands at 72/73 and 94/95 are the only cleavage products remainmg. These regions
of enhanced cleavage have previously been interpreted as arising from ligand
induced changes in DNA structure (4). However, in view of small amount of
free DNA available for enzyme cleavage these enhancements could simply
reflect changes in the ratio of free DNA to enzyme (54,55). Since most of the
enzyme binding sites are occupied by the ligand, the relative concentration of
enzyme at these sites will be much greater, hence the greater cleavage effi-
ciency (see Note 8).
It should be noted that, in this example, the 5-min lanes are overdigested;
only a small proportion of the DNA is uncut. As a result, bands toward the top
of the gel are much lighter, whereas those toward the bottom are overrepre-
sented, since they arise from multrple cleavage events. Although it is still pos-
sible to discern the footprmting sites m the lower portion, this is less clear m
the upper part, and could certamly not be used in any quantitative analysis.
16 Fox
Table 2
The Effect of Various Conditions on the Relative Concentration
of DNase I Required in Footprinting Experiments
Relative Relative Relative
enzyme Ionic enzyme enzyme
Temperature concentration strength concentration pH concentration
4°C 6 001 1 50 5
20°C 1 0.1 5 6.0 3
37OC 05 10 10 70 1
5OT 1 80 1
65°C 2
4. Notes
1 The activity of DNase I will. of course, vary according to the different reactlon
condltlons, affecting the extent of digestion, and suitable adjustments should be
made to ensure sufficient cleavage, yet maintaining “single-hit” kinetics This
can be achieved either by altermg the digestion time or varying the concentration
of the enzyme The latter 1s generally varied A rough guide for the effect of
various condltlons on the relative concentration of DNase I required IS presented
m Table 2 For mitral experiments it 1s often worth performing a time course for
the enzyme digestion, increasing the volume of the reactants and removing all-
quots e g., say, 1, 5, and 30 mm
2. DNase I requires the presence of dlvalent metal ions, particularly magnesium,
and so Its action can be stopped by adding EDTA The enzyme has more than one
bmdmg site for dlvalent catlons, though only one of these 1s at the catalytic site
The literature on the preferred metal ions IS confusing with various claims for
different sites for calcium and/or magnesium suggestmg that both ions are required
However, good cleavage is observed with either calcium or magnesium, although
slrghtly higher enzyme concentrations are reqmred when using calcmm alone
Since manganese has been shown to increase the rate of digestton, equlmolar
concentrations of manganese and magnesium are generally used It IS found that
the cleavage pattern 1s largely unaffected by the nature of the divalent metal Ion,
even though crystallographic data has suggested an alternative bmdmg site for
manganese that might produce a different cleavage pattern In contrast, mllllmo-
lar concentrations of ions such as Co*+ and Zn*+ inhlblt the activity of DNase I
3 DNase I 1s reasonably tolerant to a variety of organic solvents mcludmg metha-
nol, ethanol, and dlmethylsulfoxlde (DMSO) This 1s useful since many DNA-
bindmg ligands are only sparmgly soluble m water and must be prepared as stock
solutions in various other solvents. DMSO concentrations as high as 40% require
a threefold higher enzyme concentration, though this does modify the cleavage
pattern, increasing the cuttmg m regions that are poor substrates for DNase I,
such as polydA tracts
DNase I Footprinting
4. A glance at the literature reveals that many laboratories include known concen-
tration of unlabeled carrier DNA m the footprmtmg reaction. This is only neces-
sary for experiments m which the absolute DNA concentration 1s needed (I e ,
some forms of quantitative footprmtmg analysis) and can be omitted for most
experiments However, one advantage of mcludmg a fixed concentration of car-
rler DNA IS that the concentration of DNase I required to produce a given level of
cleavage does not vary between experiments m which the absolute amount of
radlolabeled DNA may not be constant
5 In most footprintmg reactions the concentration of the target DNA IS vamshmgly
small (nanomolar) whereas the DNA bmdmg ligand IS present m mlcromolar
amounts The extent of bmdmg is, therefore, not determined by the stolchlometric
ratio of drug to DNA, but by the equlhbrmm bmdmg constant In this regard
footprinting reactions resemble typlcal pharmacological experiments, m which
the concentration of the target site IS small and unknown and m which the prob-
ability of each site being occupied is 50% at a ligand concentration equivalent to
the equlhbrium dlssoclatlon constant Since many hgands bmd to DNA with affm-
ties of between 1 and 100 PM’, drug concentrations between 1 and 100 @4 are
usually examined. For drugs that bmd more tightly, lower ligand Concentrations
should be explored. It IS generally best to test a range of hgand concentrations,
extending down to a concentration at which the digestion IS not noticeably affected
High hgand concentrations (100 CLM) often mhlblt DNase I digestion throughout
the DNA fragment, this could be the result of nonspecific interaction with DNA
or direct inhibition of the enzyme itself
6 A major problem with using DNase I as a footprmtmg tool IS that the enzyme
cuts different sequences with efficiencies that can vary over two orders of magm-
tude. These variations can be both local, m which isolated bonds are cut better or
worse than average, or global, where long DNA regions are cut poorly In gen-
eral, polydA polydT tracts are poor substrates for DNase I, on account of their
narrow minor grooves GC-rich regions are also cut poorly, probably because
they are more rigid and resist the bending that may be an important part of the
DNase I catalytic reaction. In addition, RpY steps are generally cut better than
YpR. Llgands that bind to those regions that are cut poorly by DNase I, produce
footprmts that are difficult to detect. The only way round this problem 1s to use a
different footprmting probe
7 A similar problem 1s encountered when assessing the exact size of a footprint if
bands at the edges of the footprint are cut poorly m the control Although this
may be clarified by examining the cleavage of the other strand, the ambiguity
often remains so that the footprmting site size can usually only be quoted to within
an accuracy of +l base.
8 As well as producing footprmts, many hgands also generate enhanced DNase I
cleavage m regions surrounding their binding sites. These have been explained m
two different ways, each of which is correct in different circumstances First,
these may arise from drug-induced changes m DNA structure, which are propa-
gated mto neighboring regions, and which render the DNA more susceptible to
18 Fox
DNase I cleavage. Second, they may simply reflect a change in the ratio of free
DNA to enzyme m the presence of the ligand (5455) These two posslblhtles can
only be properly dlstingulshed by quantitative footprmtmg experiments How-
ever, a few other factors may indicate which is occurrmg. Enhancements artsmg
from changes m the ratio of free DNA to enzyme should be constant at all points
to which the hgand 1s not bound, whereas those that are directly attributable to
hgand bmdmg will be located closest to the hgand bmdmg sites A further posse-
blhty, which 1s rarely considered, 1s that of llgand-induced protections from
enzyme cleavage, m surrounding regions
9 An apparently mmor detail, which 1s rarely addressed, concerns the hgand con-
centration Does this refer to the actual concentration before or after adding the
DNase 17 For a hgand m fast exchange with the DNA, a new equlhbrmm will
rapidly be established after the small dilution because of the addltlon of the enzyme
In contrast, if the dlssoclatlon IS slow compared with the time course of the dlges-
tion, then the dlstrlbutlon of the hgand will resemble the startmg condltlons
throughout the reaction In the former case the hgand concentration should be
that after adding the DNase I, whereas m the latter case this should refer to the
concentration before In theory, the answer to the question requires some prior
knowledge of the kinetics of hgand bmdmg, though m practice one or other 1s
consistently adopted
10 Unwanted bands sometimes appear m the lanes, which clearly do not arlse from
enzyme digestion These may be contaminants m the DNA preparation and can
be checked by running a sample of DNA that has not been digested with the
enzyme Artlfactual bands, particularly depurmatlon products, can be produced
by the bollmg procedure. These can be obviated by mcludmg a small amount of
sodium hydroxide (l-2 m44) in the stop solution
11. Since DNase I cuts from the minor groove, protections are easiest to Interpret for
llgands that also bind m this groove, sterlcally inhibiting enzyme activity How-
ever, major groove bmdmg agents, such as triplex-formmg ohgonucleotldes, also
generate clear DNase I footprints (12,13) In this case cleavage mhlbltlon cannot
result from sterlc hmderance, but must arise from changes in the DNA structure
and/or rigidity and are, therefore, less easily interpreted It should be noted that
the footprmtmg pattern should still be staggered across the two strands by about
2-3 bases m the 3’ direction since this is a function of the cleavage agent, rather
than the ligand under mvestlgatlon Agents that cut from the major groove would
be expected to generate a 5’ stagger
12 Another ambiguity m DNase I footprinting gels, which 1s rarely addressed, con-
cerns the numbering/assignment of the cleavage products. Although this would
seem to be a trivial problem the uncertainty arises because, whereas most DNA
sequences number the bases, DNase I cleavage products correspond to the
phosphodlester bonds When Maxam-Gilbert markers are used alongslde DNase
I cleavage of 3’-end-labeled fragments, each band m the marker lane (X)
comlgrates with the band corresponding to cleavage of the phosphodlester bond
on the 3’ side, 1 e , the XpY step
DNase I Foo tprin tmg
79
13 By adapting the simple footprmtmg protocol it can also be used for measurmg
slow kinetic parameters, by removing samples from a reaction mixture and sub-
jecting to short DNase I footprintmg (48,49).
14. It IS possible that some sequence selective compounds will not produce DNase I
footprints if they are in rapid exchange with the DNA. In such cases footprints
can be induced by lowermg the temperature, thereby increasing then persistence
time on the preferred binding sites (56).
Acknowledgments
Work in the author’s laboratory ts supported by grants from the Medical
Research Council and the Cancer Research Campaign.
References
1
2
3
4
5
6.
7.
8
9
10
11
12
Galas, D J. and Schmitz, A (1978) DNAase footprmtmg-simple method for
detection of protein-DNA binding specificity Nucleic Acids Res 5, 3 157-3 170
Lane, M. J , Dabrowrak, J C , and Vournakis, J N. (1983) Sequence specificity of
actinomycm D and netropsm binding to pBR322 analysed by protection from
DNAase I. Proc Nat1 Acad Sci USA 80,326&3264
Scamrov, A V. and Beabealashvilh, R Sh. (1983) Bmdmg of actmomycm D to
DNA revealed by DNAase I footprintmg. FEBS Lett 164, 97-101.
Fox, K R and Warmg, M J (1984) DNA structural variatrons produced by actr-
nomycm and distamycm as revealed by DNAase I footprmtmg Nuclezc Aczds
Res 12,9271-9285
Fox, K R. and Howarth, N R (1985) Investigations into the sequence-selective bmd-
ing of muhramycm and related ligands to DNA Nuclezc Aczds Res 13,8695-87 14
Low, C M L , Drew, H R , and Waring, M J (1984) Sequence-specific binding
of echmomycm to DNA. evidence for conformational changes affecting flanking
sequences. Nucleic Acids Res 12, 48654879
Low, C. M L , Olsen, R K., and Warmg, M. J. (1984) Sequence preferences m
the binding to DNA of triostm A and TANDEM as reported by DNase I
footprmtmg. FEBS Lett 176,4 14-4 19.
Chaires, J. B., Fox, K. R , Herrera, J E., Britt, M , and Warmg, M J (1987) Site and
sequence specificity of the daunomycin-DNA interaction
Blochemzstry 26,8227-8236
Chanes, J B , Herrera, J E , and Waring, M J (1990) Preferential bindmg of
daunomycm to S’(A/T)CG and S’(A/T)GC sequences revealed by footprmtmg
titration experiments Brochemzstry 29, 614556153
Fox, K. R. and Warmg, M J. (1986) Nucleotide sequence bmdmg preferences of
nogalamycin investigated by DNase I footprintmg. Bzochemzstry 25,4349-4356
Abu-Daya, A , Brown, P M., and Fox, K. R. (1995) DNA sequence preferences
of several AT-selecttve minor groove binding hgands Nucleic Acids Res 23,
3385-3392
Cooney, M., Czernuszewicz, G., Pastel, E. H , Flmt, S. J., and Hogan, M E (1988)
Site-specific oligonucleotide binding represses transcription of the human c-myc
gene in vitro Science 241,456459
20
Fox
13 Cheng, A -J and van Dyke, M W (1994) Oltgodeoxyribonucleotide length and
sequence effects on mtermolecular purine-purme-pyrimidme triple-helix forma-
tlon Nucleic Acids Res 22,4742-4747
14 Fox, K. R and Waring, M. J (1987) The use of micrococcal nuclease as a probe
for drug-binding sites on DNA Blochrm Bzophys Acta 909, 145-l 55
15 Cons, B M G and Fox, K R (1990) The GC-selective hgand mtthramycm
alters the structure of (AT), sequences flankmg its bmding sites FEBS Lett
264, lo&104
16. Stgman, D. S. (1990) Chemical nucleases. Brochemlstry 29,9097-9105
17 Spassky, A and Slgamn, D S (1985) Nuclease acttvny of 1,lO phenanthrolme-
copper ion. conformational analysis and footprmting of the lac operon Blochem-
wtry 24,8050-8056.
18 Van Dyke, M W , Hertzberg, R P , and Dervan, P B (1982) Map of distamycin,
netropsm and actmomycm binding sites on heterogeneous DNA DNA cleavage
inhibition patterns with methidmmpropyl-EDTA-Fe(I1). Proc Nat1 Acad Scz
USA 79,5470-5474
19. Van Dyke, M W and Dervan, P. B (1983) Chromomycin, mithramycm and
ohvomycin binding sites on heterogeneous deoxyribonucleic acid Footprintmg
with (methidmmpropyl-EDTA)Iron(II) Biochemutry 22,2373-2377
20 Hertzberg, J P and Dervan, P B. (1984) Cleavage of DNA with methidmmpropyl-
EDTA-Iron(I1) reaction conditions and product analyses Blochemlstry 23,
3934-3945
2 1. Van Dyke, M. W. and Dervan, P B. (1983) Methidmmpropyl-EDTA.Fe(II) and
DNase I footprmtmg report different small molecule bmdmg site sizes on DNA
Nuclerc Acids Res 10,5555-5567
22. Nielsen, P E., Jeppesen, C., and Buchardt, 0. (1988) Uranyl salts as photochemi-
cal agents for cleavage of DNA and probing of protein DNA contacts FEBS Lett
235, 122-124.
23. Nielsen, P E., Hiort, C , Sonmchsen, S H., Buchardt, O., Dahl, O., and Norden,
B. (1993) DNA bmdmg and photocleavage by uranyl(VI)(UOZ2’) salts J Am
Chem Sot 114,4967-4975
24. Cons, B. M. G. and Fox, K R. (1989) High Resolution hydroxyl radtcal
footprmting of the bmdmg of mtthramycin and related antibiotics to DNA Nucleic
Acids Res 17,5447-5459
25. Churchill, M. E. A , Hayes, J J , and Tullms, T D. (1990) Detection of drug
binding to DNA by hydroxyl radical footprintmg Relationship of distamycm
binding sites to DNA structure and positioned nucleosomes on 5s RNA genes of
Xenopus Biochemistry 29,6043-6050.
26 Portugal, J and Warmg, M J. (1987) Hydroxyl radical footprmtmg of the sequence-
selective bmdmg of netropsm and distamycin to DNA. FEBS Lett 225, 195-200
27 Drew, H. R and Travers, A A. (1984) DNA structural variations m the E colz
tyrT promoter. Cell 37,491-502
28. Drew, H. R. (1984) Structural specificrues of five commonly used DNA nucleases
J Mel Bzol 176,535-557
DNase I Footprintmg
21
29. Waterloh, K. and Fox, K R. (199 I) The effects of actmomycm on the structure of
dA, * dT, and (dA-dT), regions surroundmg its GC bmding site: a footprintmg
study J Biol Chem. 266,6381-6388.
30. Waterloh, K. and Fox, K R. (1991) Interaction of echmomycm with A,, T, and
(AT), regions flanking its CG bmding site Nucleic Acids Res 19,67 19-6724
3 1. Laskowskr, M (197 1) Deoxyrlbonuclease I, in The Enzymes, vol. 4 (Boyer, P D ,
ed ), Academtce, London, pp 289-3 11,
32. Kumtz, M. (1950) Crystallme deoxyribonuclease I isolation and general proper-
ties spectrophotometric method for the measurement of deoxyribonuclease activ-
ity. J Gen Physzol 33, 349-369
33. Price, P. A (1975) The essential role of Cazf m the activity of bovine pancreatic
deoxyribonuclease J Blol Chem 250, 1981-1986
34 Lomonossoff, G. P , Butler, P. J. G , and Klug, A. (198 1) Sequence-dependent
variation m the conformation of DNA. J Mol BIO~ 149,745-760.
35 Hogan, M. E., Roberson, M W., and Austin, R. H. (1989) DNA flexibility varia-
tion may dominate DNase I cleavage Proc Nat1 Acad Scz USA 86,9273-9277
36 Brukner, I., Jurukovski, V , and Savic, A. (1990) Sequence-dependent structural
variations of DNA revealed by DNase I. Nuclezc Aczds Res 18, 89 l-894
37. Suck, D., Oefner, C , and Kabasch, W. (1984) Three-dimensional structure of
bovine pancreatic DNAase I at 2.5A resolution. EMBO J 3, 2423-2430.
38 Suck, D. and Oefner, C (1986) Structure of DNaseI at 2A resolution suggests a
mechanism for bmdmg to and cuttmg DNA Nature 321,62(X-625.
39 Oefner, C and Suck, D (1986) Crystallographic refinement and structure of
DNAase I at 2A resolution. J Mol Blol. 192, 605432.
40 Suck, D , Lahm, A, and Oefner, C (1988) Structure refined to 2A of anicked
octanulceotide complex with DNAase I Nature 332,464-468
4 1 Weston, S A , Lahm, A , and Suck, D. (1992) X-ray structure of the DNase I-
d(GGTATACC)2 complex at 2 3k resolution. J Mol Bzol 226, 1237-1256
42 Lahm, A. and Suck, D (1991) DNase I-induced DNA conformation. 2A structure
of a DNase I-octamer complex J Mel Bzol 221, 645-667
43. Herrera, J. E. and Chaires, J B (1994) Characterization of preferred Deoxyribo-
nuclease I cleavage sites J Mol Bzol 236,405-411
44. Bailly, C., Donker, I. O., Gentle, D., Thornalley, M., and Warmg, M. J (1994)
Sequence selective binding to DNA of cis- and trans- butamidme analogues of
the anti-Pneumocystis carmn pneumonia drug pentamidme. MoZ Pharm 46,
3 13-322
45 Bailly, C , Gentle, D , Hamy, F , Purcell, M., and Waring, M J. (1994) Localized
chemical reactivity in DNA associated with the sequence specific bismtercalatlon
of echmomycm Blochem J 300, 165-173
46 Ridge, G. S , Bailly, C , Graves, D. E., and Warmg, M J (1994) Daunomycm
modifies the sequence-selective recognition of DNA by actinomycm. Nuclezc
Acids Res. 22,5241-5246.
47. Waterloh, K. and Fox, K. R. (1992) Secondary (non-GpC) bmdmg sites for acti-
nomycin on DNA. Blochzm Biophys Acta 1131,300-306
22 Fox
48 Fletcher, M C and Fox, K R. (1993) Vtsuahsmg the kmettcs of dtssoctatron
ofactinomycin from mdtvrdual bmdmg sites m mixed sequence DNA by DNase I
footprmting Nucleic Acids Res 21, 1339-l 344
49 Fletcher, M C and Fox, K R (1996) Dtssoctatton kmettcs of echmomycm from
CpG sites m different sequence envtronment Bzochemzstry 35, 1064-l 075
50 Huang, Y -Q , Rehfuss, R. P , LaPlante, S. R., Boudreau, E Borer, P N , and
Lane, M J (1988) Actmomycm D Induced DNAase I cleavage enhancement
caused by sequence specttic propagation of an altered DNA structure Nuclezc
Aczds Res 16, 11,125-l 1,139
5 1 Bishop, K D , Borer, P N , Huang, Y -Q., and Lane, M J (1991) Actmomycm D
induced DNase I hypersensitivtty and asymmetrtc structure transmission m a DNA
hexadecamer Nucleic Aclds Res 19, 87 l-875
52 Maxam, A M and Gilbert, W (1980) Sequencmg end labelled DNA wtth base-
specific chemical cleavages Methods Enzymol 65,499-560
53 Lavesa, M., Olsen, R K , and Fox, K. R (1993) Sequence spectfic bmdmg of [N-
MeCys3,N-MeCys’] TANDEM to TpA. Blochem .I 289,605-607.
54 Ward, B. Rehfuss, R , Goodisman, J , and Dabrowtak, J C (1988) Rate enhance-
ments m the DNase I footprmting experiment Nucfezc Aczds Res 16, 1359-l 369
55 Ward, B. Rehfuss, R Goodisman, J., and Dabrowtak, J D. (1988) Determination
of netropsm-DNA bmdmg constants from footprmtmg data Bzochemzstry 27,
1198-1205
56 Fox, K R and Warmg, M J (1987) Footprmtmg at low temperatures* evidence
that ethidmm and other sample mtercalators can drscrimmate between different
nucleottde sequences Nucleic Aczds Res 15,49 l-507
2
Quantitative DNA Footprinting
James C. Dabrowiak, Jerry Goodisman, and Brian Ward
1. Introduction
Footprmting analysis has been used to identify the bmdmg sites of drugs
and other hgands bound to DNA molecules (see Chapter 1) (1-3). It is particu-
larly useful for equilibrium bmdmg drugs or hgands that leave no record of
their residence position on DNA In the footprmtmg procedure, the hgand-
DNA complex is exposed to an agent or probe that can cleave DNA, and the
ohgonucleotide products from the cleavage reaction are separated using, for
example, electrophoresis m a polyacrylamide gel. If the hgand, when bound,
inhibits cleavage by the probe, the ohgonucleotides that terminate at the hgand
binding site will be underrepresented among the products analyzed using the
sequencing gel. This appears as omissions or “footprmts” m the spots on the
sequencing autoradiogram
In quantitative footprmtmg, digests are carried out using different concen-
trations of drug. Then the drug binding can be seen as a decrease in the intensity
of a spot (corresponding to a particular cleavage site) with drug concentration.
Since the autoradiographic spot mtensities are directly proportional to oligo-
nucleotide concentrations, they give the proportion of sites occupied by drug
so that from the dependence of spot mtenstty on drug concentration one may
obtain the drug (or protein) bmdmg constant for a particular site, i.e., as a func-
tion of sequence.
In this chapter, we outline the approach used to obtain binding constants for
drugs bound to DNA. In Subheading 3.1., the experiment is reviewed and, m
Subheadings 3.2 3.3., the theory behind quantitative footprmtmg analysis is
outlined. The method is illustrated with published results (46) for the DNA
sequence shown m Fig, 1 (Subheading 3.4.), with new results for ohgonucle-
otide duplexes having only a single site (Subheading 3.5.). The drug used m
From Methods m Molecular Bology, Vol 90 Drug-DNA Interact/on Protocols
Edlted by K R Fox Humana Press Inc , Totowa, NJ
23
24
Dabrowiak et al.
5’-AGCTTTAATGCGGTAGTTTATCACAGTTAAATTGCTAACGCAGTCAGGCACcGTGTATGAAATcTAACAA
. 30% 40 50 60 70 00 90
TGCGCTCATCGTCATCCTCGGCACCGTCACCCTGGATGCTGTAGGCATAGGCTTGGTTATGCCGGTACTGCCG~3’
100 110 120 130 140 150 160 170
ACGCGAGTAGCAGTAGGAG~CGTFGCqGTGGGACCTACGACAT~ATC~ACCAAT~CCATGACGGC-5’
-
- Strong Site
u Weak Site
Fig 1, The sequence of a 139-bp fragment from pBR 322 DNA Strong and weak
binding sites for ActD are indicated by filled and hatched rectangles, respectively (6).
both cases IS actinomycin D (ActD). Quantitative footprinting analysis is also ap-
phed to determination of the dissociation constant of a triple helix formed from an
ohgonucleotlde and a lineanzed double-stranded plasmld (Subheading 3.6.)
2. Materials
The materials and equipment necessary for quantitative footprinting analy-
SIS are readily avallable m most biochemical laboratories. The DNA substrate
can be obtained from restriction cleavage of natural DNA& synthesized or
generated using PCR. It 1s advisable to purify the end-labeled DNA, using a
gel to remove labeling reagents that may interfere with the equilibria being
measured (7). If calf thymus DNA 1s to be added to the mixture, it should be
deproteinized and sonicated prior to use. No special treatment of the enzyme
DNase I 1s necessary. However, all commercial preparations of the enzyme slowly
degrade m solution with time. For this reason, calibrated stocks of DNase I
should be stored at -20°C until needed (8). The sequencing gel, after electrophore-
SIS, can be analyzed with a phosphorlmagmg device or by autoradlography/
mlcrodensitometry to obtain quantities proportional to DNA concentrations.
The concentrations can be used to measure ligand binding constants according
to the method outlined in Subheaading 3.2.
3. Methods
3.7. The Footprinting Experiment: General Considerations
The interpretation of the quantitative footprmtmg experiment 1s slmphfied
when one terminates the cleavage reaction with -80% of the full-length DNA
uncleaved. This ensures that the products are the result of a single cleavage m
the full-length fragment of DNA. In this “single-hit” regime, the amount of
each ohgomer 1s proportional to the probability of cleavage at the correspondmg
Quantitative
DNA Footprintmg
300
-
27Ol'
. A
AA
1, AA A
340:
-p-‘ _‘-a
_
__
74
-5 AA
_
__
%210-
f
a_ A
E
*
A
.
25
Fig 2 Sum of the band mtenslties m a lane as a function of Actmomycm D
concentration (6)
site on the original DNA. To choose the concentration of cleavage agent, the
amount of DNA, and the reaction time so as to be m the single-htt regime, one
carries out a series of calibration experiments in the absence of drug. One also
carries out a series of reactions with vartous concentrations of the DNA-bind-
ing drug to be studied to establish the general range of drug concentration over
which drug loading takes place on the polymer Since one 1s trying to measure
a titration curve, one wants more points for drug concentrations for which the
occupation probabthty of a site varies, and fewer for drug concentrations cor-
responding to zero occupation or complete occupation. Afterward, experiments
are performed using drug concentrattons in the range identified. From quanti-
tation of the resulting gel, one obtains spot intenstties as a function of sequence
and drug concentration. In principle, one has carried out a series of digests of
identical DNA fragments in the presence of varying amounts of drug, but
otherwise under identical conditions. The “total cut” plot, the sum of the spot
intensities as a function of drug concentration, is shown for actmomycin D
interacting with a 139-bp fragment from pBR 322 DNA m Fig. 2 (4).
To account for lane-to-lane differences, a “total cut” plot, the sum of all
cleavage products vs the drug concentration, 1s constructed. Since this plot is a
smooth function of drug concentration, deviattons from the curve are due to
experimental error. A least-square-fit stratght line is shown m
Fig.
2; in many
cases, a horizontal line, i.e., total cut = constant, fits the data as well as a func-
tion contammg more parameters. To correct for experimental error, all spot