dna protein interactions
Bạn đang xem bản rút gọn của tài liệu. Xem và tải ngay bản đầy đủ của tài liệu tại đây (26.97 MB, 424 trang )
&IAPTER 1
DNase I Footprinting
Ben& Lehlanc and Ibm Moss
1. Introduction
DNase I footprinting was developed by Galas and Schmitz in 1978
as a method to study the sequence-specific binding of proteins to DNA
(I). In this technique a suitable uniquely end-labeled DNA fragment
is allowed to interact with a given DNA-binding protein and then the
complex is partially digested with DNase 1. The bound protein pro-
tects the region of the DNA with which it interacts from attack by the
DNase. Subsequent molecular weight analysis of the degraded DNA
by electrophoresis and autoradiography identifies the region of pro-
tection as a gap in the otherwise continuous background of digestion
products (for examples, see Fig. 1). The technique can be used to
determine the site of interaction of most sequence-specific DNA-
binding proteins but has been most extensively applied to the study
of transcription factors. Since the DNase I molecule is relatively large
compared to other footprinting agents (see Chapters 3 and 7 in this
volume), its attack on the DNA is more readily prevented by steric
hindrance. Thus DNase I footprinting is the most likely of all the
footprinting techniques to detect a specific DNA-protein interaction.
This is clearly demonstrated by our studies on the transcription factor
xUBF (see Fig. 1B). The xUBF interaction with thexenopus ribosomal
DNA enhancer can be easily detected by DNase I footprinting but
has not yet been detected by other footprinting techniques.
DNase I footprinting can not only be used to study the DNA inter-
actions of purified proteins but also as an assay to identify proteins of
From- Methods m Molecular Biology, Vol. 30: DNA-Protein Interactions: Principles and Protocols
Edlted by G. G Kneale CopyrIght 01994 Humana Press Inc , Totowa, NJ
1
2
Leblanc and Moss
60
60
81
60
81
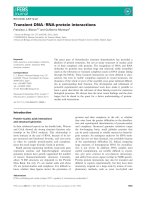
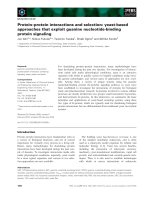
Fig. 1. Examples of DNase I footprints. A. Footprint (open box) of a chicken
erythrocyte DNA binding factor on the promoter of the H5 gene (2) (figure kindly
donated by A. Ruiz-Carrillo). B. Interaction of the RNA polymerase I transcrip-
tion factor xUBF with the tandemly repeated 60 and 81 bp. Xenopus ribosomal
gene enhancers. Both A and B used 5’ end-labeled fragments. (-) and (+) refer to
naked and complexed DNA fragments and (G + A) to the chemical sequence ladder.
DNase I Footprinting 3
interest within a crude cellular or nuclear extract (2). Thus it can serve
much the same function as a gel-shift analysis in following a specific
DNA-binding activity through a series of purification steps. Since
DNase I footprinting can often be used for proteins that do not “gel-
shift,” it has more general applicability. However, because of the need
for a protein excess and the visualization of the footprint by a partial
DNA digestion ladder, the technique requires considerably more
material than would a gel-shift.
DNase I (EC 3.1.4.5) is a protein of roughly 40 8, diameter. It binds
in the minor groove of the DNA and cuts the phosphodiester back-
bone of both strands independently (3). Its bulk helps to prevent it
from cutting the DNA under and around a bound protein. However, a
bound protein will usually have other effects on the normal cleavage
by DNase I, resulting in some sites becoming hypersensitive to DNase
I (see Figs. 1 and 2). It is also not uncommon to observe a change in
the pattern of DNase cleavage without any obvious extended protec-
tion (Fig. 2).
Unfortunately, DNase I does not cleave the DNA indiscriminately,
some sequences being very rapidly attacked whereas others remain
unscathed even after extensive digestion (4). This results in a rather
uneven “ladder” of digestion products after electrophoresis, some-
thing that limits the resolution of the technique (see naked DNA tracks
in Figs. 1 and 2). However, when the protein-protected and naked
DNA ladders are run alongside each other, the footprints are nor-
mally quite apparent. To localize the position of the footprints, G + A
and/or C + T chemical sequencing ladders of the same end-labeled
DNA probe (5) should accompany the naked and protected tracks
(see Note 9). Since a single end-labeled fragment allows one to visu-
alize interactions on one strand only of the DNA, it is usual to repeat
the experiment with the same fragment labeled on the other strand.
DNA fragments can be conveniently 5’ labeled with T4 kinase and 3’
labeled using Klenow, T4 polymerase (fill out), or terminal transferase
(6). A combination of the 5’ and 3’ end-labeling allows both DNA strands
to be analyzed side by side from the same end of the DNA duplex.
DNase I footprinting requires an excess of DNA-binding protein
over the DNA fragment used. The higher the percent occupancy of a
site on the DNA, the clearer a footprint will be observed. It is there-
4 Leblanc and Moss
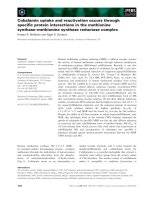
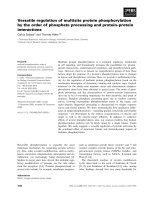
Fig. 2. Course of digestion with increasing amounts of DNase I. Here xUBF was
footprinted on the Xenopus ribosomal promoter using a 5’ end-labeled fragment. The
numbers above the tracks refer to the DNase I dilution, in U&L employed, and (-)
and (+) refer to the naked and complexed DNAs respectively. The predominant
footprints are indicated by open boxes.
fore important not to titrate the available proteins with too much DNA.
This limitation can in part be overcome when a protein also gener-
ates a gel-shift. It is then feasible to fractionate the partially DNase
digested protein-DNA complex by nondenaturing gel electrophore-
DNase I Footprinting
5
sis and to excise the shifted band (which is then a homogeneous pro-
tein-DNA complex) before analyzing the DNA by denaturing gel elec-
trophoresis as in the standard footprint analysis (see Chapters 4, 6,
and 21 in this volume).
Footprinting crude or impure protein fractions usually requires that
an excess of a nonspecific competitor DNA be added, The competi-
tor binds nonspecific DNA-binding proteins as effectively as the spe-
cific labeled target DNA fragment and hence, when present in
sufficient excess, leaves the main part of the labeled DNA available
for the sequence-specific protein. Homogeneous and highly enriched
protein fractions usually do not require the presence of a nonspecific
competitor during footprinting. When planning a footprinting experi-
ment, it is a prerequisite to start by determining the optimal concen-
tration of DNase I to be used. This will be a linear function of the
amount of nonspecific DNA competitor but more importantly and
less reproducibly, this will be a function of the amount and purity of
the protein fraction added. As a general rule, more DNase is required
if more protein is present in the binding reaction, whether or not this
protein binds specifically. Thus, very different DNase concentrations
may be required to produce the required degree of digestion on naked
and protein-bound DNA. A careful titration of the DNase concentra-
tion is therefore essential to optimize the detection of a footprint and
can even make the difference between the detection or lack of detec-
tion of a given interaction.
The following protocol was developed to study the footprinting of
the
Xenopus
ribosomal transcription factor xUBF, which is a rather
weak DNA-binding protein, with a rather broad sequence specificity.
The protocol is not original, being derived from several articles (I, 7).
It does, however, represent a very practical approach that can be
broadly applied. We recommend that the reader also refers to the avail-
able literature for more information on the quantitative analysis of
protein-DNA interactions by footprinting (8).
2. Materials
1.
2X Binding buffer: 20% glycerol,
0.2 mM EDTA, 1 rnM DTT, 20 mM
HEPES, pH 7.9, and 4% polyvinyl alcohol (see Note 1).
2. Poly d(AT): 1 mg/mL in TE (10 mM Tris-HCl, pH 8.0, 1 rnM EDTA).
Keep at -20°C (see Note 2).
6 Leblanc and Moss
3. End-labeled DNA fragment of high-specific activity (see Note 3).
4. Cofactor solution: 10 n&f MgCl*, 5 mM CaClz.
5. DNase 1 stock solution: A standardized vial of DNase I (D-4263, Sigma,
St. Louis, MO) is dissolved in 50% glycerol, 135 n&f NaCl, 15 mM
sodium acetate, pH 6.5, at 10 Kunitz U&L. This stock solution can be
kept at -20°C for
many months (see Note 4).
6.
1M KCl.
7. Reaction stop buffer: 1% SDS, 200 n&f NaCl, 20 mM EDTA, pH 8.0,
40 pg/mL tRNA (see Note 5).
8. 10X TBE buffer: 900 mM Tris-borate, pH 8.3, 20 mM EDTA.
9. Loading buffer: 7M urea, 0.1X TBE, 0.05% of xylene cyanol, and bromo-
phenol blue.
10. Sequencing gel: 6% acrylamide, 7M urea, 1X TBE.
11. Phenol-chloroform (1: 1) saturated with 0.3M TNE (10 mM Tris-HCl,
pH 8.3, 1 mM EDTA, 0.3M NaCl).
12. Ethanol 99% and ethanol 80%. Keep at -20°C.
13. 1M pyridine formate, pH 2.0. Keep at 4°C.
14. 1OM
piperidine.
3. Methods
The footprinting reaction is done in three stages: binding of the
protein to the DNA, partial digestion of the protein-DNA complex
with DNase I, and separation of the digestion fragments on a DNA
sequencing gel.
1, The binding reaction IS performed in a total volume of 50 pL contain-
ing 25 p.L of 2X binding buffer, 0.5 pL of 1 mg/mL poly d(AT), 2-3 ng
of end-labeled DNA fragment (-15,000 cpm) (see Note 6), the protein
fraction and 1M KC1 to bring the final KC1 concentration to 60 mM.
The maximum volume of the protein fraction that can be used will
depend on the salt concentration of this solution. The reaction is per-
formed in a 1.5~mL Eppendorf tube.
2. Incubate on ice for 20 min.
3. During the binding reaction, dilute the DNase I stock solution in dis-
tilled water at 0°C. We suggest working concentrations of about 0.0005-
0.1 Kunitz U&L, depending on the level of protein present (see Note 7
and step 5). A good range is the following: 0.0005; 0.001; 0.005; 0.002;
0.02; 0.08 Kunitz U&L.
4. After the incubation, transfer the reaction tubes in batches of eight to a
rack at room temperature and add 50 pL of the cofactor solution to each.
5. Add 5 pL of the appropriate DNase I dilution to a tube every 15 s (from
DNase I Footprinting
the 0.0005-0.005 Kunitz U&L stocks for naked DNA; from the 0.002-
0.08 ones for DNA + proteins).
6. After 2 min digestion, each reaction is stopped by the addition of 100
PL of the stop solution (see Note 8).
7. After all the reactions have been processed, extract each reaction once
with phenol-chloroform as follows: add 1 vol phenol-chloroform (1: 1)
saturated with 0.3M TNE, vortex briefly, and centrifuge in a desktop
microcentrifuge for about 10 min. Recover the top phase and transfer to
a new mrcrocentrrfuge tube.
8. Add 2 vol(400 pL) of ethanol 99% (-20°C) and allow nucleic acids to
precipitate at -80°C for 20 min.
9. Microcentrifuge for 15 min, -lO,OOOg, and remove the supernatant with
a Pasteur pipet. Check the presence of a radioactive pellet with a Geiger
counter before discarding the ethanol.
10. Add 200 pL of 80% ethanol (-20°C) to the pellet and microcentrifuge
again for 5 min. After removing the supernatant, dry the pellets in a
vacuum dessicator.
11. Resuspend each pellet in 4.5 pL loading buffer, vortex, and centrifuge briefly.
12. A G + A ladder and a molecular weight marker should be run in parallel
with the samples on a sequencing gel (see Note 9). The G + A ladder
can be prepared as follows (5): -200,000 cpm of end-labeled DNA are
diluted into 30 J.~L Hz0 (no EDTA). 2 p.L of 1M pyridine formate, pH
2.0, are added and the solution incubated at 37°C for 15 min. One hun-
dred fifty microliters of 1M piperidine are added directly and the solu-
tion incubated at 90°C for 30 min in a well sealed tube (we use a 500~pL
microcentrifuge tube in a thermal cycler). Add 20 J.~L of 3M sodium
acetate and 500 pL of ethanol and precipitate at -80°C for lo-20 min.
Microcentnfuge (lO,OOOg, 10 min) and repeat the precipitation. Finally,
redissolve the pellet in 200 pL of Hz0 and lyophilize. Resuspend in
loading buffer and apply about 5,000 cpm/track.
13. Prerun a standard 6% acrylamide, sequencing gel (43 x 38 cm, 0.4 mm
thick, 85 W) for 30 min before loading each of the aliquots from the
DNase I digestion, plus the markers. Running buffer is 1X TBE. Wash
the wells thoroughly with a syringe, denature the DNA for 2 min at
9O”C, and load with thin-ended micropipet tips. Run the gel hot to keep
the DNA denatured (see Note 10). After the run, cover the gel in plastic
wrap and expose it overnight at -7OOC with an intensifying screen. We
use either a Cronex Lightning Plus (DuPont, Wilmington, DE) or
Kyokko Special (Fuji, Japan) screens, the latter being about 30% less
sensitive but also less expensive. Several different exposures will prob-
ably be required to obtain suitable band densities.
Leblanc and Moss
4. Notes
1. This binding buffer has been shown to work well for the transcription
factor NF-1 (6), and in our laboratory for both the hUBF and xUBF
factors and thus should work for many factors. Glycerol and PVA (an
agent used to reduce the available water volume and hence concentrate
the binding activity) are not mandatory. The original footprinting con-
ditions of Galas and Schmitz (I) for the binding of the lac repressor on
the Zuc operator were 10 mM cacodylate buffer, pH 8.0, 10 mM MgC12,
5 mM CaCl,, and 0.1 mM DTI’. Particular conditions of pH, cofactors,
and ionic strength may need to be determined for an optimal binding of
different factors to DNA.
2. Since poly d(IC), another nonspecific general competitor, has been
shown to compete quite efficiently with G-C rich DNA sequences, poly
d(AT) is prefered here. The choice of an appropriate nonspecific com-
petitor (whether it is synthetic, as in this case, or natural, e.g., pBR322
or calf thymus DNA) may have to be determined empirically for the
protein studied. When working with a pure or highly enriched protein,
no competitor is usually needed. The DNase I concentration must then
be reduced accordingly (to about naked DNA values).
3. Single-stranded breaks in the end-labeled DNA fragment must be
avoided because they give false signals indistinguishable from genuine
DNase I cleavage and hence can mask an otherwise good footprint. It is
therefore advisable to check the fragment on a denaturing gel before
use. Always use a freshly labeled fragment (3-4 d at the most) because
radiochemical nicking will degrade it.
4. These standardized vials allow for very reproducible results. Glycerol
will keep the enzyme from freezing, as repeated freeze-thaw cycles
will greatly reduce its activity.
5. Do not be tempted to use too much RNA since it causes a very annoying
fuzziness of the gel bands that prevents resolution of the individual bands.
6. The use of S’end-labeling with kinase in the presence of crude protein
extracts can sometimes lead to a severe loss of signal because of the
presence of phosphatases. In these cases 3’end-labeling by “fill out”
with Klenow or T4 polymerase is to be prefered.
7. For naked DNA and very low amounts of protein, working stocks
diluted to 0.0005-0.005 Kunitz U&L give a good range of digestion.
8. It is convenient to work with groups of eight samples during the DNase
I digestion. Cofactor solution is added to eight samples at a time and
then the DNase I digestions begun at 15 s intervals: 15 s after adding
DNase to the eighth sample, stop solution is added to sample 1 and then
to the other samples at 15 s intervals.
DNase I Footprinting
9. In comparing a chemical sequencing ladder with the products of DNase
I digestion, one must bear in mind that each band in the sequencing
ladder corresponds to a fragment ending in the base
preceding
the one
read because chemical modification and cleavage destroys the target
base. For example, if a DNase I gel band corresponds in mobility to the
sequence ladder band read as G in the sequence ACGT, then the DNase I
cleavage occured between the bases C and G. DNase I cleaves the
phosphodiester bond, leaving a 3’-OH, whereas the G + A and C + T
sequencing reactions leave a 3’-P04, causing a mobility shift between
the two types of cleavage ladders. This is a further potential source of
error. However, in our experience the shift is less than half a base and
hence cannot lead to an error in the deduced cleavage site.
10. Sequencing gels are not denaturing unless run hot (7M urea produces
only a small reduction in the
T,,,
of the DNA). A double-stranded form
of the DNA fragment is therefore often seen on the autoradiogram, espe-
cially at low levels of DNase I digestion (see Fig. 2) and can sometimes
be misinterpreted as a hypersensitive cleavage. By running a small quan-
tity of undigested DNA fragment in parallel with the footprint this
error
can be avoided.
Acknowledgments
The authors wish to thank A. Ruiz-Carrillo for providing the
autoradiogram in Fig. 1A. The work was supported by the Medical
Research Council of Canada (MRC). T. Moss is presently an F.R.S.Q.
“Chercheur-boursier” and B. Leblanc was until recently supported
by a grant from the F.C.A.R. of Qudbec.
References
1. Schmitz, A. and Galas, D. J. (1978) DNase I footprinting: a simple method for
the detection of protein-DNA binding specificity Nucleic Acids Res. 5,3 157-
3170.
2. Rousseau, S., Renaud, J., and Ruiz-Carrillo, A. (1989) Basal expression of the
histone H5 gene is controlled by positive and negative c&-acting sequences.
Nucleic Acids Res. 17,7495-75 I 1.
3. Suck, D., Lahm, A., and Oefner, C. (1988) Structure refined to 2 8, of a nicked
DNA octanucleotide complex with DNase I. Nature 332,464-468.
4. Drew, H. R. (1984) Structural specificities of five commonly used DNA nucle-
ases. J. Mol. Biol. 176,535-557.
5. Maxam, A. M. and Gilbert, W. (1980) Sequencing end-labeled DNA with base-
specific chemical cleavages, in Methods in Enzymology, vol. 65 (Grossman,
L. and Moldave, K., eds), Academic, New York, pp. 499-560.
6 Current Protocols in Molecular Biology, Chapter 3 (1991) (Ausubel,
F. M.,
10 Leblanc and Moss
Brent, R., Kingston, R. E., Moore, D. E., Smith, S. A., and Struhl, K., eds.),
Greene and Wiley-Interscience, New York.
7. Walker, P. and Reeder, R. H. (1988) The Xenopus luevis ribosomal gene
promoter contains a binding site for nuclear factor-l. Nucleic Acids Res. 16,
10,657-10,668.
8. Brenowitz, M., Senear, D. F., and Kingston, R. E. (1991) DNase footprint
analysis of protein-DNA binding, in Current Protocols in Molecular Biology
(Ausubel, F. M., Brent, R., Kingston, R. E., Moore, D. E., Smith, S. A., and
Struhl, K., eds.), Greene and Wiley-Interscience, New York, pp. 12.4.1-12.4.11.
&IAPTER 2
Footprinting
with Exonuclease III
Willi Metzger and Hermann Heumann
1. Introduction
Within the last few years footprinting techniques have become
increasingly important in the study of protein-nucleic acid interac-
tions. This is partly the result of a fast-growing number of known
nucleic acid binding proteins but also because of an increase in the
available probes that can be chosen in order to tackle a specific prob-
lem. There are two major groups of probes-the chemical probes and
the enzymatic probes. These enzymatic probes, such as DNase I or
exonuclease III, have the advantage of acting specifically at the DNA.
Chemical probes are often less specific and react also with the pro-
tein. This can disturb the correct interaction of protein and DNA. For
the study of very fragile protein-DNA complexes, therefore, enzy-
matic probes are often preferable.
The exploitation of a specific enzymatic function can also be a
reason for choosing an enzyme as probe. The exonuclease activity in
combination with the processivity of exonuclease III can be the rea-
son to choose this enzyme as a probe when information about the
position of a sequence-specific bound protein is required. A prereq-
uisite for the successful use of exonuclease III as a footprinting probe
is that the half-life of the protein-DNA complex is longer than the
application time of exonuclease III.
From Methods m Molecular B/ology, Vol 30. DNA-Protem Interact/ens Prmcples and Protocols
Edited by- G G Kneale CopyrIght 01994 Humana Press Inc , Totowa, NJ
11
12 Metzger and Heumann
1.1. Description of the Enzymatic Function
of Exonuclease III
Exo III is a monomeric enzyme with a mol wt of 28,000 kDa. It
contains several distinct activities: a 3’-5’ exonuclease activity, a DNA
3’ phosphatase activity, an AP endonuclease activity, and an RNase H
activity (1).
1.2. Principle of the Procedure
Footprinting with Exo III makes use of the 3’-5’ activity (2). After a
protein has been bound specifically to a DNA fragment containing the
signal sequence of the protein, Exo III removes mononucleotides of both
DNA strands in a processive way, starting from the 3’ ends. Free DNA is
fully digested. This is advantageous compared to other probes, since there
are no background problems caused by the presence of free DNA in the
assay. The specifically bound protein blocks the action of Exo III and
leaves a double-stranded DNA only in that region where the protein is
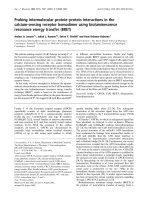
bound (Fig, 1). The length of the remaining DNA strands is determined
by electrophoresis on a sequencing gel using proper DNA length
standards. The DNA strands are detected by radioactive S-end-
labeling of the DNA. A clear allocation of the two resulting bands to
the lower or upper strands is sometimes difficult. This problem can
be solved by removal of one label (e.g., by a restriction cut before
application of Exo III). Figure 1A shows schematically the proce-
dure and Fig. 1B the resulting bands in a denaturing acrylamide gel.
1.3. Interpretation
From the length of the two DNA strands remaining after Exo III
treatment the size of the protected area can be determined. If the DNA
fragment used has a length of k base pairs and the remaining strands
have a length of m and IZ base pairs, respectively, the size of the pro-
tected region (x) is
x=m+n-k.
Correct interpretation of the footprinting data requires a critical
assessment of the action of the probing enzyme on the protein-DNA
complex.
The interpretation is straightforward if the protein is strongly bound
to DNA. The protected region is an upper limit of the DNA region
Footprinting with Exonuclease 13
A,
lengths of bands In the sequencing gel
4
*
b
B
1 2
-
-
-
-
-
-
area protected from
Exo III digest
3 4 5
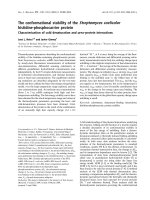
Fig. 1. A. Schematic representation of the Exo III footprinting procedure. B.
Exo III footprint of the complex shown in A. Lane 1’ Size markers. Lane 2. Labeled
DNA-fragment. Lane 3: Labeled DNA-fragment, after Exo III treatment. Lane 4.
Pattern of DNA-protein complex, obtained after Exo III treatment with both S-
ends labeled. Lane 5: Pattern of DNA-protein complex, obtained after Exo III treat-
ment. One label was removed beforehand by cutting with a restriction enzyme as
indicated in A.
interacting with the protein, since the protein acts as a steric hin-
drance for Exo III. An assessment of the protection is more compli-
cated if the strength of interaction between protein and DNA varies
within the interacting domain. Owing to the processivity of Exo III,
this enzyme can nibble into the DNA region, which has a low affinity
to the sequence binding protein, resulting in a smaller size of the
protected region. In order to decide if such a process occurs, a time
dependent measurement of the Exo III digestion is essential.
14
Metzger and Heumann
1.4. Examples fir the Application
of
Exo III
as Footprinting Probe
Exo III was used to follow the movement of
E.
coli RNA poly-
merase during RNA synthesis (3,4). For that purpose the RNA syn-
thesis was stopped in specific frames and the arrested complex was
subjected to Exo III digestion, The result was a set of bands marking
the boundaries of RNA polymerase on the DNA at each step of RNA
synthesis. Exo III offers the possibility of detecting specific protein
DNA interactions even in crude extracts. Only those proteins whose
half-life is longer than the application time of the probing Exo III act
as a block for Exo III (5-7).
2. Materials
2.1. Exonuclease III
Exonuclease III is available from BRL (Gaithersburg, MD) or
Boehringer, Mannheim (Indianapolis, IN). It can be stored over months
at -20°C.
2.2. Reagents and Materials
for
the Sequencing Gel
1. Acrylamide solution: 40% acrylamide, 0.66% his-acrylamide m HzO.
2. 10X TBE: 1M Tris-HCl, pH 8.6; 840 mM boric acid; 10 n-N EDTA.
3. 10% Ammonium persulfate (freshly prepare before use).
4. TEMED.
5. Preparation of an 8% acrylamide gel: Weigh 21 g of urea, add 5 mL of
10X TBE solution and 10 mL of acrylamide solutron. Dissolve under
mild heating. Add double-distilled water to a final vol of 50 mL. Filter
and degas the solutton (filter pore size 0.2 pm). Add 500 pL of 10%
ammonium persulfate solution and 30 pL of TEMED. Pour gel
immediately.
6. Loading buffer for the sequencing gel: 100 mL deionized formamide,
30 mg xylenecyanol FF, 30 mg bromophenol blue, 750 mg EDTA.
7. Electrophoresis buffer: 1X TBE.
2.3. The Nondenaturing Gel
for
the Band-Shifi Assay
1. Acrylamide solution: 30% acrylamide, 0.8% his-acrylamide in H20.
2. 1M Tris-HCI, pH 7.9.
3. 10% Ammonium persulfate (freshly prepare before use).
4. 5% TEMED (diluted in water).
Footprinting with Exonuclease
15
5. Preparation of nondenaturing gel: Mix 240 PL 1M Tris-HCl, pH 7.9,
2.75 mL acrylamide solution, and 25.7 mL of Hz0 and degas. Add 300
pL of 10% ammonium persulfate and 70 pL of 5% TEMED. Pour gel.
6. Loading buffer for the nondenaturing gel (10X solution): 40% sucrose,
0.1% bromophenol blue.
7. 5% Dichloro-dimethylsilane solution (in chloroform).
8. 0.3% y-Methacryl-oxypropyl-trimethoxy-silane, 0.3% acetic acid dis-
solved in ethanol.
9. Electrophoresis buffer: 8 mMTris-HCl, pH 7.9. Store the solutions pro-
tected against light at 4°C. Dilute buffers with bidistilled water.
2.4 Other Items
1. Sequencing gel apparatus (Pharmacia, Piscataway, NJ).
2. Filters for drop dialysis VS, 0.025 pm (Millipore, Bedford, MA).
3. Peristaltic pump.
4. SpeedVac concentrator.
3. Methods
3.1. Establishing the Conditions
for Obtaining Optimum Yield
of
Specific Protein-DNA Complexes
A very elegant method for establishing the optimum conditions for
the formation of a specific protein-DNA complex is acrylamide gel
electrophoresis under nondenaturing conditions. This “band shift
assay” allows
one
to differentiate between bound and unbound DNA
(8,9). It permits the determination of the stoichiometry of the compo-
nents and the optimum salt conditions for specific binding (see Chapter
21). This method can be applied even for high molecular weight pro-
tein DNA complexes if the concentration of the acrylamide is low
enough to enable the complex to enter the gel matrix. The gel compo-
sition described in Section 2.3. is optimal for the study of high-molec-
ular weight complexes (see Note 6).
These low concentration gels are difficult to handle. Therefore, the
glass plates must be subjected to a special treatment by which the gel
is bound to one of the plates:
1. Wash the glass plates (20 x 20 cm) with ethanol.
2. Treat one plate with y-methacryl-oxypropyl-trimethoxy-silane solution.
Wash this plate carefully four times with ethanol to avoid sticking of
the other plate to the gel.
16 Metzger and Heumann
3. Treat the second plate with dichloro-dimethylsilane solution.
4. Form the protein-DNA complex in a volume of about 15 pL under the
desired conditions.
5. Dialyze the complex, if necessary, against the electrophoresis buffer by
drop dialysis in the following way:
a. Pour the dialysis buffer into a Petri dish.
b. Put the filter (Millipore, see Section 2.4.) with the glossy side upward
onto the buffer so that it can float freely.
c. Put the sample as a drop on the filter, and remove the drop after 1 h
of dialysis.
6. Add l/10 vol of the 10X loading buffer to the dialyzed complex and
apply the sample onto the nondenaturing acrylamide gel.
7. Run the gel at 20 V/cm for about 2 h. Pump the buffer from the anode to
the cathode chambers and back again to avoid a pH-decrease in the
anode chamber (see Note 6).
3.2. Establishing the Conditions
for the Digestion of the DNA
1. Label the DNA at the 5’-ends, using T4 polynucleotide kinase
and y- [32P]-ATP. Take an aliquot of the 5’-end-labeled DNA and remove
one 5’-label by cutting with an appropriate restriction enzyme. Use both
types of DNA in the subsequent steps.
2. Take care that the total amount of DNA in an assay of 20 pL is not
below 100 ng. The total amount of radioactivity in one assay should be
around 20,000 cpm. Use the salt conditions that are optimal for the
binding conditions of the probed DNA binding protein. Add 6 rrul4 Mg2+,
if not already present in the incubation assay.
3. Add Exo III. In order to establish the optimum conditions, perform a
series of experiments using different Exo III concentrations varying
between 1 and 200 U, and different incubation periods varying between 1
and 45 min. Exo III seems to be rather stable over a wide range of ionic
strengths; at least no big changes could be observed in the range between
0 and 100 n-&f NaCl (or KCl) in the incubation mixture (see Note 1).
4. Add EDTA to a final concentration of 20 n&f in order to stop the reac-
tion at the appropriate time.
5. Add sodium-acetate to a final concentration of 0.3M followed by 2.5
vol of ice-cold 100% ethanol to precipitate the digested DNA. Keep the
solution at -70°C for 20 min.
6. Spin down the solution in a microcentrifuge for 15 min. Wash the pel-
let with ice-cold 75% ethanol, dry under vacuum, and dissolve in the
loading (formamide) buffer.
Footprinting with Exonuclease 17
7. Boil the sample for 2 min and apply onto a 6-10% sequencing gel. (For
the analysis of fragments in the range 50-150 bases a gel consisting of
8% acrylamide is adequate, as described in Section 2.2.). Use as a length
standard a Maxam-Gilbert sequencing reaction of the 5’-end-labeled
DNA-fragment.
8. Run the gel at 50 W at a temperature of 60°C for 2 h.
9. Expose the gel after electrophoresis to an X-ray film using an intensify-
ing screen at -70°C overnight.
10. Make sure that the free DNA is fully digested (usually much shorter
DNA-pieces than the predicted “half-cut” fragment size [2] are obtained).
3.3. Exo III Digestion of the Protein-DNA Complex
1. Form the complex using the conditions established under Section 3.1.
2. Subject the complex to Exo III digestion using the conditions estab-
lished under Section 3.2. (see Notes 2-6).
3. Add 20 mM EDTA 1% SDS (final concentration) to stop the reaction.
SDS is necessary in order to destroy the protein-DNA complex.
4. Proceed as described in Section 3.2. (steps 5-9) for recovery and gel
electrophoretic analysis of the DNA. For recovery of the DNA a phenol
extraction before the ethanol precipitation might be advisable if the
complex is collected from a crude extract.
3.4. Modifications of the Procedure
Depending on the kind of protein-DNA complexes you are inves-
tigating, several modifications of the procedure described in the pre-
vious section may be useful or necessary. If the protein-DNA
complexes are not homogeneous (e.g., part of the DNA-fragments
are complexed with more than one protein molecule), the desired
complex can be purified by a nondenaturing acrylamide gel as
described in Section 3.1.) provided the different species of complexes
show different gel mobilities and have a half-life long enough to sur-
vive the electrophoresis procedure. Such a purification step requires
the use of ten times the amount of radioactively labeled DNA.
The procedure is as follows:
1. Form the complex.
2. Subject the complex to digestion with Exo III according to Section 3.3.,
step 2.
3. Dialyze the complex by drop dialysis described in Section 3.1,) step 5
against a low salt buffer (e.g., 10 mM Tris-HCl, pH 7.9) in order to
avoid salt effects during electrophoresis.
18 Metzger and Heumann
4. Apply the complex to the nondenaturing gel as described in Section
3.1.) steps 6-7. The half-life of the complex is in most cases not changed
by the Exo III digestion of the DNA.
5. Expose the gel to an X-ray film with an enhancer screen at -70°C. An
hour must be enough to recognize the complex bands. If not, the recov-
ery is too small for a subsequent sequencing gel.
6. Mark exactly the position of the film in order to find the positions of
the bands of interest.
7. Excise the complex-bands of interest with a spatula. The band repre-
senting the free DNA will be visible as a smear after Exo III digestion.
8. To elute the complex DNA put the excised gel slice in 600 pL of bidis-
tilled water. Heat the complex to 90°C for 3 min and shake overnight
at room temperature. The effectiveness of the elution can be easily
monitored by comparing the radioactivity of the eluate with the radio-
activity of the gel slice.
9. Vacuum-dry the eluate in a SpeedVac concentrator.
10. Dissolve the pellet in 10 pL formamide-buffer and spin down the gel residue.
11. Transfer the supernatant to a new Eppendorf cup and apply the sample
to a sequencing gel as described in Section 3.2., steps 7-9.
4. Notes
1. It has been observed that many batches of commercially available Exo
III contain an activity that removes the 5’-label. A 5’-phosphatase or a
5’-3’ exonuclease activity could account for this phenomenon. Filling in
the 5’-protruding ends with a-thio-dNTPs as described by some authors
(10,11) may eliminate the problem. Addition of
E.
coli t-RNA can reduce
the effect, but not completely avoid it.
2. Investigation of the complexes of specific binding of proteins and DNA
m crude extracts by Exo III requires additional precautions m order to
avoid problems caused by nuclease activity during Exo III exposure.
One should add to the incubation assay (5) sodium-phosphate, t-RNA,
deoxyoligonucleotides and fragmented phage DNA (e.g., 2 mM sodium-
phosphate, 1 pg of @X 174 DNA cut with HueIII, 10 l.tg of yeast t-RNA,
1 pg mixed p(dN)s). The author (5) claims this suppresses nuclease
activities contained in the crude extracts, but it may well be that the fact
mentioned under Note 1 plays an additional role.
3. Testing different concentrations of Exo III and different incubation
periods can provide additional information about the nature of the pro-
tein-DNA complex under study. If Exo III is able to “nibble” further
into a protected area with increasing exposure time, this indicates dif-
ferences in the strength of protein-DNA interaction (10).
Footprinting with Exonuclease 19
4. Different binding sites for one or more proteins may be detected as
distinct stop points for Exo III as shown for refs. 12-14. This applies
when working
with crude extracts as for the use of purified factors. It
is necessary, however, that the ratio of DNA:binding proteins is >l ,
5. Heparin, which is often used as a DNA competitor for E. coli
RNA-
polymerase and other DNA-binding proteins, also interacts with Exo
III and reduces its activity markedly.
6. The gel concentration has to be adjusted according to the molecular
weight of the protein-DNA complex. Here we describe the conditions
established for the study of the
E. coli
RNA polymerase (MW 455 000)
and a DNA fragment of 130 bp carrying a promoter (9). For some appli-
cations another widely used nondenaturing gel may be appropriate: 1X
TBE-buffer, 4% acrylamide, 0.1% his-acrylamide. Circulation of the
buffer is not necessary here.
Further Reading
Kow, Y. W. (1989) Mechanism of action of
Escherichia co11 Exonuclease III. Bio-
chemistry 28,3280-3287.
References
1. Rogers, S. G. and Weiss, B. (1980) Exonuclease III of Escherichia coli K-12,
an AP endonuclease. Meth. Enzymol. 65,201-2 11.
2. Shalloway, D., Kleinberger, T., and Livingston, D. M. (1980) Mapping of SV
40 DNA replication origin region binding sites for the SV 40 DNA replication
antigen by protection against Exonuclease III digestion, Cell 20,411-422.
3. Metzger, W., Schickor, P , and Heumann, H (1989) A cinematographic view
of Eschenchia coli RNA polymerase translocation. EMBO J. 8,2745-2754
4. Pavco, P. A and Steege, D. A. (1990) Elongatton by Escherichia co11 RNA
polymerase is blocked in vitro by a site specific DNA binding protein. J. Biol.
Chem. 265,9960-9969.
5. Wu, C (1985) An exonuclease protection assay reveals heat-shock element
and TATA box binding proteins in crude nuclear extracts. Nature, 317,84-87.
6. Loh, T. P., Sievert, L. L., and Scott, R. W. (1990) Evidence for a stem cell-
specific repressor of Moloney murine leukemia virus expression in embryonic
carcinoma cells. Mol. Cell. Biol. 10,4045-4057
7. Carnevali, F., La Porta, C., Ilardi, V., and Beccari, E. (1989) Nuclear factors
specifically bind to upstream sequences of a Xenopus laevis ribosomal protein
gene promoter. Nucleic Acids Res. 17,8 17 l-8 184.
8. Fried, M. and Crothers, D M. (198 1) Equilibria and kinetics of lac repressor-
operator interactions by polyacrylamide gel electrophoresis. Nucleic Acids Res.
9,6505-6525.
9. Heumann, H., Metzger, W., and Niehorster, M. (1986) Visualization of mter-
mediary transcription states in the complex between Escherichia coli DNA-
20
Metzger and Heumann
dependent RNA polymerases and a promoter-carrying DNA fragment using
the gel retardation method. Eur. J. Biochem. 158, 575-579.
10. Straney, D. C. and Crothers, D. M. (1987) A stressed intermediate in the for-
mation of stably initiated RNA chains at the Escherichiu coli lac UV 5 pro-
moter. J. Mol. Biol. 193,267-278.
11. Straney, D. C. and Crothers, D M (1987) Comparison of the open complexes
formed by RNA polymerase at the Escherichia coli lac UV 5 promoter. J. Mol.
Biol. 193,279-292.
12. Gaur, N. K., Oppenheim, J., and Smith, I. (1991) The Bacillus subtilis sin
gene, a regulator of alternate developmental processes, codes for a DNA-bind-
ing protein, J. Bact. 173,678-686.
13. Owen, R. D., Bortner, D. M., and Ostrowski, M. C. (1990) rus oncogene acti-
vatton of a VL30 transcriptional element is linked to transformation. Mol. Cell.
Biol. 10, l-9.
14. Wilkison, W. O., Min, H. Y , Claffey, K. P., Satterberg, B. L., and Spiegelman,
B. M. (1990) Control of the adipisin gene in adipocyte differentiatton. J. Biol.
Chem. 265,477-482.
CHAPTER
3
Hydroxyl Radical Footprinting
Peter Schickor and Hermann Heumann
1. Introduction
The basic principle of the DNA footprinting technique is the mea-
suring of the accessibility of the DNA by a probe. The probe can be
an enzyme or a chemical reagent that is able to cut the DNA back-
bone. The target is a DNA fragment with a signal-sequence for a
sequence-specific binding protein. The sites on the DNA that interact
with the protein are excluded from cutting by the probe. These sites appear
after electrophoresis as blanks in the otherwise regular cutting pattern,
which represent the characteristic footprint of the protein.
It is obvious that the footprinting pattern is determined by the type
of probe being used. Hydroxyl radicals as probes are very convenient
to handle. They are distinguished by a number of advantages com-
pared to other probes:
1. Hydroxyl radicals cut the DNA with almost no sequence dependence.
2. The resolution of the footprint is very high (1 bp), because the probe is
very small.
3. The cutting reaction is compatible over a wide range of buffer composi-
tions, salt, pH, and temperature. Only glycerol, a radical scavenger, inter-
feres with the cutting when present at concentrations higher than 0.5%.
4. All chemicals needed are easily available and uncomplicated in handling.
1.1. Generation and Action
of
Hydroqyl Radicals
Hydroxyl radicals are generated according to the Fenton reaction
by reduction of iron (II) with hydrogen peroxide as follows:
From. Methods m Molecular Biology, Vol. 30 DNA-Protem /nteract/ons: Principles and Protocols
Edited by’ G G Kneale Copynght 01994 Humana Press Inc , Totowa, NJ
21
22
Schickor and Heumann
Fe(EDTA)2- + H202 -> Fe(EDTA)- + OH- + OH*
ascorbate
The resulting iron (III) is reduced by ascorbate back to iron (II),
which can start a new cycle. The use of a negatively charged iron
(EDTA)-complex prevents the iron from interacting electrostatically
with DNA, so the only reactant interacting with DNA is the hydroxyl
radical (I).
The exact manner in which hydroxyl radicals act on DNA is still not
known. The radicals are thought to abstract an H-atom from the sugar
moiety of the DNA backbone, and secondary reactions of the resulting
sugar radical cause the backbone to break, leaving a gap in one strand of
the double helix with phosphate groups on either side (2).
1.2. Principle of the Procedure
After formation of the complex of a sequence-specific binding pro-
tein and a DNA fragment carrying the binding sequence (see Fig. l),
the complex is subjected to hydroxyl radical treatment. Hydroxyl radi-
cals introduce single base deletions randomly distributed in the DNA.
The concentration of the hydroxyl radicals is adjusted so that the yield
of deletions is less than one per DNA, that is, approx 10% of the
DNA fragments are affected. Cutting of the DNA is prevented at those
sites on the DNA where the protein is bound. This partially cut DNA
is applied to a sequencing gel. The DNA is detected by radioactive
labeling. If the label is specifically fixed to one end of one DNA
strand, a DNA ladder is produced that is similar to that obtained by
sequence analysis. Blanks within this regular ladder indicate the sites
where the protein is bound. This becomes more obvious if a refer-
ence DNA is included that has been subjected to the same procedure
but without previous protein binding. If complex formation is incom-
plete (i.e., the assay contains free DNA), the obtained footprinting
pattern becomes blurred. This can be avoided by separating the
hydroxyl radical treated protein DNA complex from free DNA by a
nondenaturing gel electrophoresis (Fig. 2) before application to a
sequencing gel. Figure 3 shows schematically the obtained footprint-
ing pattern of a protein DNA complex depicted in Fig. 1.
Hydroxyl Radical Footprinting
protected region
b
23
5’ l
3’
3’ *
-
5’
modulated
full
protection
protection
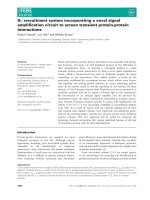
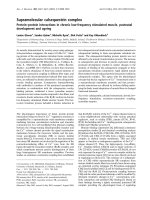
Fig. 1. A putative DNA-binding protein interacts with the DNA over three heli-
cal turns. The major portion of the protein interacts with only one side of the DNA
over two helical turns. A minor portion of the protein wraps fully around the DNA.
(*) Indicates the position of the radioactive label.
+
3’ 5’
00
_ complexed
DNA
- free DNA
Fig. 2. Protein-DNA complexes are separated from free DNA by nondenaturing
gel electrophoresis. The two lanes represent the same complex with a single label
at one end of the DNA, at the 3’ end, and at the 5’ end, respectively. Hydroxyl
radicals create gaps in the DNA, which cause a larger retardation of the modified
fragments within the gel. This effect is visible only in the free DNA.
1.3. Interpretation
of the
Footprinting Pattern
Figure 3 shows that a full experimental set contains six DNA lad-
ders, length standtids, free DNA as reference, and the complex. Blanks
in the DNA ladder indicate exclusion of radical attack of the DNA
because of the presence of the bound protein. These blanks can be
24
Schickor and Heumann
+
3’ labeled 5’ labeled
Gl 2
3 4 G
Fig. 3. The bands of the nondenaturing gel in Fig. 2 containing the complex and
the free DNA are eluted and applied (under denaturing conditions) on a sequencing
gel. Lanes 1 and 4 show the sequence ladder of free DNA labeled at the 3’ and the
5’ end, respectively. Lanes 2 and 3 show the complex containing the bands. The
complex depicted schematically in Fig. 1 would result in the footprint displayed in
lanes 2 and 3. Lanes G contain the length standards obtained by a G-specific Maxam-
Gilbert sequencing reaction.
assigned to a specific sequence by means of the previous assignment
procedure.
The following information can be extracted from the hydroxyl radi-
cal footprinting pattern:
1. The total size of the DNA sequence Interacting with the protein can be
read from the the position of the blanks.
2. A variation of the intensity of the bands within the interacting sequence
Hydroxyl Radical Footprinting
reflects differences in the modes of interaction. By a comparison of the
footprints on both strands the modes of interaction can often be interpreted:
a. If both strands show a blank at the same region it indicates that the
protein wraps around the DNA.
b. A blank at only one strand indicates single-strand formation with
one strand protected by interaction with the protein.
c. Modulation of the intensity of the bands with a regular phasing
according to the helix repeat (e.g., 10.3 bp for B-DNA) indicates
binding of the protein to one side of the DNA. This interpretation is
supported if the complementary strand shows the same pattern but
with an offset of two or three bases in the 3’ label strand. This offset
is a consequence of the helicity of the DNA, as shown schemati-
cally in Fig. 1.
1.4.
Exampkw fir the Application
of
Hydroxyl Radicals aa B’ootprinting Probes
1.4.1. Protein DNA Complexes
Hydroxyl radicals were used to follow the formation of the tran-
scriptionally active “open” complex between the DNA-dependent
RNA polymerase of E.
coli
and a specific promoter. Schickor et al.
(3) could clearly show the transition from a “closed” complex to an
“intermediate” to the final “open” complex. Each complex is charac-
terized by a specific “footprint.”
The movement of
E. c&i
RNA polymerase during mRNA synthe-
sis was followed by probing a series of specifically arrested tran-
scribing complexes with hydroxyl radicals (4,5).
The interaction of DNA with histones in a nucleosome was inves-
tigated by Hayes et al. (6). Using hydroxyl radicals, they showed that
the helical periodicity of the DNA changes on nucleosome formation.
Furthermore, they could detect two distinct regions of DNA with dif-
ferent helical periodicities within the nucleosome.
Specific contacts between h-repressor and cro-protein with the cog-
nate operator DNA were revealed by probing these complexes with
hydroxyl radicals. Both proteins display the same mode of binding,
interacting with only one side of the operator sequence (7).
1.4.2. Antibiotic DNA Complexes
Mithramycin, a small antitumor antibiotic drug, was shown to bind
to the minor groove of GC-rich DNA sequences, thereby protecting
only 3 bases from hydroxyl radical attack (8).