flavoprotein protocols
Bạn đang xem bản rút gọn của tài liệu. Xem và tải ngay bản đầy đủ của tài liệu tại đây (1.19 MB, 247 trang )
Flavoprotein
Protocols
Methods in Molecular Biology
TM
Edited by
Stephen K. Chapman
Graeme A. Reid
VOLUME 131
HUMANA PRESS
UV-Visible Spectroscopy 1
1
From: Methods in Molecular Biology, vol. 131: Flavoprotein Protocols
Edited by: S. K. Chapman and G. A. Reid © Humana Press Inc., Totowa, NJ
1
UV-Visible Spectroscopy
as a Tool to Study Flavoproteins
Peter Macheroux
1. Introduction
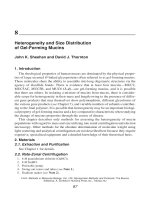
The essential cofactor of flavoproteins is derived from riboflavin (Fig. 1),
which consists of the isoalloxazine ring system with a ribityl side chain attached
to the central N-10 position in the pyrazine moiety.
This precursor is phosphorylated at the 5'-hydroxyl group by flavokinase to
yield flavin mononucleotide (FMN). In a second ATP-dependent reaction, FAD
pyrophosphorylase attaches an AMP moiety to FMN yielding flavin adenine
dinucleotide (FAD). Both cofactors are widely distributed in nature. The side
chain plays an important role in binding of the flavin ring system to the protein
and therefore the majority of flavoproteins have a strong preference for either
FMN or FAD. On the other hand, riboflavin does not play a general role as a
cofactor in flavoenzymes. In addition to the noncovalent binding of the flavin
to the protein, covalent linkage to an amino acid residue via the 8- or 6-position
of the isoalloxazine ring system is also found (see Chapter 13). In all cases, the
mechanistically relevant moiety is the isoalloxazine ring system that serves as
a reversible reduction-oxidation catalyst in many biological redox processes
(for a review see: (1,2)). This is also the structural component of the flavin
cofactor that is responsible for light absorption in the UV and visible spectral
range giving rise to the yellow appearance of the flavin and of flavoproteins
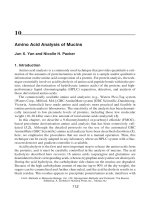
(Latin: flavus = yellow). In the oxidized form of the flavin two peaks at ≈ 360
and ≈ 450 nm are observed (see Fig. 2). Method 1 describes a procedure to
determine the extinction coefficient for a flavin bound to a particular flavo-
protein which is based on the known extinction coefficient for free FMN and
FAD (12,500 and 11,300 M
–1
cm
–1
, respectively). Binding of the flavin to
the protein moiety alters the extinction coefficient covering a range from
2 Macheroux
10,500–15,400 M
–1
cm
–1
(3). In some cases the protein lowers the pKa for the
N(3)-hydrogen (= 10.3 for free flavin) resulting in deprotonation and a lower
extinction coefficient. This was observed for glycolate oxidase (9200 M
–1
cm
–1
,
(4)). Extinction coefficients in that range may therefore indicate that the pro-
tein preferentially binds the N(3)-deprotonated flavin.
Fig. 1. Structure of riboflavin.
Fig. 2. UV-visible spectrum of FMN in its oxidized and reduced form.
UV-Visible Spectroscopy 3
Knowledge of the extinction coefficient can be helpful to assess the stoichi-
ometry of the flavin and protein moiety. In general one flavin per enzyme active
site is found and substoichiometric concentrations of flavin may indicate deple-
tion of the flavin during purification and handling. In these cases it may be
possible to reconstitute the flavoprotein by supplementing the flavin cofactor
(see Chapter 11).
The absorbance in the UV-visible spectral range presents several conve-
nient advantages:
1. Since the flavin chromophore is an essential component of the catalytic machin-
ery, observable spectral changes during the enzymatic reaction yield important
information concerning the reaction mechanism. These spectral changes can be
observed using rapid reaction kinetic instruments (see Chapter 5).
2. Binding of substrates, substrate analogs and inhibitors can be monitored in many
cases by spectrophotometry. Titrations with the compound of interest yield
dissociation constants and information concerning changes in the active site
environment.
3. The protein moiety perturbs the flavin spectrum yielding information on the fla-
vin environment in the binding pocket as well as the ionization state of the flavin.
4. During protein purification, the flavin absorbance can be utilized to locate the
fraction of interest (in addition to other parameters, such as activity, if known).
This is particularly useful when flavoproteins are prepared from an overproduc-
ing host system.
Although some flavoproteins have quite distinctive UV-visible spectra it is
not feasible to identify a flavoprotein by the spectral properties of its flavin cofac-
tor. On the other hand, the course of reduction of the oxidized flavin very much
depends on the protein moiety: The flavin is either reduced directly to its two-
electron reduced form (“hydroquinone”) or via its one electron reduced state
(“semiquinone”). In the latter case, the flavin semiquinone may either be proto-
nated (neutral or blue semiquinone) or monodeprotonated (anionic or red semi-
quinone). These two radical species are easily distinguishable by their spectral
properties: The neutral semiquinone radical has a characteristic long wavelength
absorbance at 580–620 nm (ε≈4,000 M
–1
cm
–1
) whereas the anionic semi-
quinone radical has a strong absorbance around 380 nm (ε≈16,000 M
–1
cm
–1
)
with an additional sharper peak at 400 nm (5,6). It was also recognized that the
propensity to stabilize the flavin radical is linked to the enzymatic function of
the flavoprotein. This feature was employed to classify the large number of
flavoproteins in an attempt to correlate the function of the protein with the
properties of its flavin cofactor (6,7). The occurrence of the flavin radical does
not only depend on the protein moiety but is also affected by other external
physico-chemical factors, such as pH. Equally important is the effect of ligands
4 Macheroux
(substrate, substrate analogs or inhibitors) on the generation of a flavin radical
species. Therefore, the reduction of a given and perhaps unknown flavoprotein
under various conditions yields important basic information on the type and
possible reaction mode of the flavoprotein.
Subheading 2.2, Method 2 provides information on the reducing behavior
of a flavoprotein. Reduction of the flavin to its two-electron reduced form
results in the loss of the two major absorbance peaks in the UV-visible range
and causes bleaching of the flavin chromophore (see Fig. 2). The procedure
described in Method 2 leads to a stepwise reduction of the flavin and hence the
absorbance peaks will diminish until complete reduction is achieved with the
final spectrum resembling that shown in Fig. 2 for reduced FMN (FMN
red
).
Another notable feature of such a straightforward reduction to the two-electron
reduced flavin is an isosbestic point around 330 nm. However, if a flavin semi-
quinone is stabilized by the protein moiety then reduction will result in the
appearance of a flavin radical identifiable by the spectral characteristics men-
tioned above (5,8). Consequently, the isosbestic points will change during the
course of the photoreduction and will depend on the relative concentrations of
oxidized, radical and reduced flavin which are determined by the equilibrium
constants of the three redox states. The extent of semiquinone stabilization can
be estimated by plotting the absorbance at a wavelength solely due to the semi-
quinone species (e.g., the long wavelength absorbance of the neutral semi-
quinone above 580 nm) vs the time of light irradiation (or equivalents of
another reductant added) (9). The method described here for reduction of a
flavoprotein enjoys a long, successful history and serves as an ideal starting
point (8). Further explorations into the reducing properties of a flavoprotein
can be achieved with slight alterations of the procedure (see Note 4.) and with
the same equipment (see Subheading 2.2.).
2. Materials
2.1. Method 1. Determination of the Flavin Extinction Coefficient
1. Spectrophotometer
2. A matched pair of quartz cuvets (1-cm path length, semimicro: 1.2 mL max. vol.)
3. Flavoprotein in a suitable buffer (transparent in the 300–800 nm range)
4. Trichloroacetic acid (50%, v/v)
5. Sodium carbonate (solid)
For the alternative methods discussed in Subheading 3.1.1. the following
reagents are required:
6. 8 M urea or guanidinium hydrochloride
7. Sodium dodecylsulfate (2% w,v)
UV-Visible Spectroscopy 5
2.2. Method 2. Photochemical Reduction of Flavoproteins
1. Spectrophotometer
2. Cuvets for anaerobic work (1-cm path length, semimicro: 1.2 mL max. vol.).
These cuvets have an upward extension with a stopcock at the outer end in order
to connect the cuvet to a gas exchange line. The extension can also serve to equip
the cuvet with a side arm in order to deposit other reagents before anaerobicity is
established. The same cuvet can be utilized in a glove box (see Subheading 2.2.3.).
3. Gas exchange line: device that serves to repeatedly evacuate the cuvet with a
vacuum pump and exchange the air in the cuvet with nitrogen or argon. Alterna-
tively, a glove box kept under nitrogen or argon can be utilized to achieve
anaerobicity. In this case all reagents can be sparkled with nitrogen or argon and
then transferred to the glove box. The cuvet can be loaded with the sample (if
necessary the side arm is used to deposit a reagent, such as a substrate) and sealed
by closing the stopcock.
4. Light source (slide projector, microscope illumination system)
5. Flavoprotein in a suitable buffer containing either 1 mM EDTA or potassium
oxalate as photosubstrates.
3. Methods
3.1. Method 1. Determination of the Flavin Extinction Coefficient
1. Dissolve 0.5–1 mg of the flavoprotein in an appropriate buffer to give a final
volume of 900 µL. For a protein with a molecular mass of M
r
= 50,000 this will
give an approximate absorbance at the maximum at ≈ 450 nm of 0.1–0.2
(depending on the extinction coefficient).
2. Transfer sample to a semimicro cuvet and record an UV-visible absorbance spec-
trum from 650–300 nm. Read absorbance at the maximum ≈ 450 (reading1)
3. Transfer sample to an Eppendorf tube, add 100 µL of 50% trichloroacetic acid
(TCA), spin down white precipitate in a microcentrifuge at maximal speed for
2 min (see Note 2).
4. Adjust pH to the original pH using solid sodium carbonate.
5. Transfer supernatant (yellow) to semimicro cuvet and record UV/visible absor-
bance spectrum from 650–300 nm. Correct the obtained spectrum for the dilution
factor. Read absorbance at the absorbance maximum at ≈ 450 nm (reading 2).
The extinction coefficient of the flavoprotein can now be calculated using the
following relationship:
ε
unknown
= ε
FMN/FAD
× reading 1/reading 2
3.2. Method 2. Photochemical Reduction of Flavoproteins
1. Dissolve 0.5–1 mg of the flavoprotein in 1 mL of an appropriate buffer including
1 mM EDTA or potassium oxalate and transfer to a cuvet. Record spectrum from
800–300 nm.
6 Macheroux
2. Remove oxygen with the aid of either a gas exchange line or in a glove box (for
a brief description see Subheading 2.2.). Take care to keep the cuvet sealed until
(step 5).
3. Record absorbance spectrum in the same range as in (step 1) (using the overlay
option of the spectrophotometer software).
4. Start reduction by light irradiation. Initially, short intervals of 5–10 s are recom-
mended. Record spectrum after each reduction step until no further spectral
changes are observed.
5. Open cuvet to air and record spectrum after complete reoxidation of the sample.
4. Notes
1. In some cases the flavin is covalently linked to the protein moiety and therefore
coprecipitates in the denaturation step. However, coprecipitation was also
reported for other cases where the flavin is not covalently attached to the protein.
Unfolding of the protein in 8 M urea or guanidinium hydrochloride and subse-
quent precipitation of the protein can be helpful to distinguish these two possi-
bilities (10).
2. Although precipitation of the protein in 5% TCA works well in general, the low
pH may also cause decomposition of the flavin. Therefore the time at low pH
should be kept to a minimum (see steps 2–4). In some cases cooling to 4°C helps
to prevent such unwanted decomposition. In order to confirm the obtained result,
TCA can be replaced by another denaturant, preferably sodium dodecyl sulfate
(use 0.2% final concentration).
3. The spectrum recorded in Subheading 3.2., step 3 should be identical to the one
recorded initially. Changes may be observed if the concentration of the flavopro-
tein is slightly increased due to partial evaporation of the solvent. Cooling the
sample with ice during anerobization may help to prevent this. Also, denatur-
ation of the protein may occur during this process (turbidity). This can be spotted
at longer wavelength as a baseline drift.
4. Any white light source can be used for irradiation (see Subheading 2.). For longer
irradiation times (>1 min), it is recommended that the sample is shielded from
the developing heat of the light source and that the sample be properly thermo-
statted to the temperature set in the spectrophotometer.
5. Although reduction with light is very convenient for most applications, a chemi-
cal reducing agent such as an anaerobic solution of dithionite or an enzymatic
system can be used to reduce the flavoprotein. Likewise, where appropriate, a
reducing substrate of the flavoenzyme (oxidases, dehydrogenases) can be used to
achieve reduction.
6. In some cases photoreduction is slow and the use of µM concentrations of 5-deazaribo-
flavin as a catalyst is recommended (11,12).
7. Especially when the anionic semiquinone is encountered, further photoreduction
to the fully reduced flavoprotein is sometimes difficult to achieve. This situation
can be circumvented by using an alternative reductant (see above).
UV-Visible Spectroscopy 7
References
1. Massey, V. and Ghisla, S. (1983) in Biological Oxidations Vol. 34, pp. 114–139,
Springer-Verlag, Mosbach, Germany.
2. Ghisla, S. and Massey, V. (1989) Mechanisms of flavoprotein-catalyzed reac-
tions. Eur. J. Biochem. 181, 1–17.
3. Ghisla, S., Massey, V., Lhoste, J M., and Mayhew, S. G. (1974) fluorescence and
optical characteristics of reduced flavines and flavoproteins. Biochemistry 13(3),
589–597.
4. Macheroux, P., Massey, V., Thiele, D. J., and Volokita, M. (1991) Expression of
spinach glycolate oxidase in Saccharomyces cervisiae: Purification and charac-
terization. Biochemistry 30, 4612–4619.
5. Müller, F., Brüstlein, M., Hemmerich, P., Massey, V., and Walker, W. H. (1972)
Light-absorption studies on neutral flavin radicals. Eur. J. Biochem. 25(3), 573–580.
6. Massey, V. and Hemmerich, P. (1980) Active-site probes of flavoproteins.
Biochem. Soc. Trans. 8, 246–257.
7. Ghisla, S. and Massey, V. (1986) New flavins for old: artificial flavins as active
site probes of flavoproteins. Biochem. J. 239, 1–12.
8. Massey, V. and Palmer, G. H. (1966) On the existence of spectrally distinct classes
of flavoprotein semiquinones. A new method for the quantitative production of
flavoprotein semiquinones. Biochemistry 5, 3181–3189.
9. Mayhew, S. G. (1971) Studies on flavin binding in flavodoxins. Biochim. Biophys.
Acta 235, 289–302.
10. Macheroux, P., Hill, S., Austin, S., Eydmann, T., Jones, T., Kim, S O., Poole, R.,
and Dixon, R. (1998) Electron donation to the flavoprotein NifL, a redox-sensing
transcriptional regulator. Biochem. J., 332, 413–419.
11. Massey, V. and Hemmerich, P. (1977) A photochemical procedure for reduction
of oxidation-reduction proteins employing deazariboflavin as catalyst. J. Biol.
Chem. 252(16), 5612–5614.
12. Massey, V. and Hemmerich, P. (1978) Photoreduction of flavoproteins and other
biological compounds catalyzed by deazaflavins. Biochemistry 17(9), 9–17.
Identifying and Quantitating FAD and FMN 9
9
From: Methods in Molecular Biology, vol. 131: Flavoprotein Protocols
Edited by: S. K. Chapman and G. A. Reid © Humana Press Inc., Totowa, NJ
2
Identifying and Quantitating FAD and FMN in
Simple and in Iron-Sulfur-Containing Flavoproteins
Alessandro Aliverti, Bruno Curti, and Maria Antonietta Vanoni
1. Introduction
The number of known flavin-containing proteins is steadily increasing
thanks to the combination of several factors. Among them the following may
be of particular interest: (1) increasing power of separation techniques and of
molecular biology tools for overproduction of various proteins, and (2) recog-
nition of putative flavin-dependent proteins through analysis of amino acid
sequences deduced from those of (putative) genes discovered through genome-
sequencing projects. Particularly interesting is the fact that novel flavin-depen-
dent proteins, which play roles different from electron transport or redox
catalysis are being discovered (e.g., gene transcription regulation as in the case
of NifL, (1)). On the other hand, the picture can be complicated by the fact that
the same protein may harbor one or more flavin nucleotides plus one or more
additional cofactors (2). Among such nonflavin centers iron-sulfur clusters
are common.
Essential steps for the characterization of flavin-containing enzymes are, (1)
the recognition of the presence of a flavin cofactor; (2) the identification of the
flavin cofactor(s), and (3) the determination of the stoichiometry of the bound
flavin cofactor(s). Several methods are available in the literature in order to
achieve such goals, and each flavinologist is indeed familiar with one or more
of them (3–6). We present here three different procedures for both the identifi-
cation and the quantitation of protein-bound flavin cofactors: a fluorimetric
method, a spectrophotometric method, and a high-performance liquid chroma-
tography (HPLC)-based method. These procedures, in our experience, yield
reliable qualitative and quantitative information, while requiring limited
10 Aliverti, Curti, and Vanoni
amounts of material, minimum sample preparation, and common laboratory
equipment.
2. Materials
1. Flavin adenine dinucleotide (FAD) and flavin mononucleotide (FMN) used to
construct standard curves are from Sigma Chemical Co. (St. Louis, MO). Stock
solutions (5 mM) are prepared in MilliQ (Millipore, Bedford, MA) water and
stored at –20°C. Individual batches of flavin nucleotides should be checked for
the presence of interfering impurities. If required, FAD and FMN can be purified
by the HPLC method described in this chapter. The concentrations of FAD and
FMN solutions are determined spectrophotometrically, by recording the absor-
bance spectrum of 25–100 µM solutions in buffer at pH 7–8. The following
extinction coefficients are used:
Flavin λ
max
ε(M
–1
cm
–1
)Reference
FAD 450 11,300 7
FMN 446 12,200 8
FAD or FMN 473 9200 This work
2. Sodium dodecyl sulfate (SDS) is from Sigma. A 10% (w/v) solution is prepared
in MilliQ water and stored at room temperature. Snake venom phosphodiesterase
(PDE) (3 mU/µL) is from Boehringer-Mannheim (Mannheim, Germany), and
was stored at 5°C.
3. Enzymes used to test the methods presented are prepared in our laboratories
according to standard procedures.
a. The G298A mutant of glutamate synthase (GltS) β subunit is prepared with a
modification of the protocol used to prepare the wild-type recombinant GltS β
subunit (P. Morandi, B. Valzasina, and M. A. Vanoni, unpublished data, see ref. 9),
and is stored in 25 mM HEPES/KOH buffer, pH 7.5, 10% glycerol at –80°C.
b. The recombinant GltS α subunit is prepared as described in (10) and stored in
25 mM PIPES/KOH buffer, pH 7.5, 10% glycerol, 0.1 mM dithiothreitol (DTT).
c. The recombinant GltS holoenzyme is prepared using a procedure similar to
that used for the preparation of GltS from Azospirillum cells (H. Stabile, and
M. A. Vanoni, unpublished data, see ref. 11). It is stored in 25 mM HEPES/
KOH, pH 7.5, 10% glycerol, 1 mM ethylenediaminetetraacetic acid (EDTA),
1 mM 2-oxoglutarate and 1 mM DTT.
d. Recombinant spinach leaf ferredoxin-nicotinamide-adenine-dinucleotide
phosphate (NADP)
+
-reductase (FNR) is prepared as described in (12).
e. Maize root FNR is produced by heterologous expression in E. coli using a
modified form of the expression plasmid described in (13), and purified using
a procedure similar to that used for the spinach FNR, replacing anion-
exchange with hydrophobic-interaction chromatography on Phenyl-Sepharose
(Pharmacia, Uppsala, Sweden) (A. Aliverti et al., manuscript in preparation).
Fd/FNR chimeric protein was purified as described (14).
Identifying and Quantitating FAD and FMN 11
4. Protein concentration is determined using the method of Bradford (15), the
Amresco Protein Assay Reagent (Amresco, Inc., Solon, OH), and bovine serum
albumin as the standard protein. One to 3 µg protein are used for each assay.
5. 10 mM HEPES/NaOH, pH 7.5.
6. 10 mM Tris/HCl, pH 7.5–8 (at 25°C).
7. 10 mM HEPES/KOH, pH 7.5, or 50 mM Tris-HCl, pH 7.6 (at 25°C). All buffers
(items 5–7) are freshly made in MilliQ water (Millipore) and filtered through
0.2 µm sterile filters.
8. Protein samples are used directly for analyses or after gel filtration through Sephadex
G25 (medium) columns. PD10, prepacked disposable columns from Pharmacia are
used. All samples are either centrifuged in a microfuge in the cold (top speed, 10 min)
or filtered through 0.45 µm filter cartridges or 0.1 µm centrifugal filters (Ultrafree-
MC filter units, Millipore) to remove even faint turbidity.
9. Emission spectra are recorded with a Jasco FP-777 spectrophotofluorimeter
(Jasco, Inc., Easton, MD) at 20°C.
Fluorimeter settings are as follows:
λ
ex
: 450 nm Excitation slit 5 nm
λ
em
: 480–600 nm Emission slit 5 nm
Gain: High
Scan speed 100 nm/min
Response: 1 sec Data interval 0.5 nm
Instrument zeroing conditions:
Emission shutter: closed λ
ex
: 450 nm λ
em
: 480–600 nm
10. Absorbance spectra are recorded with Hewlett-Packard 8453 diode-array
(Hewlett-Packard, Palo Alto, CA), Cary 219 (Varian, Palo Alto, CA) or Uvikon
810 (Kontron Elektronik, Eching, Germany) spectrophotometers at 20 or 25°C,
with identical results.
11. HPLC analyses are carried out using a µBondapack C-18 silica column (Waters As-
sociates, Milford, MA) connected to a Waters 600E HPLC system equipped with a
UK6 manual injector and controlled through the Millenium software (Waters) run
on a PC. A 2-mL sample loop is used, and the column is not thermostated. Eluate
absorbance is monitored continuously using an on-line 486 detector (Waters) set at
264 nm. Solvents are 5 mM ammonium acetate, pH 6.5, and methanol (HPLC grade).
Both solvents are filtered through 0.22 µm filters and degassed by continuous helium
bubbling.
3. Methods
3.1. Fluorimetric Identification of the Flavin Cofactor
as FAD or FMN
The method of Forti and Sturani (16) is used. It exploits the fact that fluores-
cence of a FMN solution is 10-fold higher than that of an FAD solution of the
same concentration, and that phosphodiesterase (PDE) catalyses the conver-
12 Aliverti, Curti, and Vanoni
sion of FAD into FMN and adenosine monophosphate (AMP). Thus, the fluo-
rescence intensity of a flavin-containing solution is measured before and after
addition of PDE. No increase of fluorescence is interpreted as due to absence
of FAD in the solution; a 10-fold increase of fluorescence allows the identifi-
cation of the flavin present as FAD, an intermediate increase of fluorescence
allows the calculation of the relative concentration of FAD and FMN in the
starting solution. Several modifications of the following method are pos-
sible, depending on the quantity of enzyme and on the equipment available.
This method can also be employed to test the purity of the FAD stock solu-
tion used.
3.1.1. Calibration and Linearity Test of the Assay
It is important to determine the range of linearity of the instrument by mea-
suring the emission spectrum of solutions containing increasing concentrations
of FAD or FMN in the same buffer, in the same cuvet, and under the same
settings that will be used for the actual experiment.
1. A 0.25–0.3 mM solution of FAD or FMN is prepared in water, or in the buffer
that will be used for the enzyme solution. Its concentration is determined by mea-
suring the absorbance spectrum (see Subheading 2.1.).
2. One microliter aliquots are added to a cuvet containing 2 mL buffer. Alterna-
tively, a 200 µL cuvet can be used (see Note 1).
3. After mixing, emission spectra are recorded.
4. The emission intensity at 524 nm, corrected for buffer emission value and dilu-
tion (F
524
), is plotted as a function of flavin concentration.
5. The initial linear part of the curve sets the interval of fluorescence values that will
yield reliable results. From the slope of the line F
524
= f
FAD
[FAD] or F
524
= f
FMN
[FMN],
the values of intensity of light emitted at 524 nm by a 1 µM solution of FAD
(f
FAD
) or FMN (f
FMN
) are also calculated.
3.1.2. Fluorimetric Analysis of the Cofactor(s) Released From
the Flavoprotein Solution
1. A 5–10 µM solution of enzyme is prepared by gel filtration through a Sephadex
G25 (Pharmacia) column equilibrated with either 10 mM HEPES/NaOH buffer,
pH 7.5 or 10 mM Tris/HCl buffer, pH 7.5.
2. The absorbance spectrum is recorded, and the protein and activity content of the
sample is measured.
3. The emission spectrum of 2 mL buffer is measured in a 3 mL glass cuvet to be
used as a blank in subsequent measurements.
4. A 100 µL aliquot of the enzyme solution is added to the fluorimeter cuvet.
5. After mixing, the emission spectrum of the solution is recorded.
6. The sample is recovered with a Pasteur pipet, transferred to microfuge tubes,
wrapped in aluminum foil, and incubated for 10 min at 100°C.
Identifying and Quantitating FAD and FMN 13
7. After being cooled on ice, microfuge tubes are centrifuged at 4°C for 10 min at
13,000 rpm (14,500g).
8. The supernatant is recovered and transferred directly into the fluorimeter cuvet.
9. The emission spectrum of this solution is measured as before.
10. 2 µL (6 mU) of the PDE solution are added.
11. The emission spectrum of the solution is recorded at different times after mixing,
until no further changes are observed.
12. Both the emission and excitation shutter of the instrument are closed between
measurements to avoid photodegradation of the flavin sample. Within 5 min the
maximum increase of emission at 524 nm is obtained. After 20–30 min, emission
tends to decrease (see Note 2).
13. Depending on the results obtained, measurements are repeated using (a) a differ-
ent sample dilution (e.g., 5- or 50-fold dilution), (b) a different incubation time at
100°C (5, 15, or 20 min), and (c) a different sample denaturation method (see
Subheading 3.1.3.). If limited by the amount of sample available, 200 µL cuvets
may be used.
3.1.3. Alternative Protein Denaturation Methods
1. The protein stock solution (5–10 µM) can be denatured by incubation at 100°C
for 10 min in the dark, and denatured protein can be removed by centrifugation at
13,000 rpm (14,500g) for 10 min in a microfuge in the cold. The supernatant is
transferred to a clean microfuge tube, kept on ice in the dark and aliquots can be
diluted 10–50-fold for fluorimetric analyses as described in 3.1.2.
2. The protein stock solution (5–10 µM) can be denatured by incubation at room tempera-
ture in the presence of 0.2% SDS (see Subheading 3.2.1.). Aliquots of such sample can
be diluted 10–20-fold for fluorescence analyses described above. Although 0.2% SDS
does not allow PDE-catalyzed conversion of FAD into FMN (see Table 1), we observed
that experiments carried out in the presence of 0.02% SDS gave results essentially
indistinguishable from those obtained in the absence of SDS.
3.1.4. Fluorimetric Data Analysis
As already reported, if the protein contains only FMN, no fluorescence
change is observed upon PDE treatment. Conversely, if the protein contains
only FAD a 10-fold fluorescence increase is expected. For proteins containing
both flavin cofactors, the molar ratio (r) between FAD and FMN can be calcu-
lated from the fluorescence increase after PDE treatment using Eq. 4, which is
based on Eqs. 1–3.
F
o
= f
FAD
· [FAD] + f
FMN
[FMN] (1)
F
fin
= f
FMN
([FMN] + [FAD]) (2)
f
FAD
= 0.1f
FMN
(3)
r = (10 × (F
fin
/F
o
)– 10) / (10 – (F
fin
/F
o
)) (4)
14 Aliverti, Curti, and Vanoni
Table 1
Fluorimetric Identification of FAD and FMN in GltS Holoenzyme and in Its Isolated Subunits
Concentra- Denaturation
Sample tion
a
(µM) Buffer Pretreatment method F
o
F
fin
F
fin
/F
o
Notes
FAD 0.60 A + 0.1 mM None None 20.63 206.3 10 Chromatographically
MgSO
4
purified FAD
FAD 0.26 A + 0.1 mM None None 39.06 202 5.17 Commercial FAD
MgSO
4
GltS β
b
0.781 B + 0.1 mM Gel filtration 10 min, 100°C 56.6 611.8 10.81
MgSO
4
GltS β
b
0.443 A + 0.1 mM Gel filtration 10 min, 100°C 37.6 399.1 10.6
MgSO
4
GltS β
b
0.762 A Gel filtration 0.2% SDS to 80.3 777.8 9.72 SDS concentration in
7.62 µM β fluorimeter cuvet was
subunit stock 0.024%
solution
GltS β
b
0.381 A Gel filtration 0.2% SDS to 40.22 374.4 9.3 SDS concentration in
7.62 µM β fluorimeter cuvet was
subunit stock 0.012%
solution
GltS β
b
0.381 A + 0.1 mM Gel filtration 0.2% SDS to 40.84 410.5 10.5 SDS concentration in
MgSO
4
7.62 µM β fluorimeter cuvet was
subunit stock 0.012%
solution
G298A-GltSβ
c
9.56 A Gel filtration 0.2% SDS 32.7 69.94 — PDE activity inhibited
by 0.2% SDS
14
Identifying and Quantitating FAD and FMN 15
G298A-GltSβ
b
0.212 A + 0.1 mM Gel filtration 10 min, 100°C 21.35 169 7.916 The enzyme was not
MgSO
4
shielded from light
during heat denaturation
G298A-GltSβ
c
0.429 A + 0.1 mM Gel filtration 10 min, 100°C 32.26 316 9.79 The sample was
MgSO
4
shielded from light
during heat denaturation
GltS α
c
0.46 A Gel filtration 10 min, 100°C 93.3
d
91.5
d
0.98
rGltS
c,e
4.81 C None 10 min, 100°C 356.3 645.2 1.81
rGltS
c,e
0.534 C None 10 min, 100°C 39.65 82.47 2.07 same sample as
above, diluted 9-fold
a
Protein concentration was determined by the method of Bradford (15).
b
In 3 mL cuvet containing 2220 µL sample.
c
In 200 µL cuvet with 200 µL sample volume.
d
Excitation light was at 440 nm.
e
In 25 mM Hepes/KOH, pH 7.5, 1 m
M EDTA, 1 mM DTT, 1 mM 2-oxoglutarate, 10% glycerol,
Buffers were A, 10 mM Tris/HCl, pH 7.5; B, 10 mM HEPES/NaOH, pH 7.5; C, 10 mM HEPES/KOH, pH 7.5.
15
16 Aliverti, Curti, and Vanoni
where F
o
= fluorescence of the released flavin solution; F
fin
= fluorescence
after reaction with PDE; f
FAD
= fluorescence of a 1 µM solution of FAD; and
f
FMN
= fluorescence of a 1 µM solution of FMN. Fluorescence refers to the
intensity of light emitted at 524 nm on excitation with 450 nm light.
In the case of the GltS β subunit or of its G298A mutant, from the changes
of emission intensity of the solutions (Table 1) it can be concluded that the
enzyme contains FAD as the flavin cofactor. The results are not influenced by
the presence of 0.1 mM MgSO
4
, which was called for in the original method
(16), nor by the incubation time at 100°C. Instead, we found it important to
protect the sample from light throughout the treatment. As shown in Table 1,
no fluorescence changes were obtained on incubation of the flavin cofactor
released from a sample of GltS α subunit indicating that the protein con-
tains FMN as the flavin cofactor beside a 3Fe/4S cluster (10). Fluorescence
changes on addition of PDE to the flavins released from GltS holoenzyme
are more complex. The increase of fluorescence is about twofold, consis-
tent with the presence of approximately equimolar amounts of FAD and
FMN in the GltS holoenzyme (Table 1). A more precise estimate of the
flavin stoichiometry is obtained by HPLC analysis of the released flavins
(see Subheading 3.3.).
The method can be used to calculate the FAD and/or FMN concentration of the
solution under analysis provided the intensity of emission at 524 nm as a function
of FAD or FMN concentration has been determined experimentally. Under our
conditions, using GltS, the emission intensity of solutions containing between 1
and 8 µM FMN was measured in the 200 µL cuvet, so that it was determined that a
1 µM FMN solution yields a fluorescence intensity of 76.4. Assuming that the GltS
protomer contains one FAD and one FMN, from the fluorescence after the PDE
treatment, an enzyme concentration of 4.8 µM could be calculated in agreement
with the determination made from protein assays (4.8 µM).
3.2. Spectrophotometric Determination of the Flavin Content,
Identification of the Flavin Cofactor as FAD or FMN,
and Calculation of Extinction Coefficients
3.2.1. SDS Treatment of Simple Flavoproteins
1. The absorbance spectrum of the protein solution (5–10 µM, 1 mL) in 10 mM
HEPES/NaOH buffer, pH 7.5, or 10 mM Tris-HCl buffer, pH 7.5–8, is recorded.
2. A 20 µL aliquot of a fresh 10% SDS solution is added (see Note 3).
3. After mixing, spectra are recorded until no further changes are observed. Typi-
cally, within 5–10 min conversion of the spectrum of the bound flavin into that of
free FAD or FMN is observed.
4. Direct comparison of equimolar solutions of FAD and FMN reveals that at
473 nm the solutions exhibit a similar extinction coefficient (9200 M
–1
cm
–1
).
Identifying and Quantitating FAD and FMN 17
Thus, the following conclusions can be drawn from the comparison of the spec-
trum of the native protein with that obtained after SDS addition:
a. From the position of the absorbance maximum at 450 vs 446 nm, or of the absence
of a well-defined peak between 446–450 nm the presence of FAD, FMN or of a
mixture of the two in the released flavin solution can be inferred.
b. Once the type of flavin present is identified, its concentration can be precisely
estimated using ε
450
= 11,300 M
–1
cm
–1
for FAD and ε
446
= 12,200 M
–1
cm
–1
for
FMN. In case of doubt, or of other information, or if a mixture of FAD and FMN
may be present, the total (FAD + FMN) concentration can be calculated from the
absorbance at 473 nm, using 9200 M
–1
cm
–1
as the extinction coefficient.
c. Once the concentration of the flavin is known, both the flavin/protein molar ratio
and the extinction coefficient of the bound flavin can be calculated.
3.2.2. Heat Denaturation of Simple and Complex Flavoproteins
SDS-treatment sometimes fails to denature proteins, in particular those con-
taining iron-sulfur centers as in our case (i.e., GltS, the GltS α subunit, the
chimeric Fd/FNR fusion protein). An effective method to destroy the protein’s
iron-sulfur clusters, while preserving the flavin cofactors, is heat treatment in
the dark.
1. The spectrum of the protein solution (5–10 µM, 1 mL) is recorded.
2. The sample is transferred to a microfuge tube, and incubated in a boiling water
bath for 10 min.
3. After cooling, the denatured protein is removed by centrifugation (10 min at
13,000 rpm (14,500g) in the cold in a microfuge).
4. The supernatant is recovered, and the absorbance spectrum is recorded (see Note 4).
5. If centrifugation is not sufficient to remove denatured protein the supernatant can
be either filtered through 0.2 µm filters, or using centrifugal filters.
6. Again the identification of the flavin can be attempted from the position of the
absorbance maximum (450 nm for FAD as opposed to 446 nm for FMN).
7. Flavin quantitation can be carried out as described above (see Subheading
3.2.1.), allowing determination of stoichiometry and extinction coefficient of the
bound flavin.
3.2.3. Spectrophotometric Identification of FAD and FMN by PDE
Treatment Following Heat Denaturation
The differences of the absorbance spectra of FAD and FMN can be exploited
to carry out the identification of FAD and FMN using the PDE treatment,
directly in the spectrophotometer cuvet.
1. The spectrum of a sample containing 5–10 µM flavin (1 mL) is recorded.
2. A 2 µL aliquot of PDE is then added, and spectra are recorded at different times
after PDE addition.
18 Aliverti, Curti, and Vanoni
3. Using a FAD-containing solution, absorbance changes consistent with conver-
sion of FAD into FMN (+ AMP) are observed with an isosbestic point at 473 nm,
and they are complete within 10 min. As expected, no changes are observed when
a FMN-containing solution is treated with PDE.
3.2.4. Quantitation of Total Flavin Content in Iron-Sulfur Flavoproteins
Determination of the non-heme iron content of iron-sulfur containing pro-
teins is often affected by the precision of the protein concentration determina-
tion. In order to avoid this problem with GltS, a method was designed (17) that
allowed us to measure non-heme iron concentration and total flavin concentra-
tion on the same sample derived from heat denaturation, under acidic condi-
tions, of GltS or GltS α subunit solutions.
1. 0.8 mL Samples of GltS or GltS α subunit (5–10 µM) that have been gel filtered in 10
mM HEPES/KOH buffer, pH 7.5 or 10 mM Tris/HCl buffer, pH 7.5–8, are prepared.
2. The absorbance spectrum of the solution is recorded, and the solution is trans-
ferred into a microfuge tube. One-tenth microliter of 100% trichloroacetic acid
(TCA) and 0.1 mL 75 mM ascorbic acid are added.
3. After being mixed, the sample is incubated in a boiling water bath for 5–10 min.
4. The combination of acid and heat treatment results in hydrolysis of FAD present
into FMN.
5. Inclusion of ascorbic acid helps in maintaining Fe in the +2 form required for
iron concentration determination.
6. After being cooled, denatured protein is removed by centrifugation for 10 min at
13,000 rpm (14,500g) in a microfuge in the cold.
7. The absorbance spectrum of the supernatant is measured, and the total flavin
concentration is determined using 11.1 mM
–1
cm
–1
as the extinction coefficient of
FMN at 446 nm, under acidic conditions (8).
8. The total flavin concentration can be used as an estimate of the GltS concentra-
tion, assuming that 1 FAD and 1 FMN are present per enzyme protomer, or that 1
FMN is present per GltS α subunit.
9. Enzyme concentration determined through protein assays and through the total
flavin content never differed by more than 20% (Table 2). The supernatant from
the heat denaturation step under acidic conditions can be directly used for the
determination of the iron content of the preparation (17).
3.3. HPLC Identification and Quantification of FAD and FMN
Several methods for the separation of flavins by reverse phase chromatogra-
phy have been published. We propose a modification of the method of Light et
al. (18,19) which uses 5 mM ammonium acetate, pH 6.5, and methanol as the
solvent system. Thus, it allows both to separate FAD and FMN on an analyti-
cal scale, and to obtain homogeneous preparations of FAD or FMN from com-
mercially available compounds. When used on a preparative scale, the solvent
Identifying and Quantitating FAD and FMN 19
Table 2
Spectrophotometric Quantitation of FAD and FMN Extracted from Several Flavin-Containing Enzymes
Concentra- Native λmax, Denatured Flavin concen- Stoichi- ε
Enzyme tion
a
(µM) Pretreatment Buffer Denaturation A@λmax λmax, A@λmax tration (µM) ometry (M
–
1
cm
–1
)
GltS β subunit 16.56 Gel filtration C 0.2% SDS 454, 0.157 450, 0.152 (FAD), 13.4 0.81 11,698
GltS β subunit 8.85 Gel filtration B 0.2% SDS 454, 0.083 450, 0.085 (FAD), 7.5 0.85 11,080
G273A GltS β 8.8 None A 10 min, 100°C 452, 0.099 450, 0.086 (FAD), 7.6 0.86 12,955
subunit
G273A GltS β 4.3 Gel filtration B 0.2% SDS 452, 0.049 450, 0.048 (FAD), 4.3 0.99 11,448
subunit
GltS α subunit 2.3 Gel filtration B 10 min, 100°C 440, 0.046 446, 0.029 (FMN), 2.4 1.04 19,200
rGltS 4.8 Gel filtration D 10 min, 100°C 444, 0.300 448, 0.115 (FAD + FMN)
473, 0.09
c
9.8
c
2.04 61,200
rGltS 3.35 Gel filtration B 10 min, 100°C
b
444, 0.210 446, 0.07
d
6.2
d
1.85 67,742
a
Enzyme concentration was determined by the Bradford method (15).
b
In the presence of 10% TCA, 7.5 mM ascorbic acid, and light.
c
The extinction coefficient at the isosbestic point for FAD and FMN (9200 M
–1
cm
–1
) was used.
d
The extinction coefficient of FMN under acidic conditions is used (11,100 M
–1
cm
–1
, 8
).
A, 25 mM HEPES/KOH, pH 7.5, 10% glycerol, 1 mM EDTA; B, 10 mM Tris/HCl, pH 7.5; C, 10 mM HEPES/NaOH, pH 7.5; D, 10 mM HEPES/KOH,
pH 7.5.
20 Aliverti, Curti, and Vanoni
can be easily removed by lyophilyzation. The eluate can be monitored continu-
ously by absorbance or fluorescence, depending on the online detection system avail-
able. We routinely monitor the absorbance of the eluate at 264 nm, where the
absorbance of FAD and FMN solutions are maximal. Greater sensitivity could be
obtained by measuring the eluate absorbance at shorter wavelengths, but quantitation
may be affected by baseline absorbance changes due to varying eluent composition.
1. A 2 mL sample loop is mounted on the UK-6 injector and varying sample vol-
umes (50–250 µL) are injected onto the column using microsyringes.
2. The column is equilibrated at a flow rate of 1 mL/min for 30 min with 85%
solvent A (5 mM ammonium acetate buffer, pH 6.5) and 15% methanol.
3. After sample injection the column is washed with 85% solvent A and 15% metha-
nol for 5 min.
4. The concentration of methanol is increased linearly from 15–75% in 20 min and
from 75–100% in 5 min.
5. Methanol concentration is kept constant at 100% for 10 min and lowered to 15% in 5 min.
3.3.1. Construction of the Calibration Curve
1. A calibration curve is constructed by injecting 50 µL aliquots of solutions con-
taining known amounts of FAD and FMN (40–800 pmol each).
2. Under these conditions, FAD elutes as a sharp peak at 9.5 min, and FMN as a
broader peak at 18 min.
3. Integration of the areas corresponding to the peaks obtained by injecting known
amounts of FAD and FMN allows the construction of standard curves.
4. Under these conditions, peak position and quantitation is independent from
sample volume (50–250 µL of a 1 µM solution of FAD and FMN). Moreover,
incubation of FAD and FMN solutions at 100°C for up to 20 min does not lead to
any detectable change of the chromatogram, provided the samples are kept in the
dark. Furthermore, freezing of such solutions for up to one week also does not
lead to any detectable change. On the contrary, exposure of FAD and FMN solu-
tions to light, to acidic conditions (10% TCA) or to both acidic conditions (10%
TCA) and heat (10 min at 100°C) leads to conversion of FAD into FMN, and
(presumably) AMP, which is not retained by the column.
3.3.2. Sample Preparation and Analysis of the Released Cofactors
1. Flavoprotein samples are diluted to a final concentration of 5–20 µM.
2. Protein solutions are transferred to microfuge tubes and incubated at 100°C for 10 min.
3. The denatured protein is removed by centrifugation, and the supernatant is filtered.
4. The absorbance spectrum of each solution is measured, and 50, 100, and 150 µL
aliquots are injected onto the HPLC.
5. To test the method, samples of GltS holoenzyme, GltS α subunit, spinach leaf
FNR, maize root FNR, and the chimeric Fd/FNR protein are analyzed. As shown
in Table 3, the chromatographic analysis reproducibly yields results consistent
Table 3
Identifying and Quantitating FAD and FMN 21
21
Table 3
HPLC Quantification of the Flavin Content of Several Flavoproteins
Concentration
a
Denaturation Enzyme FAD FMN FAD/ FMN/
Experiment Enzyme (µM) Buffer
b
method (pmol) (pmol) (pmol) subunit subunit
1rGltS 5.8 A 100°C, 10 min 290 247 248 0.85 0.85
580 471 507 0.81 0.87
2 GltS α 5.3 B 100°C, 10 min 265 None 275 — 1.04
530 None 520 — 0.98
3 Leaf-FNR 5.50 C 100°C, 10 min 275 262 None 0.95 —
550 527 None 0.96 —
4 Root-FNR 4.86 C 100°C, 10 min 243 230 None 0.95 —
486 469 None 0.97 —
5 Fd/FNR 5.52 C 100°C, 10 min 276 289 None 1.05 —
552 588 None 1.07 —
a
Concentration determined with the Bradford method (15).
b
Buffers used were: A, 25 mM Hepes/KOH, pH 7.5, 10% glycerol, 1 mM EDTA, 1 mM 2-oxoglutarate, 1 mM DTT; B, 25 mM
Pipes/KOH, pH 7.5, 10% glycerol, 1 mM EDTA, 0.1 mM DTT; C, 50 mM Tris-HCl, pH 7.4.
22 Aliverti, Curti, and Vanoni
with the known flavin content of the enzymes, as determined previously and by
using the alternative methods presented above (see Subheadings 3.1. and 3.2.).
4. Notes
1. When 200 µL cuvets are used, care must be taken to transfer the samples with
automatic pipets, and to start from at least 250 µL samples. Mixing must also be
carried out with automatic pipets. We discourage the use of microsyringes when
the sample contains PDE, as the enzyme is difficult to wash away and may con-
taminate samples that will be handled later on.
2. We recommend soaking cuvets that have come in contact with PDE in a solution
containing 3 M HCl in ethanol and extensively rinsing with MilliQ water
(Millipore) for cleaning and effective removal of PDE traces.
3. In these experiments, it should be kept in mind that due to the limited solubility of
potassium dodecyl sulfate, the protein should be transferred into a potassium-free buffer.
4. Comparison of the spectrum of the flavin released by the SDS treatment and that
released by heat denaturation sometimes yields different results: up to 20% fla-
vin loss during heat denaturation has been observed, presumably due to trapping
of some of the flavin in the protein pellet. Thus, it is recommended that the
experiment is repeated using protein solutions of different concentrations.
Acknowledgments
The work carried out in the authors’ laboratory is funded by grants from the
Ministero per l’Università e la Ricerca Scientifica and Consiglio Nazionale
delle Ricerche (Target Project on Biotechnology). We are grateful to Dr. L.
Piubelli for providing FNR samples. The contribution of Drs. F. Fischer, P.
Morandi, S. Ravasio, H. Stabile, and B. Valzasina, who provided samples of
GltS holoenzyme and of its two subunits and tested the methods described
above, is gratefully acknowledged.
References
1. Hill, S., Austin, S., Eydmann, T., Jones, T., and Dixon, R. (1996) Azotobacter
vinelandii NifL is a flavoprotein that modulates transcriptional activation of nitro-
gen-fixation genes via a redox sensitive switch. Proc. Natl. Acad. Sci. (USA) 93,
2143–2148.
2. Palfey, B. A. and Massey, V. (1998) Flavin Dependent Enzymes, in Comprehen-
sive Biological Catalysis (Sinnott, M. L., ed.) vol. III, Academic Press, New York,
pp. 83–154.
3. McCormick, D. B. and Wright L. D., eds. (1971) Methods in Enzymology vol. 18,
Part B, Academic, London and New York, pp. 217–425.
4. Fleischer, S. and Packer, L., eds. (1978) Methods in Enzymology vol. 53, Aca-
demic, New York, pp. 397–570.
5. McCormick, D. B. and Wright L. D., eds. (1980) Methods in Enzymology vol. 66,
Part E, Academic, London and New York, pp. 253–598.
Identifying and Quantitating FAD and FMN 23
6. Chytil, F. and McCormick, D. B., eds. (1986) Methods in Enzymology vol. 122,
Academic, London and New York, pp. 185–248.
7. Koziol, J. (1971) Fluorometric analyses of riboflavin and its coenzymes, in Meth-
ods in Enzymology, (McCormick, D. B. and Wright, L. D., eds.), vol. 18, Part B,
Academic, London and New York, pp. 253–285.
8. Hinkson, J. W. (1968) Azotobacter free-radical flavoprotein. Preparation and
properties of the apoprotein. Biochemistry 7, 2666–2672.
9. Vanoni, M. A., Verzotti, E., Zanetti, G., and Curti, B. (1996) Glutamate synthase:
properties of the recombinant β subunit. Eur. J. Biochem. 236, 937–946.
10. Vanoni, M. A., Fischer, F., Ravasio, S., Verzotti, E., Edmondson, D. E., Hagen,
W. R., Zanetti, G., and Curti, B. (1998) The recombinant α subunit of glutamate
synthase: spectroscopic and catalytic properties. Biochemistry 37, 1828–1838.
11. Ratti, S., Curti, B., Zanetti, G., and Galli, E. (1985) Purification and characterization
of glutamate synthase from Azospirillum brasilense. J. Bacteriol. 163, 724–729.
12. Aliverti, A., Bruns, C. M., Pandini, V. E., Karplus, P. A., Vanoni, M. A., Curti,
B., and Zanetti, G. (1995) Involvement of Serine 96 in the catalytic mechanism of
ferredoxin-NADP
+
reductase: structure-function relationship as studied by site-
directed mutagenesis and X-ray crystallography. Biochemistry 34, 8371–8379.
13. Ritchie, S. W., Redinbaugh, M. G., Shiraishi, N., Vrba, J. M., and Campbell, W.
H. (1994) Identification of a maize root transcript expressed in the primary
response to nitrate: characterization of a cDNA with homology to ferredoxin-
NADP
+
oxidoreductase. Plant. Mol. Biol. 26, 679–690.
14. Aliverti, A. and Zanetti, G. (1997) A three-domain iron-sulfur flavoprotein
obtained through gene fusion of ferredoxin and ferredoxin-NADP
+
reductase from
spinach leaves. Biochemistry 36, 14,771–14,777.
15. Bradford, M. M. (1976) A rapid and sensitive method for the quantitation of
microgram quantitites of protein utilizing the principle of protein-dye binding.
Anal. Biochem. 72, 248–254.
16. Forti, G. and Sturani E. (1968) On the structure and function of reduced nicotina-
mide adenine dinucleotide phosphate-cytochrome f of reductase of spinach chlo-
roplasts. Eur. J. Biochem. 3, 461–472.
17. Vanoni, M. A., Edmondson, D. E., Zanetti, G., and Curti, B. (1992) Characteriza-
tion of the flavins and the iron-sulfur centers of glutamate synthase from
Azospirillum brasilense by absorption, circular dichroism, and electron paramag-
netic resonance spectroscopies. Biochemistry 31, 4613–4623.
18. Light, D. R., Walsh, C., and Marletta M. A. (1980) Analytical and preparative
high-performance liquid chromatography separation of flavin and flavin analog
coenzymes. Anal. Biochem. 109, 87–93.
19. Hausinger, R. P., Honek, J. F., and Walsh, C. (1986) Separation of flavins and
flavin analogs by high-performance liquid chromatography, in Methods in Enzy-
mology (Chytil, F. and McCormick, D. B., eds.), vol. 122, Academic, New York,
pp. 199–209.