cell cycle checkpoint control protocols
Bạn đang xem bản rút gọn của tài liệu. Xem và tải ngay bản đầy đủ của tài liệu tại đây (5.3 MB, 345 trang )
Methods in Molecular Biology
TM
Methods in Molecular Biology
TM
Edited by
Howard B. Lieberman
Cell Cycle
Checkpoint
Control
Protocols
VOLUME 241
Edited by
Howard B. Lieberman
Cell Cycle
Checkpoint
Control
Protocols
Methods to Induce Cell Cycle Checkpoints 3
3
From:
Methods in Molecular Biology, vol. 241: Cell Cycle Checkpoint Control Protocols
Edited by: H. B. Lieberman © Humana Press Inc., Totowa, NJ
1
Methods to Induce Cell Cycle Checkpoints
Howard B. Lieberman and Kevin M. Hopkins
1. Introduction
The way cells respond to radiation or chemical exposure that damages
deoxyribonucleic acid (DNA) is important because induced lesions left
unrepaired, or those that are misrepaired, can lead to mutation, cancer, or
lethality. Prokaryotic and eukaryotic cells have evolved mechanisms that repair
damaged DNA directly, such as nucleotide excision repair, base excision repair,
homology-based recombinational repair, or nonhomologous end joining, which
promote survival and reduce potential deleterious effects (1). However, at least
eukaryotic cells also have cell cycle checkpoints capable of sensing DNA dam-
age or blocks in DNA replication, signaling the cell cycle machinery, and
causing transient delays in progression at specific phases of the cell cycle
(2; see ref. 3 for a review). A related but more primitive system may exist in
prokaryotes (4–7). These delays are thought to provide cells with extra time for
mending DNA lesions before entry into critical phases of the cell cycle, such
as S or M, events that could be lethal with damaged DNA.
The precise mechanisms by which checkpoints function are under intensive
investigation, and details of the molecular events involved are being pursued
vigorously. This is owing not only to the complexity and the intellectually and
technically challenging aspects of the process (see ref. 3 for a review) but also
to the relevance of these pathways to the stabilization of the genome and car-
cinogenesis (8). Nevertheless, it is clear that checkpoint mechanisms are very
sensitive and can be induced by the presence of relatively small amounts of
DNA damage. For example, in the yeast Saccharomyces cerevisiae, as little as
a single double-strand break in DNA can cause a delay in cell cycle progres-
sion (9,10). One important aspect of studying cell cycle checkpoint mecha-
nisms is an understanding of how to induce the process.
4 Lieberman and Hopkins
This chapter focuses on the application of radiations, such as gamma rays and
ultraviolet (UV) light, that are capable of causing DNA damage, and thus leading
to the induction of cell cycle checkpoints. Certain chemicals, or the use of tem-
perature-sensitive mutants to disrupt DNA replication, are also used routinely to
induce checkpoints, but related protocols are not described in this chapter.
Gamma rays cause primarily single- and double-strand breaks in DNA but can
infrequently induce nitrogenous base damage as well. In contrast, UV light
(i.e., 254 nm) causes a preponderance of bulky lesions, such as pyrimidine
dimers, although single-base damage and strand breaks are a smaller part of the
array of lesions that can be produced. Regulation of cell cycle checkpoints
induced by ionizing radiation versus UV light is mediated by overlapping but not
identical genetic elements (11–13). Although the protocols described in this
chapter concern the treatment of mammalian cells, the same general principles
can apply to irradiation of yeast and other types of nonmammalian cells as well.
2. Materials
2.1. Supplies
1. Cells: Any mammalian cell type is appropriate for exposure to gamma rays, but
those that can grow attached to a Petri dish surface (glass slide or any other open
surface) as a monolayer, such as fibroblasts, are ideal for UV-related experi-
ments because this nonionizing radiation does not efficiently penetrate medium
or reach one cell “shielded” by another.
2. Growth medium: standard mammalian medium appropriate for the cells of inter-
est (i.e., Dulbecco’s modified Eagle’s medium [DMEM], Roswell Park Memo-
rial Institute-1640 [RPMI-1640], McCoy’s, etc.), available commercially from
several companies: Atlanta Biologicals (Norcross, GA), Invitrogen (Carlsbad,
CA), Mediatech (Herndon, VA), Sigma-Aldrich (St. Louis, MO), Specialty
Media (Phillipsburg, NJ).
3. Sterile phosphate buffered saline (PBS) made up as 0.144 g/L KH
2
PO
4
, 9 gm/L
NaCl, 0.795 g/L Na
2
HPO
4
·7H
2
O in distilled H
2
O, pH adjusted to 7.0 and auto-
claved, or purchased commercially from Atlanta Biologicals (Norcross, GA)
Invitrogen (Carlsbad, CA), Mediatech (Herndon, VA), Sigma-Aldrich (St. Louis,
MO), Specialty Media (Phillipsburg, NJ).
4. Petri dishes or flasks (see Note 1): Any size and shape Petri dish, multiwell dish,
or flask will be fine, and it should be chosen based on the number of cells needed
to irradiate, as well as any particular requirements posttreatment. A large selec-
tion of tissue-culture ware is available from numerous commercial suppliers
(e.g., BD Falcon (Bedford, MA), Corning (Corning, NY), Nunc [Naperville, IL]).
2.2. Equipment
2.2.1. Source of Ionizing Radiation
Several different types of equipment are used, and various manufacturers
provide the needed sources. The following are some examples:
Methods to Induce Cell Cycle Checkpoints 5
1. X-rays: Siemens Stabilipan (Siemens, Iselin, NJ)
2. Gamma rays: Based on the decay of
60
Co, such as a Gammacell 220 (Nordion,
Alberta, Canada) for a high dose rate, or based on the decay of
137
Cs, such as a
Gammacell 40 (Nordion, Alberta, Canada) for a lower dose rate (see Notes 2 and 3).
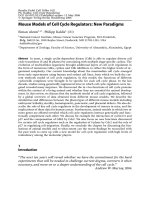
3. Source of UV light: Usually a germicidal bulb is used to produce 254 nm UV
light as an inducer of cell cycle checkpoints (see Fig. 1 and Note 4 for details).
4. Voltage stabilizer: Constant Voltage Transformer, Catalog number 30806 (Sola
Electric, Chicago, IL; see Note 5).
5. UV meter and probe (Model UVX Digital Radiometer, Probe Model UVX-25,
UVP Inc., Upland, CA; see Note 6).
3. Methods
3.1. Preparation of Cells
1. All procedures involving cell culturing should follow standard sterile techniques
and optimum conditions for growth of the specific cells of interest.
2. For cell cycle studies, our laboratory has routinely employed mouse embryonic
stem cells, so their use will serve as an example. Other mammalian cells can
easily be adapted, with modifications, to essentially the same procedures.
3. Cells are grown in DMEM.
4. Add 0.1 mM nonessential amino acids.
5. Add 1 mM sodium pyruvate.
6. Add 10
–4
M β-mercaptoethanol.
7. Add 2 mM L-glutamine.
8. Add 15% fetal bovine serum (FBS) ES cell qualified (heat inactivated, 56°C,
30 min).
9. Add 50 µg/mL penicillin.
10. Add 50 µg/mL streptomycin.
11. Add 1000 U/mL Leukemia Inhibitory Factor (LIF).
12. The cells are seeded into 6 well or 10-cm dishes at a concentration of 1 × 10
5
cells
per mL or 1 × 10
6
cells per mL, respectively.
13. Cells should be plated and allowed to attach as well as grow for 1 d prior to
irradiation.
14. At this same time, an equal number of cells and dishes should be prepared to
provide conditioned medium for the experimental cells postirradiation.
15. Control cells should be prepared separately from the cells that will be irradiated
if multiwell dishes are being used.
16. Cells are grown in a 37°C incubator with a 5% CO
2
humidified atmosphere.
17. At the time of irradiation, cells should be actively growing and in log phase.
18. Cells should not be confluent at the time of irradiation, unless studies on a quies-
cent population are specifically planned.
19. In addition, for UV-light-related experiments, cells should be plated at least
0.25 in. from the perimeter of the Petri dishes because the lip can interfere with
exposure of cells in the vicinity.
6 Lieberman and Hopkins
3.2. Exposure to Ionizing Radiation
1. To expose cells to gamma rays, dishes or flasks are transferred from the 37°C
incubator to the irradiator.
2. The instructions that accompany each machine should then be followed to ensure
accurate and safe operation (see Note 7).
3. When the irradiation is completed, the dishes are removed from the chamber and
transferred back to the 37°C incubator for further incubation (see Note 8).
3.3. Exposure to UV Light (254 nm)
1. The UV light apparatus must be turned on for at least 10 min prior to the irradia-
tion of cells. This will ensure that the UV light is emitted at a stable, constant
dose rate, and the chamber is sterilized.
2. The dose of UV light can be determined by using a radiometer, in conjunction
with the appropriate probe for detecting 254 nm wavelength light. We typically
expose cells at a dose rate of 1.0 J/m
2
(see Note 9).
3. Before exposing cells to UV light, the cell growth medium needs to be removed.
This is achieved by either aspiration or pipetting.
4. The cells are then washed twice with sterile PBS to remove residual medium.
The PBS must be completely removed before exposing the cells to UV light.
5. Place the covered dishes in the UV chamber, making sure that the dishes will be
directly underneath the UV bulb. Remove the lids from the dishes, close the
chamber door, then simultaneously fully pull open the shutter and start timing
the exposure.
6. When the appropriate time has been reached, push the shutter to the completely
closed position. Open the chamber door, replace the lids, then remove the dishes
from the chamber.
7. Immediately add conditioned medium to the irradiated cells equivalent to the
amount of medium present prior to irradiation.
8. The dishes should then be returned to their appropriate incubating apparatus.
9. This wavelength of light is carcinogenic and cataractogenic. Therefore, proper
precautions should be taken to avoid investigator exposure (see Note 10).
10. Furthermore, manipulations during and soon after irradiation should be performed
in very dim light or under yellow lights to ensure exposure occurs without the
neutralizing effects of repair by photoreactivation (if potentially active in the cells
being exposed) or photorepair (1). These repair processes usually need intense light
for proper function, so even a dimly lit room should be appropriate for avoiding
unwanted repair by these activities that could reduce a checkpoint inducing DNA
damage signal. Mammalian cells, in general though, have weak photoreactivation
capability. This coupled with the usual presence of other more active repair mecha-
nisms makes this issue, however, essentially not a significant concern.
11. For mammalian cells (or yeast and other microorganisms for that matter) that
must be in liquid culture, resuspend in a minimum amount of PBS or sterile water
if cells will remain viable, then irradiate while swirling the liquid to optimize for
even exposure of samples. Circular movement of the dishes to cause swirling can
Methods to Induce Cell Cycle Checkpoints 7
be performed manually or by use of an electric gyrating platform available
commercially (Lab Rotator Model 1304, Lab-Line Instruments, Melrose Park,
IL). If performed manually, remember to follow the precautions outlined in
Note 10.
4. Notes
1. Gamma rays and X-rays are highly energetic and can penetrate as well as
pass through cells, Petri dishes, and flasks. UV light cannot pass through these
objects efficiently. Therefore, for UV irradiation, cells should be plated onto Petri
dishes such that the lids can be removed for proper exposure.
2. Gamma rays and X-rays are both forms of ionizing radiation, with slightly differ-
ent energies. However, they produce essentially comparable biological effects
when applied at the same doses and similar dose rates.
3. Although we use equipment manufactured by Siemens and Nordion, as listed,
comparable devices are available from other commercial sources, such as Shep-
herd Model 280, JL Shepherd & Associates, San Fernando, CA.
4. The main component for production of UV light is a germicidal bulb capable of
emitting 254 nm UV light (Model X-15B, bulb number 34000801, UVP Inc.,
Upland, CA). An apparatus illustrated in Fig. 1 is most convenient for exposing
cells to UV, but other perhaps simpler systems are just as valid.
5. It is important to have a stable, constant voltage delivered to the UV light fixture.
This will ensure a uniform, constant, reproducible dose rate during the exposure
of samples.
6. The dose rate emitted from a germicidal bulb usually remains fairly constant for
many years. However, when a new bulb is first set up, a UV meter should be used
to determine the dose rate, and this parameter should be checked periodically.
Be sure to use a probe for the meter that is capable of measuring 254 nm UV
light, as probes are available for detecting different wavelengths of light.
7. Consult the manufacturer of the equipment, as well as the local Radiation Safety
Department, to ensure that the equipment is monitored, maintained, and used
properly.
8. Dose and dose rate are important parameters to consider when using gamma rays
to induce cell cycle checkpoints. We typically expose mammalian cells to
between 8 and 20 gy (800 to 2000 rads) of gamma rays, although even lower
doses may be sufficient to induce a cell cycle checkpoint or the desired effect.
Even though the high dose range kills 99.99% of the cells, we use this high dose
when long-term viability is not an issue. This dose is fine when using flow
cytometry to study delays in cell cycle progression, within 24 h posttreatment,
because even this high dose range will not immediately kill cells and will allow
them to cycle long enough to be able to express a transient delay. This high dose
is also reasonable if cell extracts will be isolated, and intact reproductive capac-
ity is not a relevant issue. Some published papers have reported the use of doses
as high as 50 or more gy, but usually such levels are not necessary to observe a
cell cycle effect. We typically use a dose rate of approximately 1 gy/min
8 Lieberman and Hopkins
Fig. 1. Source of 254 nm UV light. (A) Photograph of UV light box closed. (B) Same
light box opened with Petri dishes inside. (C) (next page) Diagram of light box depict-
ing dimensions and side view. Germicidal bulb serving as the source of UV is on top
of makeshift shutter system. A voltage stabilizer connecting light fixture to an A/C
socket is also presented. The inside walls are painted black, and black material is used
for the bottom surface as well. This reduces reflection of light.
8
Methods to Induce Cell Cycle Checkpoints 9
(For yeast, we typically use a Gammacell 220 irradiator with a dose rate of
30 gy/min.) Higher dose rates are probably fine, but significantly lower dose
rates should be avoided. The problem involves DNA repair and the elimination
of the potential checkpoint-inducing signal. Low dose rates will allow repair to
occur efficiently, resulting in the rapid removal of damage and, thus, the cell
cycle checkpoint signal. If equipment constraints will only allow the application
of ionizing radiation at low dose rates, cells can be kept on ice during exposure.
However, this is not ideal because such incubation can by itself potentially per-
turb cell cycle kinetics and add an additional experimental variable that should
really be avoided.
9. Dose rate can be altered by changing the distance between the germicidal bulb
and the sample. The dose rate changes as the inverse square of the distance, such
that for example if the distance between the sample and the bulb is halved, then
the dose rate increases fourfold.
10. Do not look directly or indirectly at the light emitted from the bulb. Wear a long-
sleeved shirt or a lab coat. Protective eyewear would also be helpful.
Acknowledgments
The authors are grateful to Mr. Gary Johnson for building the UV light box
and helping prepare Fig. 1. Research related to this chapter is supported by
NIH grants GM52493 and CA89816.
Fig. 1. (continued).
10 Lieberman and Hopkins
References
1. Friedberg, E. C., Walker, G. C., and Siede, W. (1995) DNA Repair and Mutagen-
esis. ASM Press, Washington, DC.
2. Hartwell, L. H. and Weinert, T. A. (1989) Checkpoints: controls that ensure the
order of cell cycle events. Science 246, 629–634.
3. Nyberg, K. A., Michelson, R. J., Putnam, C. W., and Weinert, T. A. (2002) Toward
maintaining the genome: DNA damage and replication checkpoints. Annu. Rev.
Genet. 36, 617–656.
4. Bridges, B. A. (1995) Are there DNA damage checkpoints in E. coli? Bioessays
17, 63–70.
5. Autret, S., Levine, A., Holland, I. B., and Seror, S. J. (1997) Cell cycle check-
points in bacteria. Biochimie 79, 549–554.
6. Opperman, T., Murli, S., Smith, B. T., and Walker, G. C. (1999) A model for a
umuDC-dependent prokaryotic DNA damage checkpoint. Proc. Natl. Acad. Sci.
USA 96, 9218–9223.
7. Sutton, M. D., Smith, B. T., Godoy, V. G., and Walker, G. C. (2000) The SOS
response: recent insights into umuDC-dependent mutagenesis and DNA damage
tolerance. Annu. Rev. Genet. 34, 479–497.
8. Hartwell, L. H., and Kastan, M. B. (1994) Cell cycle control and cancer. Science
266, 1821–1828.
9. Garvik, B., Carson, M., and Hartwell, L. (1995) Single-stranded DNA arising at
telomeres in cdc13 mutants may constitute a specific signal for the RAD9 check-
point. Mol. Cell. Biol. 15, 6128–6138.
10. Toczyski, D. P., Galgoczy, D. J., and Hartwell, L. H. (1997) CDC5 and CKII
control adaptation to the yeast DNA damage checkpoint. Cell 90, 1097–1106.
11. Canman, C. E., Wolff, A. C., Chen, C. Y., Fornace, A. J., Jr, and Kastan, M. B.
(1994) The p53-dependent G1 cell cycle checkpoint pathway and ataxia-telang-
iectasia. Cancer Res. 54, 5054–5058.
12. Meyer, K. M., Hess, S. M., Tlsty, T. D., and Leadon, S. A. (1999) Human mam-
mary epithelial cells exhibit a differential p53-mediated response following expo-
sure to ionizing radiation or UV light. Oncogene 18, 5795–5805.
13. Kim, S. T., Xu, B., and Kastan, M. B. (2002) Involvement of the cohesin protein,
Smc1, in Atm-dependent and independent responses to DNA damage. Genes Dev.
16, 560–570.
Methods for Synchronizing Mammalian Cells 11
11
From:
Methods in Molecular Biology, vol. 241: Cell Cycle Checkpoint Control Protocols
Edited by: H. B. Lieberman © Humana Press Inc., Totowa, NJ
2
Methods for Synchronizing Mammalian Cells
Michael H. Fox
1. Introduction
When studying cell cycle checkpoints, it is often very useful to have
large numbers of cells that are synchronized in various stages of the cell
cycle. A variety of methods have been developed to obtain synchronous (or
partially synchronous) cells, all of which have some drawbacks. Many cell
types that attach to plastic culture dishes round up in mitosis and can then be
dislodged by agitation. This mitotic shake-off method, originally discovered
by Terasima and Tolmach (1), is useful for cells synchronized in metaphase,
which on plating into culture dishes move into G1 phase in a synchronous
manner. A drawback to the mitotic shake-off method is that only a small per-
centage (2–4%) of cells are in mitosis at any given time, so the yield is very
small. Also, cells rapidly become asynchronous as they progress through G1
phase, so the synchronization in S phase and especially G2 phase is not very
good. The first limitation can be overcome by plating multiple T150 flasks with
cells, using roller bottles, or blocking cells in mitosis by inhibitors such as Colcemid
or nocodazole (2). Mitotic cells that are collected can be held on ice for an hour or
so while multiple collections are done to obtain larger numbers of cells.
To obtain more highly synchronous populations of cells in S phase, the mitotic
shake-off procedure can be combined with the use of deoxyribonucleic acid
(DNA) synthesis inhibitors, such as hydroxyurea (HU) or aphidicolin (APH),
to block cells at the G1/S border (but probably past the G1 checkpoint). APH
inhibits DNA polymerase α (3–5), whereas HU inhibits the enzyme ribonucleo-
tide reductase (6), though it may operate by other mechanisms also (7). On release
from the block, cells move in a highly synchronized fashion through S phase
and into G2 phase (8). In terms of number of synchronized cells, this method
has the same limitation as discussed above, because the starting cell population
12 Fox
derives from the mitotic shake-off procedure. In addition, the block of cells
with drugs can cause unbalanced cell growth, so one cannot necessarily con-
clude that all biochemical processes are also synchronized.
Large numbers of synchronous cells can be obtained using centrifugal
elutriation (9). This method requires the use of a special rotor in a large floor
centrifuge and separates cells into the cell cycle based on cell size. Cells may
be obtained in early or late G1 phase, or primarily in S phase. However, the cell
populations are not highly synchronous in S phase but instead have significant
populations of G1- and G2-phase cells included. Nevertheless, it is possible to
synchronize very large numbers of cells using this method, and biochemical
processes are not perturbed.
Another method that results in highly synchronous populations is based on
labeling cells with a viable dye for DNA (Hoechst 33342) (10). Cells stained
with this dye can then be sorted by cell cycle phase. Sorted G1 cells will be
distributed throughout G1, however. Cells in S phase can be sorted into a small
window in S phase and thus will be highly synchronized, but only a small
number of cells can be obtained. G2 phase cells will be contaminated with late
S phase cells. Furthermore, some cell types do not stain well with Hoechst
33342, so sufficiently good DNA histograms cannot be obtained.
The protocols presented in this chapter are based on the mitotic shake-off
procedure optimized to obtain large numbers of cells. Procedures for obtaining
highly synchronized cells in G1 phase, various stages in S phase, and G2 phase
are described, along with DNA histograms demonstrating the quality of results
that can be obtained.
2. Materials
2.1. Cell Culture
1. Attached cell lines, such as Chinese hamster ovary (CHO) or HeLa.
2. Appropriate medium, such as Ham’s F12 or minimum essential medium (MEM).
3. Fetal bovine serum (10–15%).
4. T75 or T150 tissue-culture flasks, or both.
2.2. Stock Solutions and Reagents
1. HU (2 mM in medium).
2. APH (1–3 µg/mL in medium; see Note 1).
3. Trypsin (see Note 2).
2.3. Equipment
1. Variable speed shaker with platform to hold T75 or T150 tissue-culture flasks
(available from Fisher Scientific, VWR, Daigger, ISC Bioexpress, etc.).
2. Flow cytometer for analysis of synchronized cell populations.
Methods for Synchronizing Mammalian Cells 13
3. Floor centrifuge to spin down large volumes of cells and medium or tabletop
centrifuge that can handle 50-mL centrifuge tubes for smaller experiments.
3. Methods
3.1. Mitotic Shake-Off for G1 Synchrony
1. Culture cells in T75 or T150 flasks (see Note 3).
2. Trypsinize and replate 3–5 × 10
6
cells in 25 mL medium in T150 flasks.
3. Grow cells in incubator for 24–48 h to increase cell numbers (see Note 4).
4. Select mitotic cells by placing flasks on shaker tray suitable for holding 96-well
trays and shake for 30 s to 1 min at 150–200 rpm (see Note 5).
5. Collect the medium containing mitotic cells in 500-mL centrifuge bottles and put
on ice.
6. Add 25 mL prewarmed medium to flasks and incubate for 10 min.
7. Select mitotic cells by repeating steps 4–6. This can be done sequentially for
1–2 h to collect sufficient numbers of mitotic cells (see Note 6).
8. After sufficient numbers of cells have been collected and held on ice, pool the
collections and centrifuge them in a floor-model centrifuge to concentrate the
mitotic cells.
9. Plate appropriate numbers of cells (1–5 × 10
5
) into T25 flasks.
10. Add 4 mL prewarmed medium.
11. Incubate flasks in a 37°C incubator for desired time to get cells in early-, mid-, or
late-G1 phase (see Note 7 and Fig. 1).
12. Process parallel samples for cell cycle analysis to monitor cell cycle progression.
Fix cells with 70% ethanol on ice for 20–30 min, stain with propidium iodide for
5–10 min, and analyze by flow cytometry (see Chapter 4 in this book for details
on flow cytometry cell cycle analysis).
3.2. Mitotic Shake-Off Plus HU for S- and G2-Phase Synchrony
1. Follow steps 1–8 in Subheading 3.1.
2. Plate appropriate numbers of cells (1–5 × 10
5
) into T25 flasks containing 4 mL
medium with 2 mM HU.
Fig. 1. Flow cytometry histograms at various times after mitotic selection synchrony
procedure. The vertical lines show locations of the G1 and G2 peaks. The time after
mitotic selection is shown at top of histograms. This figure is reproduced in part
from ref. 8.
14 Fox
3. Incubate for approx 1 cell cycle time (approx 12 h for CHO cells, 24 h for human
cells; see Note 8).
4. Aspirate off medium; rinse once with 4 mL of warm (37°C) medium.
5. Add 4 mL of warm medium and put flasks in incubator.
6. Remove flasks at various times after removing medium to get cells synchronized
at various points in S phase or G2 phase (see Note 9 and Fig. 2A).
7. Process parallel samples for flow cytometry analysis to determine the exact loca-
tion of cells in S phase. To determine the G2 phase, it is best to use BrdU uptake
and dual-parameter flow cytometry analysis as described in Chapter XX.
3.3. Mitotic Shake-Off Plus APH for S and G2 Synchrony
1. Follow steps 1–10 in Subheading 3.1.
2. Add 4 µL APH from 10 mg/mL dimethyl sulfoxide (DMSO) stock to flasks for a
final concentration of 1 µg/mL.
3. Follow steps 3–7 in Subheading 3.2. (see Note 10, and refer to Fig. 2B,C for
examples of synchronized populations obtained by this method).
4. Notes
1. APH is made in a stock solution of 10 mg/mL DMSO because it is not water
soluble. At a final concentration of 3 µg/mL APH, the DMSO concentration is
only 0.03% and should have little effect on cells.
Fig. 2. Flow cytometry histograms obtained after releasing cells from mitotic
selection plus 12 h of drug. (A) 2 mM HU. (B) 3 µg/mL APH. (C) 1 µg/mL APH.
This figure is reproduced from ref. 8.
Methods for Synchronizing Mammalian Cells 15
2. Optimum trypsin concentration can vary for different cell types. We typically
use 0.03% but sometimes use 0.25%. One mM ethylenediaminetetraacetic acid
(EDTA) can also be used.
3. Make sure that cells are in exponential growth, not approaching confluence, so
that the mitotic index will be as high as possible. The limiting concentration of
cells in the flask will depend on cell type. The number of plates needed will
depend on how many cells need to be synchronized.
4. Because about 3–4% of cells are in mitosis at any given time, the number of
synchronized cells needed will govern how many flasks and how many cells are
needed. The time for incubation to increase cell numbers will also depend on the
cycle time for the cells. CHO cells have a cycle time of 12–14 h, whereas human
cells have a cycle time of approx 24 h. The final concentration in a T150 should
not exceed 1 × 10
7
cells to assure a high mitotic index. This will yield about 3–4
× 10
5
mitotic cells in a shake-off.
5. The exact conditions to shake the flasks will depend on the cell type. Typical
conditions would be 1 min at 200 rpm. If shaking is too vigorous, the mitotic
selection window will not be as narrow. In the absence of a mechanical shaker, it
is possible to manually shake the cells off by firmly banging the flasks against
your hand. This will work for a small number of cells but is not practical for a
large synchrony experiment.
6. Discard the first 3–5 shakes to eliminate loosely attached cells that are not in
mitosis. It is a good idea to quickly make a slide of collected cells and get a
mitotic index. This can be done by swelling the cells in water for a minute, spin-
ning them down, resuspending and adding a few drops of ice-cold methanol:acetic
acid (3:1), then dropping the cells onto a microscope slide. The mitotic index
should be above 95% to get highly synchronized cells.
7. It will take about 1 h for cells to attach to the plastic and move into G1 phase.
Different stages of G1 can be studied by waiting different time periods before
analyzing or treating the cells. Cells will become desynchronized as they move
through G1, however, because this is a heterogeneous phase for transit time. Cells
can also be allowed to move into S phase and G2 phase, but the synchronization
is degraded substantially (see Fig. 1A).
8. It is important to hold cells at the G1/S border with HU for approx 1 cell
cycle time because some cells take much longer to traverse G1 than others.
One cell cycle time will be sufficient for >95% of the cells to block at the
G1/S border. HU may become toxic to cells after about 12 h, however (8).
This is not the G1 checkpoint because HU allows cells to initiate DNA
synthesis (7).
9. There will be a slight delay for cells to begin progression into S phase. However,
by 1 h about 98% of cells should be in early S phase in a tight distribution (see
Fig. 2A). It is hard to predict the time when the maximum population will be in
G2 phase. It is possible to quickly fix and analyze a sample of cells by flow
cytometry as they progress through S phase and then predict more accurately
when the maximal concentration will be in G2 phase.
16 Fox
10. APH at 1 µg/mL is not toxic to G1 cells and is not very toxic to S-phase cells (8).
One µg/mL APH does not delay cells in moving through S phase, but 3 µg/mL
causes a slight delay.
References
1. Terasima, T. and Tolmach, L. J. (1963) Growth and nucleic acid synthesis in syn-
chronously dividing populations. Exp. Cell Res. 30, 344–362.
2. Zieve, G. W., Turnbull, D., Mullins, J. M., and McIntosh, J. R. (1980) Production
of large numbers of mitotic mammalian cells by use of the reversible microtubule
inhibitor nocodazole. Exp. Cell Res. 126, 397–405.
3. Bucknall, R. A., Moores, H., Simms, R., and Hesp, B. (1973) Antiviral effects of
aphidicolin, a new antibiotic produced by Cephalosporium aphidicola.
Antimicrob. Agents Chemother. 4, 294–298.
4. Ohashi, M., Taguchi, T., and Ikegami, S. (1978) Aphidicolin: a specific inhibitor
of DNA polymerases in the cytosol of rat liver. Biochem. Biophys. Res. Commun.
82, 1084–1090.
5. Waters, R. (1981) Aphidicolin: an inhibitor of DNA repair in human fibroblasts.
Carcinogenesis 2, 795–797.
6. Krakoff, I. H., Brown, N. C., and Reichard, P. (1968) Inhibition of ribonucleoside
diphosphate reductase by hydroxyurea. Cancer Res. 28, 1559–1565.
7. Wawra, E. and Wintersberger, E. (1983) Does hydroxyurea inhibit DNA replica-
tion in mouse cells by more than one mechanism? Mol. Cell. Biol. 3, 297–304.
8. Fox, M. H., Read, R. A., and Bedford, J. S. (1987) Comparison of synchronized
Chinese hamster ovary cells obtained by mitotic shake-off, hydroxyurea,
aphidicolin, or methotrexate. Cytometry 8, 315–320.
9. Grdina, D. J., Meistrich, M. L., Meyn, R. E., Johnson, T. S., and White, R. A.
(1987) Cell synchrony techniques. In Gray, J. W. and Darzynkiewicz, Z. (eds.)
Techniques in Cell Cycle Analysis. Humana Press, Clifton, NJ, pp. 367–403.
10. Arndt-Jovin, D. J. and Jovin, T. M. (1977) Analysis and sorting of living cells
according to deoxyribonucleic acid content. J. Histochem. Cytochem. 25, 585–589.
Enrichment of Cells in Different Phases 17
17
From:
Methods in Molecular Biology, vol. 241: Cell Cycle Checkpoint Control Protocols
Edited by: H. B. Lieberman © Humana Press Inc., Totowa, NJ
3
Enrichment of Cells in Different Phases
of the Cell Cycle by Centrifugal Elutriation
Tej K. Pandita
1. Introduction
Understanding the molecular and biochemical basis of cellular functions
involved in growth and proliferation requires the investigation of regulatory
events that most often occur in a cell cycle phase-dependent fashion. Studies
involving cell cycle regulatory mechanisms and progression invariably require
cell cycle synchronization of cell populations. Several methods are employed
for obtaining and examining synchronized cells as they pass through one or
more rounds of the cell cycle. Most of these methods involve pharmacological
agents that act at various points throughout the cell cycle. Because of adverse
cellular perturbations resulting from many of the synchronizing drugs used,
other synchrony methods, such as serum deprivation and contact inhibition,
have been exploited. Although such procedures allow synchronization of cells
in a particular phase of the cell cycle, these approaches do not allow enrich-
ment of cells, simultaneously in various phases of the cell cycle, from expo-
nentially growing cell populations. Centrifugal elutriation described for the
first time by Lindahl (1) is used to enrich cells in different phases of the cell
cycle simultaneously with minimum changes in conditions during cell culture.
Centrifugal elutriation can be used to obtain samples of uniformly sized cells,
and because cell size is correlated with cell cycle stage, these cells are synchro-
nized with respect to their position in the cycle.
Centrifugal elutriation has been applied, with variable degrees of success, to
the separation of hemopoietic cells, mouse tumor cells, testicular cells, and a
variety of other specialized cells as well as lymphoblastoid cells in particular
phases of the cell cycle. The capacity of the elutriator to separate large num-
bers of cells is its major advantage. The technique of centrifugal elutriation
18 Pandita
exploits differences in sedimentation velocity of different cell types, to enrich
or isolate various types of cells from a heterogeneous population. In this tech-
nique, cell populations are subjected to two opposing forces to facilitate their
fractionation into subpopulations based on cell size. Therefore, the process is
also known as counterflow centrifugation. This has been used successfully to
separate a wide variety of cell types from suspension and substrate-dependent
cultures and to separate mixed cell populations liberated directly from tissues
or body fluids (2–6). The technology has proved to be effective in fractionating
cells, based on very small differences in cell size, with nominal cross-contami-
nation and in numbers unmatched by other methods of cell separation. In addi-
tion, the methodology of centrifugal elutriation is rapid, and cell separation
can be achieved in less time (0.5–2 h) and with very little physiological stress
to the cells, which are maintained in isotonic media, such as tissue-culture
media, phosphate-buffered saline (PBS), or balanced salt solution (BSS).
2. Materials
2.1. Equipment
1. J6-MC centrifuge equipped with a JE-5.0 rotor and Sanderson chamber (7).
2. Masterflex peristaltic pump, Cole-Palmer Instruments.
3. Electronic Coulter counter.
4. Flow cytometer.
5. 23G needle.
6. Nylon mesh.
2.2. Reagents
1. Growth and elutriation media: minimum essential medium (MEM) with 10% fetal
bovine serum (FBS) for growth and 5% deoxyhypusine synthase (DHS) for elutriation.
2. 0.5 M HEPES.
3. 0.5 M Na
2
ethylenediaminetetraacetic acid (EDTA).
4. Trypsin solution.
5. 70% ethanol.
6. 1X Hank’s balanced salt solution (BSS).
7. 2-naphthol-6,8-disulfonic acid dipotassium salt (NDA) from Eastman Kodak,
Rochester, NY.
8. Deoxyribonuclease (DNase) I type IV (Sigma).
9. Ribonuclease (RNase).
10. Propidium iodide.
11. FACS Vantage™ Flow Cytometry System.
3. Methods
3.1. Preparation of Cells for Loading on Centrifugal Elutriator
1. Culture the cells in appropriate medium at 37°C with 5% CO
2
and 100% humidity.
Enrichment of Cells in Different Phases 19
2. Suspension cells (lymphoblastoids) or adhered cells (fibroblasts) after trypsiniza-
tion are suspended at 1.3–1.5 × 10
8
cells in 50 mL of elutriation buffer (1X Hanks’
BSS containing 3.3% heat-inactivated FBS and 5 mM NDA).
3. Add 4 mL of 0.02% (w/v) of DNase I type IV, dissolved in RPMI-1640 medium.
Place the cells on ice and pass through 23G needle and nylon mesh to remove
clumped cells.
4. Monitor the cell viability by trypan blue exclusion.
5. Concentrate the cells by low-speed centrifugation (3000g for 5 min) at 4°C and
resuspend in 5 mL of ice-cold MEM with 5% DHS for each plate. Alternatively,
0.15 M PBS supplemented with 1% D-glucose, EDTA (0.3 mM) and 0.5% human
serum albumin (HSA) pH 7.2 and osmolarity 285 ± 5 mosM can also be used
throughout the elutriation procedure as the elutriation medium. Maintain the cells
on ice until they are loaded into the elutriator.
3.2. Setting up the Centrifugal Elutriation
1. Arrange the elutriation system and assemble the elutriator rotor, elutriator cham-
ber, and the elutriator centrifuge according to manufacturers’ directions.
Assemble the Sanderson chamber, which is used because it allows work with
small numbers of cells (range: 10,000 to 10 million cells). The elutriator rotor is
assembled in the centrifuge, which is attached to a peristaltic pump and tubing
that feeds fluid into the centrifuge rotor as it is spun.
2. Sterilize the apparatus by running 500 mL of 70% ethanol through the rotor at
about 10 mL/min without turning on the centrifuge at this treatment step.
3. Thoroughly wash the elutriator-loading chamber (rotor) with 2 L of cold
Millipore filtered water by running through the rotor at 40 mL/min. Prevent and
remove all bubbles during the process of washing and loading cells.
4. Pretreat the rotor with 200 mL of Dulbecco’s PBS at 10 mL/min. At this pretreat-
ment step, run the centrifuge at 500g to monitor and correct leaks, bubbles, or
other problems.
3.3. Loading of Cells in the Elutriator Chamber
1. Run the centrifuge at 500g at 4°C. Shift the valve to the open position and load
the cells into a 10-mL syringe connected to the tubing running through the peri-
staltic pump. Load the cells into the running centrifuge at the loading flow
rate of 10 mL/min at 4°C.
2. After the cells are loaded, shift the valve to load 100 mL of PBS at the same flow
rate. Do not allow any bubbles to form or enter the system. This loading step
allows the cells to settle into the Sanderson chamber with largest cells at the
bottom and layers of smaller cells at the top. It usually takes about 5 min to make
the gradient on the basis of cell size and mass. The loading fraction can be col-
lected, as it contains some of the smallest cells.
3. Turn the flow rate up by stepwise increments of the pump speed in order to col-
lect larger cells in the fraction. Start with a flow rate of 12–14 mL/min and col-
lect 50-mL fractions in 50-mL tubes on ice.
20 Pandita
4. Several 50-mL fractions are then collected at each stepwise increment from 14 to
35 mL/min. A fraction is collected as the centrifuge is slowed to a stop, which
helps to push the largest cells out. Cells remaining in the chamber and the tubing
are collected, after the centrifuge is stopped, by removing the rotor and emptying
the fluid that remains in the tubing.
5. Maintain the fractions on ice to prevent cell cycle progression and monitor the
viability by trypan blue exclusion.
3.4. Determination of Purity of Cells in Each Fraction
by Flow Cytometry (
see
Notes 1–4)
1. The cell cycle distribution of the fractionated samples is determined using flow
cytometry to measure deoxyribonucleic acid (DNA) content.
2. Aliquots of each fraction are washed twice in PBS, fixed in 70% ethanol:
30% PBS.
3. Samples are treated with 0.5% RNase for 5 min and stained with propidium iodide.
4. DNA content is determined by quantitative flow cytometry using the FACS Van-
tage Flow Cytometry System. The accuracy of the analyzer is checked with cali-
brated fluorescent beads and chicken erythrocytes.
5. The quality of cell cycle enrichment can also be monitored by premature chro-
mosome condensation (5).
4. Notes
1. Depending on the frequency of cells at different phases of the cell cycle in asyn-
chronously dividing cell populations, enrichment by centrifugal elutriation in dif-
ferent phases of the cell cycle may vary (7). For human lymphoblastoid cell lines,
G1-phase enriched populations contain greater than 98% G1-phase cells. The
S-phase and G2/M-enriched populations are about 88 and 80% pure, respectively (5).
2. Centrifugal elutriation does not influence the physiology or reproductive capa-
bility of the cells. Cells elutriated or not elutriated have similar cell viability and
cell survival after ionizing radiation treatment (6).
3. Centrifugal elutriation allows enrichment of cells in different phases of the cell
cycle within a period of 2 h. Enriched cells in different phases can be simulta-
neously treated and examined for biochemical as well as biological function.
4. Cells enriched in different phases of the cell cycle allowed examination of the
cycle’s age-related radiation sensitivity, DNA repair, and kinase activity of ataxia
telangiectasia mutant (ATM) protein after ionizing radiation treatment through-
out the cell cycle (5,6) and telomere–nuclear matrix interactions (8).
References
1. Lindahl, P. E. (1948) Principle of counterstreaming centrifuge for the separation
of particles of different sizes. Nature 161, 648–649.
2. Brown, E. H. and Schildkraut, C. L. (1979) Perturbation of growth and differen-
tiation of Friend murine erythroleukemia cells by 5-bromodeoxyuridine incorpo-
ration in early S-phase. J. Cell Physiol. 99, 261–277.
Enrichment of Cells in Different Phases 21
3. Conkie, D. (1985) Separation of viable cells by centrifugal elutriation, In: Animal
Cell Culture: A Practical Approach (Freshney, R. I., ed.), IRL Press, Oxford,
England, pp. 113–124.
4. Bludau, M., Kopun, M., and Werner, D. (1986) Cell cycle-dependent expression
of nuclear matrix proteins of Ehrlich ascites cells studied by in vitro translation.
Exp. Cell Res. 165, 269–282.
5. Pandita, T. K., and Hittelman, W. N. (1992) The contribution of DNA and chro-
mosome repair deficiencies to the radiosensitivity of ataxia-telangiectasia. Radiat.
Res. 131, 214–223.
6. Pandita, T. K., Lieberman, H. B., Lim, D. S., et al. (2000) Ionizing radiation acti-
vates the ATM kinase throughout the cell cycle. Oncogene 19, 1386–1391.
7. Beckman Instruments (1990) Centrifugal elutriation of living cells: an annotated
bibliography, In: Applications Data, Number DS-534, Beckman Instruments,
Palo Alto, CA, pp. 1–41.
8. de Lange, T. (1992) Human telomeres are attached to the nuclear matrix. EMBO
J. 11, 717–724.
22 Pandita
Analysis of the Mammalian Cell Cycle 23
23
From:
Methods in Molecular Biology, vol. 241: Cell Cycle Checkpoint Control Protocols
Edited by: H. B. Lieberman © Humana Press Inc., Totowa, NJ
4
Analysis of the Mammalian Cell Cycle
by Flow Cytometry
Haiying Hang and Michael H. Fox
1. Introduction
One of the most common uses of flow cytometry is to analyze the cell cycle
of mammalian cells. Flow cytometry can measure the deoxyribonucleic acid
(DNA) content of individual cells at a rate of several thousand cells per second
and thus conveniently reveals the distribution of cells through the cell cycle.
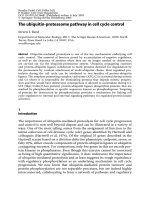
The DNA-content distribution of a typical exponentially growing cell popula-
tion is composed of two peaks (cells in G1/G0 and G2/M phases) and a valley
of cells in S phase (see Fig. 1). G2/M-phase cells have twice the amount of
DNA as G1/G0-phase cells, and S-phase cells contain varying amounts of DNA
between that found in G1 and G2 cells. Most flow-cytometric methods of cell
cycle analysis cannot distinguish between G1 and G0 cells or G2 and M cells,
so they are grouped together as G1/G0 and G2/M. However, there are flow-
cytometric methods that can distinguish four or even all five cell cycle sub-
populations: G0, G1, S, G2, and M (1–3). Furthermore, each subpopulation
can be quantified (4). Obviously, flow cytometry with these unique features is
irreplaceable for monitoring the cell cycle status and its regulation.
Cell cycle checkpoint genes are key elements in cell cycle regulation. Check-
point gene mutation can lead to defects in one or more cell cycle checkpoint
controls, which can then result in cell death or cancer. Many of the cell cycle
checkpoint genes are tumor suppressors, such as p53, ataxia-telangiectasia
mutant (ATM), ataxia-telangiectasia and Rad3 (ATR), and BRCA1 (5,6).
In mammalian cells, the cell cycle checkpoint controls that can be analyzed
by flow cytometry are G1 arrest, suppression of DNA replication, and ATM-
dependent as well as independent G2 arrest. Exposure to a genotoxic agent can
activate some or all of the checkpoints. The flow cytometry methods to analyze
24 Hang and Fox
the status of the different checkpoints are described here. A typical S/M check-
point similar to those in the fission and budding yeasts (7,8) has not been reported
in mammalian cells; thus the protocol to monitor it is not included in this chapter.
2. Materials
2.1. Cells
Examples of cell lines used for demonstrating the four cell cycle check-
points with flow cytometry:
1. Human fibroblasts from an ataxia-telengiectasia (AT) patient (GM05823, Coriel
Institute for Medical Research, Camden, NJ) and normal human fibroblasts (BJ1,
Clontech, Palo Alto, CA) are used for analyzing G1 and ATM-independent G2
checkpoints. GM05823 AT cells are deficient in all three checkpoint controls.
2. Rad9
+/+
and Rad9
-/-
mouse embryonic stem (ES) cells (K. M. Hopkins, W. Auer-
bach, X. Y. Wang, M. P. Hande, H. Hang, D. J. Wolgemuth, A. L. Joyner, and
H. B. Lieberman, unpublished) are used in the protocol for the analysis of the
S-phase checkpoint control.
3. Human fibroblasts GM847 and GM847/ATRkd are used for illustrating radia-
tion-dose-dependent G2-checkpoint control. GM847 is an SV40-transformed
human fibroblast line from a healthy individual. The GM847/ATRkd cells were
derived from GM847 cells and express a kinase-inactive allele of ATR in doxy-
cycline-free medium. GM847 lacks the G1-checkpoint control, and GM847/
ATRkd are deficient in G2-checkpoint control (9).
2.2. Media, Reagents, and Solutions
2.2.1. Cell Culture (
see
Note 1)
1. Medium for AT patient and normal human fibroblasts: Dulbecco’s modified
Eagle’s medium (DMEM; Gibco, Grand Island, NY) containing 15% heat-inacti-
Fig. 1. A typical cell cycle distribution of DNA content. Based on DNA content in
individual cells, a cell population in exponential growth status can be divided into
three subpopulations: G1/G0, S, and G2/M.
Analysis of the Mammalian Cell Cycle 25
vated fetal bovine serum (FBS); Mediatech, Herndon, VA), 1% minimum essen-
tial medium (MEM) nonessential amino acids solution (Gibco), and 10 U/mL
penicillin and streptomycin (Gibco).
2. Medium for Rad
+/+
and Rad9
-/-
mouse ES cells: knockout DMEM (cat. no. 10829-
018, Gibco) containing 15% FBS (Cell and Molecular Technologies,
Phillipsburg, NJ), 1% MEM nonessential amino acids solution (Gibco), 200-mM
1% L-glutamine solution (Gibco), 10-U/mL penicillin and streptomycin (Gibco),
0.0007% 2-mercaptoethanol (Sigma, St. Louis, MO), 1000-U/mL leukemia
inhibitor factor (Chemicon, Temekula, CA).
3. Medium for human fibroblasts GM847 and GM847/ATRkd: the same as used for
AT cells except that it contains only 10% FBS.
4. Ca
++
- and Mg
++
-free phosphate-buffered saline (PBS; Gibco).
5. Trypsin-ethylenediaminetetraacetic acid (EDTA; Gibco[MHF1]).
6. BrdU (5-bromo-2'-deoxyuridine; Sigma). Add distilled H
2
O to make 10-mM BrdU
stock solution and store at –20°C.
2.2.2. Cell Processing and Staining
1. 100% ethanol stored at –20°C.
2. Ca
++
- and Mg
++
-free PBS (Gibco).
3. Propidium iodide (PI) solution for staining DNA in fixed cells: PBS containing
20 or 50 µg/mL PI (Sigma) and 40 U/mL ribonuclease (RNase) A (Sigma). Store
in the dark at 4°C. RNase is added to the PI solution before staining cells.
4. 2 N HCl containing 0.2 mg/mL pepsin (Sigma). It is used to partially denature
genomic DNA and expose incorporated BrdU for detection.
5. 1M Tris-HCl buffer at pH 8.0.
6. PBS-TxBF solution: PBS containing 0.05% Triton X-100, 0.5 % bovine serum
albumin (BSA), and 0.5% FBS.
7. PBS-TwBF solution: PBS containing 0.1% Tween-20, 1% BSA, and 1% FBS.
8. Fluorescein isothiocyanate (FITC)-conjugated mouse anti-BrdU IgG1 antibody
(cat. no. 23614L, Pharmingen, San Diego, CA).
9. Rabbit polyclonal antibody against phosphorylated form of histone H3 and
(FITC)-conjugated antirabbit IgG2 antibody (Upstate Biotechnology, Lake
Placid, NY).
10. FITC-conjugated goat antirabbit IgG antibody (Jackson ImmunoResearch Labo-
ratories, West Grove, PA).
2.3. Equipment
1. A flow cytometer equipped with a 488-nm argon laser line is suitable for all the
analyses of cell cycle checkpoint controls described in this chapter. A FACSCalibur
flow cytometer connected with a FACSStation from Becton Dickinson was actu-
ally used for collecting and analyzing the data presented in this chapter.
2. A sterile hood to manipulate cells.
3. A CO
2
incubator at 37°C.
4. A tabletop centrifuge and an Eppendorf microcentrifuge.
26 Hang and Fox
5. A nutator to keep cells in solutions from precipitation (Adams Clay Inc, Sparks, MD).
6. An ultraviolet (UV) light chamber (see Chapter 1 for details).
7. A
137
Cs irradiator (see Chapter 1 for details).
3. Methods
3.1. G1-Phase Checkpoint Control
The G1-phase checkpoint, when activated, arrests cells in late G1 phase.
The activity of the G1 checkpoint is regulated by the p53/p21 pathway, and
mutations in p53, p21, and the other factors (e.g., ATM gene, mutated in AT
patient cells) that modify p53, p21, or both can result in G1-checkpoint control
defects. Two methods can be used to analyze G1-checkpoint deficiency: (a) DNA-
content measurement and (b) simultaneous measurement of DNA content and
BrdU uptake.
3.1.1. DNA-Content Measurement
1. Inoculate AT and normal (BJ1) cells in 10-cm dishes containing 10-mL DMEM.
Incubate at 37°C with 5% CO
2
overnight. Adjust the seeded cell numbers so that
they reach 50 to 70% confluence levels the next day. 5 × 10
5
to 2 × 10
6
cells are
needed to conveniently carry out the steps in this protocol.
2. Irradiate cells in a
137
Cs γ-ray irradiator at 4 Gy, followed by incubating cells for
8, 12, and 16 h (see Note 2). Use unirradiated cells as controls.
3. Trypsinize and harvest cells by centrifugation at 200g, and then rinse once with
2 mL cold PBS. Suspend cells with 0.5-mL cold PBS. Make sure that the sus-
pensions contain single cells with no cell clumps. Slowly drop 1.5 mL ice-cold
100% ethanol into suspended cells while mildly vortexing them. Keep the cells
at 4°C or –20°C for at least 30 min.
4. Collect cells by centrifugation and rinse once with cold PBS. Suspend cells in
1-mL PBS containing 50-µg/mL PI and 40-U/mL RNase A, and stain at 4°C for
at least 30 min.
5. Use a 488-nm argon laser line to excite PI and measure fluorescence at wave-
lengths >600 nm (see Note 3). Measure at least 10,000 cells.
6. Determine the G1-checkpoint status of cell lines by inspection, quantification, or
both of the cell cycle distribution. A cell line with normal cell cycle checkpoint
control will have an increased number of cells in G1 phase and a decreased num-
ber of cells in S phase compared to unirradiated cells at about 12 h after irradia-
tion (see Fig. 2 and Note 2). At the same time-point, cell populations with a
G1-checkpoint defect contain fewer cells in G1 phase and significantly more
cells in S phase than normal cells. Numbers of G1/G0, S, and G2/M cells can be
quantified to give more precise estimation of defective extent of G1 checkpoint
using commercially available programs such as MultiCycle (Phoenix Flow Sys-
tems) and ModFit (Verity Software). A quick and simple method to assess a
checkpoint block is to measure the cells in a window in early S phase. For example,
at 8, 12, and 16 h after irradiation, the number of normal cells in early S phase is