ljundquist and sargent solutions
Bạn đang xem bản rút gọn của tài liệu. Xem và tải ngay bản đầy đủ của tài liệu tại đây (1.79 MB, 343 trang )
Exercises
in
Recursive Macroeconomic Theory
preliminary and incomplete
Stijn Van Nieuwerburgh
Pierre-Olivier Weill
Lars Ljungqvist
Thomas J. Sargent
Introduction
This is a first version of the solutions to the exercises in Recursive Macroeco-
nomic Therory, First Edition, 2000, MIT press, by Lars Ljungqvist and Thomas J.
Sargent. This solution manuscript is currently only available on the web. We in-
vite the reader to bring typos and other corrections to our attention. Please email
, or
We will regularly update this manuscript during the following months. Some
questions ask for computations in matlab. The program files can be downloaded
from the ftp site zia.stanford.edu/pub/sargent/rmtex.
The authors, Stanford University, March 15, 2003.
Contents
Introduction 2
List of Figures 5
Chapter 1. Time series 7
Chapter 2. Dynamic programming 33
Chapter 3. Practical dynamic programming 37
Chapter 4. Linear quadratic dynamic programming 43
Chapter 5. Search, matching, and unemployment 55
Chapter 6. Recursive (partial) equilibrium 83
Chapter 7. Competitive equilibrium with complete markets 95
Chapter 8. Overlapping generation models 109
Chapter 9. Ricardian equivalence 161
Chapter 10. Asset pricing 163
Chapter 11. Economic growth 175
Chapter 12. Optimal taxation with commitment 187
Chapter 13. Self-insurance 201
Chapter 14. Incomplete markets models 211
Chapter 15. Optimal social insurance 223
Chapter 16. Credible government policies 257
Chapter 17. Fiscal-monetary theories of inflation 267
Chapter 18. Credit and currency 283
Chapter 19. Equilibrium search and matching 307
Index 343
3
List of Figures
1 Exercise 1.7 a 21
2 Exercise 1.7 b 22
3 Exercise 1.7 c 22
4 Exercise 1.7 d 23
5 Exercise 1.7 e 23
6 Exercise 1.7 f 24
7 Exercise 1.7 g 24
1 Exercise 3.1 : Value Function Iteration VS Policy Improvement 41
1 Exercise 4.5 52
1 Exercise 8.1 113
1 Exercise 10.1 : Hansen-Jagannathan bounds 165
1 Exercise 13.2 205
1 Exercise 14.2 a 214
2 Exercise 14.2 b 214
3 Exercise 14.2 c 215
4 Exercise 14.5 : Cross-sectional Mean and Dispersion of
Consumption and Assets 221
1 Exercise 15.2 226
2 Exercise 15.10 a : Consumption Distribution 238
3 Exercise 15.10 b : Consumption, Promised Utility, Profits and
Bank Balance in Contract that Maximizes the Money Lender’s
Profits 239
4 Exercise 15.10 c : Consumption, Promised Utility, Profits and
Bank Balance in Contract that Gives Zero Profits to Money
Lender 240
5 Exercise 15.11 a : Pareto Frontier, β = 0.95 241
6 Exercise 15.11 b : Pareto Frontier, β = 0.85 242
7 Exercise 15.11 c : Pareto Frontier, β = 0.99 243
5
6 LIST OF FIGURES
8 Exercise 15.12 a : Consumption, Promised Utility, Profits and
Bank Balance in Contract that Maximizes the Money Lender’s
Profits 245
9 Exercise 15.12 b : Consumption Distribution 246
10 Exercise 15.12 c : Wage-Tenure Profile 247
11 Exercise 15.14 a : Profits of Money Lender in Thomas-Worral
Model 250
12 Exercise 15.14 b Evolution of Consumption Distribution over
Time 251
1 Exercise 19.4 a: implicit equation for θ
i
319
2 Exercise 19.4 b : Solving for unemployment level in each skill
market 320
3 Exercise 19.4 b : Solving for the aggregate unemployment level321
4 Exercise 19.5 : Solving for equilibrium unemployment 323
5 Execise 19.6 : Solving for equilibrium unemployment 326
CHAPTER 1
Time series
7
8 1. TIME SERIES
Exercise 1.1.
Consider the Markov Chain (P, π
0
) =
.9 .1
.3 .7
,
.5
.5
, where the state
space is
x =
1
5
. Compute the likelihood of the following three histories for
t = 0, 1, 2, 3, 4:
a. 1,5,1,5,1.
b. 1,1,1,1,1.
c. 5,5,5,5,5.
Solution
The probability of observing a given history up to t = 4, say (x
i
5
, x
i
4
, x
i
3
, x
i
2
, x
i
1
, x
i
0
),
is given by
P (x
i
4
, x
i
3
, x
i
2
, x
i
1
, x
i
0
) = P
i
4
,i
3
P
i
3
,i
2
P
i
2
,i
1
P
i
1
,i
0
π
0i
0
where P
ij
= Prob (x
t+1
=
x
j
|x
t
= x
i
) and π
0i
= Prob (x
0
= x
i
).
By applying this formula one obtains the following results:
a. P (1, 5, 1, 5, 1) = P
21
P
12
P
21
P
21
π
01
= (.3) (.1) (.3) (.1) (.5) = .00045.
b. P (1, 1, 1, 1, 1) = P
11
P
11
P
11
P
11
π
01
= (.9)
4
(.5) = .3281.
c. P (5, 5, 5, 5, 5) = P
22
P
22
P
22
P
22
π
02
= (.7)
4
(.5) = .12.
Exercise 1.2.
A Markov chain has state space x =
1
5
. It is known that E (x
t+1
|x
t
=
x) =
1.8
3.4
and that E
x
2
t+1
|x
t
=
x
=
5.8
15.4
. Find a transition matrix consistent
with these conditional expectations. Is this transition matrix unique (i.e., can you
find another one that is consistent with these conditional expectations)?
Solution
From the formulas for forecasting functions of a Markov chain, we know that
E (h(x
t+1
)|x
t
=
x) = Ph,
where h(x) is a function of the state represented by an n × 1 vector h. Applying
this formula yields:
E (x
t+1
|x
t
= x) = P x and E
x
2
t+1
|x
t
= x
= P x
2
.
This yields a set of 4 linear equations:
1. TIME SERIES 9
1.8
3.4
= P
1
5
and
5.8
15.4
= P
1
25
,
which can be solved for the 4 unknowns. Alternatively, using matrix notation,
we can rewrite this as e = P h, where e = [e
1
, e
2
], e
1
= E (x
t+1
|x
t
=
x) , e
2
=
E
x
2
t+1
|x
t
=
x
and h = [h
1
, h
2
], where h
1
= x and h
2
= x
2
:
1.8 5.8
3.4 15.4
= P
1 1
5 25
.
Then P is uniquely determined as P = eh
−1
. Uniqueness follows from the fact
that h
1
and h
2
are linearly independent. After some algebra we obtain a well-
defined stochastic matrix:
P =
.8 .2
.4 .6
.
Exercise 1.3.
Consumption is governed by an n state Markov chain P, π
0
where P is a stochastic
matrix and π
0
is an initial probability distribution. Consumption takes one of the
values in the n×1 vector ¯c. A consumer ranks stochastic processes of consumption
t = 0, 1 . . . according to
E
∞
t=0
β
t
u(c
t
),
where E is the mathematical expectation and u(c) =
c
1−γ
1−γ
for some parameter
γ ≥ 1. Let u
i
= u(¯c
i
). Let v
i
= E[
∞
t=0
β
t
u(c
t
)|c
0
= ¯c
i
] and V = Ev, where
β ∈ (0, 1) is a discount factor.
a. Let u and v be the n × 1 vectors whose ith components are u
i
and v
i
, re-
spectively. Verify the following formulas for v and V : v = (I − βP )
−1
u, and
V =
i
π
0,i
v
i
.
b. Consider the following two Markov processes:
Process 1: π
0
=
.5
.5
, P =
1 0
0 1
.
Process 2: π
0
=
.5
.5
, P =
.5 .5
.5 .5
.
For both Markov processes, ¯c =
1
5
. Assume that γ = 2.5, β = .95. Compute
unconditional discounted expected utility V for each of these processes. Which
of the two processes does the consumer prefer? Redo the calculations for γ = 4.
Now which process does the consumer prefer?
c. An econometrician observes a sample of 10 observations of consumption rates
10 1. TIME SERIES
for our consumer. He knows that one of the two preceding Markov processes
generates the data, but not which one. He assigns equal “prior probability” to
the two chains. Suppose that the 10 successive observations on consumption are as
follows: 1, 1, 1, 1, 1, 1, 1, 1, 1, 1. Compute the likehood of this sample under process
1 and under process 2. Denote the likelihood function Prob(data|Model
i
), i = 1, 2.
d. Suppose that the econometrician uses Bayes’ law to revise his initial proba-
bility estimates for the two models, where in this context Bayes’ law states:
Prob(Model
i
|data) =
Prob(data|Model
i
) · Prob(Model
i
)
j
Prob(data|Model
j
) · Prob(Model
j
)
.
The denominator of this expression is the unconditional probability of the data.
After observing the data sample, what probabilities does the econometrician place
on the two possible models?
e. Repeat the calculation in part d, but now assume that the data sample is
1, 5, 5, 1, 5, 5, 1, 5, 1, 5.
Solution
a. Given that v
i
= E [
∞
t=0
β
t
u(c
t
)|c
0
=
c
i
] , we can apply the usual vector nota-
tion (by stacking ):
v = E
∞
t=0
β
t
u(c
t
)|c
0
=
c
.
To apply the forecasting function formula in the notes:
E
∞
k=0
β
k
(h(x
t+k
)|x
t
=
x) = (I −βP)
−1
h.
Let h(x) = u(c). Then it follows immediately that:
v = E
∞
t=0
β
t
u(c
t
)|c
0
=
c
= (I − βP )
−1
u.
Second, to compute V = Ev, simply note that in general the unconditional expec-
tation at time 0 of a foreasting function h is given by: E(h(x
0
)) =
n
i=1
h
i
π
0,i
=
π
0
h, or, in particular:
V =
n
i=1
v
i
π
0,i
.
Also, you should be able to verify that V = E [
∞
t=0
β
t
u(c
t
)] by applying the law
of iterated expectations.
b. the matlab program exer0103.m computes the solutions.
Process1 and Process 2: V = −7.2630 for γ = 2.5
Process1 and Process 2: V = −3.36 for γ = 4
1. TIME SERIES 11
Note that the consumer is indifferent between both of the consumption processes
regardless of γ.
c. Applying the same logic as in exercise in, construct the likelihood function
as the probability of having observed this partical history of consumption rates,
conditional on the model.
Prob(data|Model
1
) = (P
1,1
)
9
(.5) = .5,
Prob(data|Model
2
) = (P
1,1
)
9
(.5) = .5
10
= .0009765.
d. Applying Bayes’ law:
Prob (Model
1
|data) =
Prob(data|Model
1
)Prob(Model
1
)
i
Prob(data|Model
i
)Prob(Model
i
)
=
.5Prob(Model
1
)
.5Prob(Model
1
) + .000976Prob(Model
2
)
,
and by the same logic:
Prob (Model
2
|data) =
.000976Prob(Model
2
)
.5Prob(Model
1
) + .000976Prob(Model
2
)
.
e. Consider the sample (1, 5, 5, 1, 5, 5, 1, 5, 1, 5)
Prob(data|Model
1
) = P
21
P
22
P
12
P
21
P
22
P
12
P
21
P
12
P
21
(.5) =
= 0,
Prob(data|Model
2
) = P
21
P
22
P
12
P
21
P
22
P
12
P
21
P
12
P
21
(.5)
= .5
10
= .0009765.
Applying Bayes’ law:
Prob (Model
1
|data) =
Prob(data|Model
1
)Prob(Model
1
)
i
Prob(data|Model
i
)Prob(Model
i
)
= 0,
which implies:
Prob (Model
2
|data) = 1.
Exercise 1.4.
Consider the univariate stochastic process
(1) y
t+1
= α +
4
j=1
ρ
j
y
t+1−j
+ cw
t+1
,
12 1. TIME SERIES
where w
t+1
is a scalar martingale difference sequence adapted to
J
t
= [w
t
, . . . , w
1
, y
0
, y
−1
, y
−2
, y
−3
], α = µ(1 −
j
ρ
j
) and the ρ
j
’s are such that
the matrix
A =
ρ
1
ρ
2
ρ
3
ρ
4
α
1 0 0 0 0
0 1 0 0 0
0 0 1 0 0
0 0 0 0 1
,
has all of its eigenvalues in modulus bounded below unity.
a. Show how to map this process into a first-order linear stochastic difference
equation.
b. For each of the following examples, if possible, assume that the initial con-
ditions are such that y
t
is covariance stationary. For each case, state the ap-
propriate initial conditions. Then compute the covariance stationary mean and
variance of y
t
assuming the following parameter sets of parameter values: i.
ρ =
1.2 −.3 0 0
, µ = 10, c = 1. ii. ρ =
1.2 −.3 0 0
, µ = 10, c = 2.
iii. ρ =
.9 0 0 0
, µ = 5, c = 1. iv. ρ =
.2 0 0 .5
, µ = 5, c = 1.
v. ρ =
.8 .3 0 0
, µ = 5, c = 1. Hint 1: The Matlab program doublej.m
, in particular, the command X=doublej(A,C*C’) computes the solution of the
matrix equation A
XA + C
C = X. This program can be downloaded from
/>Hint 2: The mean vector is the eigenvector of A associated with a unit eigenvalue,
scaled so that the mean of unity in the state vector is unity.
c. For each case in part b, compute the h
j
’s in E
t
y
t+5
= γ
0
+
3
j=0
h
j
y
t−j
.
d. For each case in part b, compute the
˜
h
j
’s in E
t
∞
k=0
.95
k
y
t+k
=
3
j=0
˜
h
j
y
t−j
.
e. For each case in part b, compute the autocovariance E(y
t
−µ
y
)(y
t−k
−µ
y
) for
the three values k = 1, 5, 10.
Solution
a. To compute the solutions this problem , you can use the program ex0104.m .
Mapping the univariate stochastic process into a first-order linear stochastic dif-
ference equation:
1. TIME SERIES 13
The first-order linear difference equation corresponding to (1) is :
(2)
y
t+1
y
t
y
t−1
y
t−2
1
=
ρ
1
ρ
2
ρ
3
ρ
4
α
1 0 0 0 0
0 1 0 0 0
0 0 1 0 0
0 0 0 0 1
y
t
y
t−1
y
t−2
y
t−3
1
+
c
0
0
0
0
w
t+1
,
or, equivalently:
x
t+1
= Ax
t
+ Cw
t+1
,
for t = 0, 1, 2 . . .,where x
t
=
y
t+1
y
t
y
t−1
y
t−2
1
, x
0
is a given initial
condition, A is a 5 ×5 matrix and C is an 5 ×1 matrix.
b. Assume that the initial conditions are such that y
t
is covariance stationary.
Consider the initial vector x
0
as being drawn from a distibution with mean µ
0
and covariance matrix Σ
0
.
Given stationarity, we can derive the unconditional mean of the process by taking
unconditional expectations of eq.(1) :
µ = α + µ
4
j=1
ρ
j
,
or, equivalently:
µ = α
1 −
4
j=1
ρ
j
.
This implies that we can write:
y
t+1
− µ =
4
j=1
ρ
j
(y
t+1−j
− µ) + cw
t+1
,
or
x
t+1
= Ax
t
+ Cw
t+1
,
where x
t+1
= x
t+1
− µ where µ
=
µ µ µ µ 1
.
As you know, the second moments can be derived by calculating C
x
(0) = Ex
t+1
x
t+1
,
which produces a discrete Lyapunov equation:
C
x
(0) = AC
x
(0)A
+ CC
.
Stationarity requires two conditions:
• All of the eigenvalues of A are less than unity in modulus, except pos-
sibly for the one associated with the constant term
• the initial condition x
0
needs to be drawn from the stationary distribu-
tion, described by its first two moments µ and C
x
(0)
14 1. TIME SERIES
i. ρ =
1.2 −3 0 0
, µ = 10,c = 1
This implies:
(3)
y
t+1
y
t
y
t−1
y
t−2
1
=
1.2 −.3 0 0 1
1 0 0 0 0
0 1 0 0 0
0 0 1 0 0
0 0 0 0 1
y
t
y
t−1
y
t−2
y
t−3
1
+
1
0
0
0
0
w
1,t+1
.
The eigenvalues are given by λ =
0 0 .35 .84 1
. The relevant eigenvalues
are smaller than unity. The first condition for stationarity is satisfied. Now, we
can solve the discrete Lyupanov equation for C
x
(0).
Recall from the previous handout that:
E
t
(x
t+j
− E(x
t+j
|J
t
)) (x
t+j
− E(x
t+j
|J
t
))
=
j−1
l=0
A
l
CC
A
l
.
The matlab program doublej.m calculates the lim
j→∞
of the above expression
(type help doublej.m to verify). As one would expect, if the system is stationary,
this limit converges to the unconditional second moment:
C
x
(0) = lim
j→∞
E
t
(x
t+j
− E(x
t+j
|J
t
)) (x
t+j
− E(x
t+j
|J
t
))
=
∞
l=0
A
l
CC
A
l
.
Note that CC
is a matrix of zeros in this case except for the (1,1)st element
which is 1.
To calculate C
x
(0), simply type V = doublej(A, CC
):
C
x
(0) =
7.42 6.85 6.00 5.14 0
6.85 7.42 6.85 6.00 0
6.00 6.85 7.42 6.85 0
5.14 6.00 6.85 7.42 0
0 0 0 0 0
.
Obviously, the diagonal elements (except for the zero element associated with the
constant) contain the variance of y
t
.
ii. ρ =
1.2 −3 0 0
, µ = 10,c = 2
The 1st part of the answer to i. is still valid, as A has not changed. Its eigenvalues
are bounded below untiy in modulus. There is a covariance stationary distribution
associated with this system.
C
x
(0) =
29.71 27.42 24.00 20.57 0
27.42 29.71 27.42 24.00 0
24.00 27.42 29.71 27.42 0
20.57 24.00 27.42 29.71 0
0 0 0 0 0
.
1. TIME SERIES 15
iii.ρ =
.9 0 0 0
, µ = 5,c = 1
Consider the associated first-order difference equation:
(4)
y
t+1
y
t
y
t−1
y
t−2
1
=
.9 0 0 0 .5
1 0 0 0 0
0 1 0 0 0
0 0 1 0 0
0 0 0 0 1
y
t
y
t−1
y
t−2
y
t−3
1
+
1
0
0
0
0
w
t+1
.
The eigenvalues are given by λ
=
0 0 0 0.9 1
. Note that all the eigen-
values are bounded below unity except for the one associated with the constant
term.
C
x
(0) =
5.26 4.73 4.26 3.83 0
4.73 5.26 4.73 4.26 0
4.26 4.73 5.26 4.73 0
3.83 4.26 4.73 5.26 0
0 0 0 0 0
,
and µ
=
5 5 5 5 1
.
In order for the sequence {x
t
} to satisfy stationarity, the intitial value x
0
needs to
be drawn from the stationary distribution with µ and C
x
(0) as the unconditional
moments.
iv. ρ =
.2 0 0 .5
, µ = 5, c = 1,
A =
.2 0 0 .5 1.5
1 0 0 0 0
0 1 0 0 0
0 0 1 0 0
0 0 0 0 1
.
As before, calculate the eigenvalues: λ
=
.8957 .0496 + .8365i .0496 −.8365i −.7950 1
.
Note that there are 2 complex eigenavlues. These invariably appear as complex
conjugates:
λ
1
= a + bi; λ
2
= a − bi.
Rewrite it in polar coordinate form:
λ
1
= R [cos θ + i sin θ] ,
where R and θ are defined as:
R =
√
a
2
+ b
2
; cos θ =
a
R
; sin θ =
b
R
,
R is the modulus of a complex numer. All of the relevant eigenvalues are bounded
below unity in modulus (R =
√
a
2
+ b
2
= .83). Next, compute C
x
(0) :
16 1. TIME SERIES
C
x
(0) =
1.47 .41 .16 .24 0
.41 1.47 .41 .16 0
.16 .41 1.47 .41 0
.24 .16 .41 1.47 0
0 0 0 0 0
,
and µ
=
5 5 5 5 1
.
v. ρ =
.8 .3 0 0
, µ = 5, c = 1,
A =
.8 .3 0 0 1.5
1 0 0 0 0
0 1 0 0 0
0 0 1 0 0
0 0 0 0 1
,
and compute the eigenvalues: λ
=
0 .0 −.27 1.07 1
. The 1st condition
for stationarity is violated.
c. Note that in a linear model the conditonal expectation and the best linear pre-
dictor coincide. Recall the set of K orthogonality conditions defining the best lin-
ear predictor, i.e. the linear projection of Y = y
t+5
on X =
y
t
y
t−1
y
t−2
y
t−3
1
:
E (X (Y − X
β)) = 0,
where K = 5 (# of parameters). Solving for β yields the following expression:
β = (E(XX
))
−1
E (XY ) .
Importantly, no stationarity assumptions have been imposed. Two observations
are worth mentioning here. First, note that X = x
t
, as defined in part b. Keep
in mind that E(x
t
− µ)(x
t
− µ)
= C
x
(0) = Ex
t
x
t
− µµ
.
C
x,t
(0) = E(XX
) − E(X)E(X
),
which implies that:
E(XX
) = C
x,t
(0) + µ
t
µ
t
.
Second, note that:
E (Xy
t+5
) = E
x
t
x
t+5
G
=
C
x,t
(−5) + µ
t
µ
t+5
G
,
where G =
1 0 0 0 0
and C
x,t
(−5) = C
x,t
(5)
= C
x,t
(0)
A
5
.
Assuming stationarity, we obtain the following formula:
β = (C
x
(0) + µµ
)
−1
(C
x
(−5) + µµ
) G
= (C
x
(0) + µµ
)
−1
C
x
(0)A
5
+ µµ
G
.
1. TIME SERIES 17
i. β
=
.7387 −.26 0.0 0.0 5.21
.
ii. β
=
.7387 −.26 0.0 0.0 5.21
.
iii. β
=
.5905 0.0 0.0 0.0 2.0476
.
iv. β
=
.2003 .02 .004 .25 2.6244
.
d. Assume the eigenvalues of .95A are bounded below untiy in modulus:
E
t
∞
k=0
.95
k
y
t+k
= E
t
∞
k=0
.95
k
Gx
t+k
= G
∞
k=0
.95
k
A
k
x
t
= G (I − .95A)
−1
x
t
.
By the same reasoning as before, let Y = G (I − .95A)
−1
x
t
and let X
=
y
t
y
t−1
y
t−2
y
t−3
1
Solving for β yields the following expression:
β = (E(XX
))
−1
E (XY )
= (C
x
(0) + µµ
)
−1
E(x
t
x
t
) (I − .95A)
−1
G
= (C
x
(0) + µµ
)
−1
(C
x
(0) + µµ
) (I − .95A)
−1
G
= (I − .95A)
−1
G
,
where G =
1 0 0 0 0
.
i. β
=
7.64 −2.17 0.0 0 145.3155
.
ii. β
=
7.64 −2.17 0.0 0 145.3155
.
iii. β
=
6.89 0.0 0.0 0 65.51
.
iv. β
=
2.4829 1.0644 1.1204 1.1794 70.76
.
v. .95A has eigenvalues: λ
=
0 0 − 26 1.02 .95
; E
t
∞
k=0
.95
k
y
t+k
ex-
plodes.
e.To compute the autocovariances, recall that C
x
(j) = A
j
C
x
(0)
i. C
x
(1)(1, 1) = 6.85, C
x
(5)(1, 1) = 3.70, C
x
(10)(1, 1) = 1.59.
ii. C
x
(1)(1, 1) = 27.41 , C
x
(5)(1, 1) = 14.81 , C
x
(10)(1, 1) = 6.39.
iii. C
x
(1)(1, 1) = 4.73 , C
x
(5)(1, 1) = 3.10 , C
x
(10)(1, 1) = 1.83.
iv. C
x
(1)(1, 1) = .41 , C
x
(5)(1, 1) = .36 , C
x
(10)(1, 1) = .13.
Exercise 1.5.
A consumer’s rate of consumption follows the stochastic process
(5) c
t+1
= α
c
+
2
j=1
ρ
j
c
t−j+1
+ w
t+1
+
2
j=1
δ
j
z
t+1−j
+ ψ
1
w
1,t+1
,
18 1. TIME SERIES
(6) z
t+j
=
2
j=1
γ
j
c
t−j+1
+
2
j=1
φ
j
z
t−j+1
, +ψ
2
w
2,t+1
where w
t+1
is a 2 × 1 martingale difference sequence, adapted to
J
t
=
w
t
. . . w
1
c
0
c
−1
z
0
z
−1
, with contemporaneous covariance matrix
Ew
t+1
w
t+1
|J
t
= I, and the coefficients ρ
j
, δ
j
, γ
j
, φ
j
are such that the matrix
A =
ρ
1
ρ
2
δ
1
δ
2
α
c
1 0 0 0 0
γ
1
γ
2
φ
1
φ
2
0
0 0 1 0 0
0 0 0 0 1
,
has eigenvalues bounded strictly below unity in modulus.
The consumer evaluates consumption streams according to
(2) V
0
= E
0
∞
t=0
.95
t
u(c
t
),
where the one-period utility function is
(3) u(c
t
) = −.5(c
t
− 60)
2
.
a. Find a formula for V
0
in terms of the parameters of the one-period utility
function (3) and the stochastic process for consumption.
b. Compute V for the following two sets of parameter values: i. ρ =
.8 −.3
, α
c
=
1, δ =
.2 0
γ =
0 0
, φ =
.7 −.2
, ψ
1
= ψ
2
= 1.
ii. Same as for part i except now ψ
1
= 2, ψ
2
= 1.
Hint: Remember doublej.m .
Solution
a. Consider the first-order linear difference equation:
(7)
c
t+1
c
t
z
t+1
z
t
1
=
ρ
1
ρ
2
δ
1
δ
2
α
c
1 0 0 0 0
γ
1
γ
2
φ
1
φ
2
0
0 0 1 0 0
0 0 0 0 1
c
t
c
t−1
z
t
z
t−2
1
+
ψ
1
0
0 0
0 ψ
2
0 0
0 0
w
1,t+1
w
2,t+1
.
Guess that V
0
is quadratic in x, the state vector:
V
0
= x
Bx + d,
where d is an arbitrary state vector.
1. TIME SERIES 19
Then we know, from the definition of V
0
, that:
(8) V
0
= (x
0
Gx
0
) + βE
0
V
1
,
where
G =
−.5 0 0 0 30
0 0 0 0 0
0 0 0 0 0
0 0 0 0 0
30 0 0 0 −1800
.
Note that:
E
0
V
1
= d + E
0
(Ax
0
+ Cw
1
)
B (Ax
0
+ Cw
1
)
= x
0
A
BA
x
0
+ E
0
(w
1
C
BCw
1
)
= x
0
A
BA
x
0
+ tr (BCE
0
w
1
w
1
C
)
= d + x
0
A
BA
x
0
+ tr (BCC
) .
Substitute this result back into eq.(21):
x
0
Bx
0
+ d = x
0
Gx
0
+ β [x
0
A
BA
x
0
+ tr (BCC
)] + βd
= x
0
Gx
0
+ β [x
0
A
BA
x
0
+ tr (BCC
) + d] .
Collecting terms, this yields two equations:
(9) B = G + β [A
BA] ,
and
(10) d(1 − β) = βtr (C
BC) .
i.Use ex0105.m to compare your solutions. Make sure not to forget the discount
factor β = .95. The command to compute B is doublej (
√
.95A, G), which pro-
duces:
B = 10
4
∗
−1.3284 −1.2803 0 0 −0.6690
−1.2803 −1.2620 0 0 −0.6356
0 0 0 0 0
0 0 0 0 0
−0.6690 −0.6356 0 0 −0.3600
d = −2.5240e + 006.
ii. Note that only d changes (the risk premium):
d = −1.0096e + 007.
20 1. TIME SERIES
Exercise 1.6.
Consider the stochastic process {c
t
, z
t
} defined by equations (1) in exercise 1.5.
Assume the parameter values described in part b, item i. If possible, assume the
initial conditions are such that {c
t
, z
t
} is covariance stationary.
a. Compute the initial mean and covariance matrix that make the process co-
variance stationary.
b. For the initial conditions in part a, compute numerical values of the following
population linear regression:
c
t+2
= α
0
+ α
1
z
t
+ α
2
z
t−4
+
t
where E
t
1 z
t
z
t−4
=
0 0 0
.
Solution
a. Use ex0105.m to compare your solutions
C
x
(0) =
1.97 1.24 0.24 0.48 0
1.24 1.97 .07 .24 0
0.24 0.07 1.57 .92 0
0.48 0.24 .92 1.57 0
0 0 0 0 0
,
and µ
=
.666 .666 0 0 .3333
× 3 =
2 2 0 0 1
.
b. Following the same line of reasoning as before, derive the orthogonality con-
ditions:
EX
(Y − XB) = 0,
where X
=
1 z
t
z
t−4
and Y = c
t+2
.Solving for β :
β = (E(XX
))
−1
E (XY ) ,
where
E(XX
) =
1 1 1
Ez
2
t
cov(z
t
, z
t−4
) 1
cov(z
t
, z
t−4
) Ez
2
t−4
1
=
1 1 1
1.57 −.0336 1
−.0336 1.57 1
.
Note that cov(z
t
, z
t−4
) is the (3,3) element of C
x
(4) = A
4
C
x
(0). Similarly,
E(XY ) =
E(c
t+2
)
cov(c
t+2
, z
t
)
cov(c
t+2
, z
t−4
)
=
2
0.1155
−.0497
.
This implies
β
=
4.29 4.19 −6.48
.
1. TIME SERIES 21
0 20 40 60 80
−4
−3
−2
−1
0
1
2
3
Simulation
0 5 10 15 20 25
0
0.2
0.4
0.6
0.8
1
Impulse Response
0 1 2 3
0
0.2
0.4
0.6
0.8
1
Log Spectrum
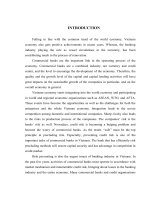
Figure 1. Exercise 1.7 a
Exercise 1.7.
Get the Matlab programs bigshow.m and freq.m .
Use bigshow to compute and display a simulation of length 80, an impulse re-
sponse function, and a spectrum for each of the following scalar stochastic pro-
cesses y
t
. In each of the following, w
t
is a scalar martingale difference sequence
adapted to its own history and the initial values of lagged y’s. a. y
t
= w
t
. b.
y
t
= (1 + .5L)w
t
. c. y
t
= (1 + .5L + .4L
2
)w
t
. d. (1 − .999L)y
t
= (1 − .4L)w
t
. e.
(1 − .8L)y
t
= (1 + .5L + .4L
2
)w
t
. f. (1 + .8L)y
t
= w
t
. g. y
t
= (1 − .6L)w
t
.
Study the output and look for patterns. When you are done, you will be well on
your way to knowing how to read spectral densities.
Solution
a. y
t
= w
t
see Figure 1.
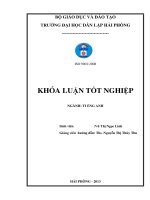
b. y
t
= (1 + 0.5L)w
t
see Figure 2.
c. y
t
= (1 + 0.5L + 0.4L
2
)w
t
see Figure 3.
d. (1 − 0.999L)y
t
= (1 − 0.4L)w
t
see Figure 4.
e. (1 − 0.8L) y
t
= (1 + 0.5L + 0.4L
2
)w
t
see Figure 5.
f. (1 + 0.8L)y
t
= w
t
see Figure 6.
22 1. TIME SERIES
0 20 40 60 80
−3
−2
−1
0
1
2
3
Simulation
0 5 10 15 20 25
0
0.2
0.4
0.6
0.8
1
Impulse Response
0 1 2 3
−1
−0.5
0
0.5
Log Spectrum
Figure 2. Exercise 1.7 b
0 20 40 60 80
−4
−2
0
2
4
6
Simulation
0 5 10 15 20 25
0
0.2
0.4
0.6
0.8
1
Impulse Response
0 1 2 3
−1
−0.5
0
0.5
1
Log Spectrum
Figure 3. Exercise 1.7 c
1. TIME SERIES 23
0 20 40 60 80
−5
0
5
10
15
Simulation
0 5 10 15 20 25
0.6
0.7
0.8
0.9
1
Impulse Response
0 1 2 3
0
2
4
6
8
10
12
Log Spectrum
Figure 4. Exercise 1.7 d
0 20 40 60 80
−6
−4
−2
0
2
4
6
Simulation
0 5 10 15 20 25
0.2
0.4
0.6
0.8
1
1.2
1.4
Impulse Response
0 1 2 3
−2
−1
0
1
2
3
4
Log Spectrum
Figure 5. Exercise 1.7 e
24 1. TIME SERIES
0 20 40 60 80
−3
−2
−1
0
1
2
3
4
Simulation
0 5 10 15 20 25
−0.5
0
0.5
1
Impulse Response
0 1 2 3
−1
0
1
2
3
Log Spectrum
Figure 6. Exercise 1.7 f
0 20 40 60 80
−4
−3
−2
−1
0
1
2
3
Simulation
0 5 10 15 20 25
−0.5
0
0.5
1
Impulse Response
0 1 2 3
−1.5
−1
−0.5
0
0.5
Log Spectrum
Figure 7. Exercise 1.7 g
1. TIME SERIES 25
g. y
t
= (1 − 0.4L)w
t
see Figure 7.