Báo cáo khoa học: Secondary structure conversions of Alzheimer’s Ab(1–40) peptide induced by membrane-mimicking detergents pdf
Bạn đang xem bản rút gọn của tài liệu. Xem và tải ngay bản đầy đủ của tài liệu tại đây (465.14 KB, 12 trang )
Secondary structure conversions of Alzheimer’s Ab(1–40)
peptide induced by membrane-mimicking detergents
Anna Wahlstro
¨
m
1,
*, Loı
¨
c Hugonin
1,
*, Alex Pera
´
lvarez-Marı
´n
1,
*, Ju
¨
ri Jarvet
2
and Astrid Gra
¨
slund
1
1 Department of Biochemistry and Biophysics, The Arrhenius Laboratories for Natural Sciences, Stockholm University, Sweden
2 The National Institute of Chemical Physics and Biophysics, Tallinn, Estonia
Introduction
The amyloid b peptide (Ab) is the major component of
the amyloid plaques, which are found in the brains of
Alzheimer’s disease patients. The Ab-peptide is a
39–42 residue peptide cleaved by processing of the
amyloid-b precursor protein [1,2]. The Ab(1–40)
peptide has a hydrophilic N-terminal domain and a
more hydrophobic C-terminal domain, and contains a
central hydrophobic cluster (residues 17–21) suggested
to play an important role in peptide aggregation. Solu-
ble oligomeric peptide aggregates are reported to medi-
ate toxic effects on neurons and synapses [1,3] and
have attracted growing interest because of their proba-
ble link to the pathology of the disease. The formation
of aggregates occurs in parallel with a conformational
change of the peptide structure to b-sheet.
In vitro, the Ab monomer is in a dominating
random coil secondary structure in solution at room
temperature and physiological pH [4–7]. However, in
Keywords
amyloid b peptide; CD; NMR; oligomer; SDS
Correspondence
A. Gra
¨
slund, Department of Biochemistry
and Biophysics, The Arrhenius Laboratories
for Natural Sciences, Stockholm University,
SE-10691 Stockholm, Sweden
Fax: +46 8 155597
Tel: +46 8 162450
E-mail:
*These authors contributed equally to this
work
(Received 29 April 2008, revised 8 August
2008, accepted 13 August 2008)
doi:10.1111/j.1742-4658.2008.06643.x
The amyloid b peptide (Ab) with 39–42 residues is the major component of
amyloid plaques found in brains of Alzheimer’s disease patients, and solu-
ble oligomeric peptide aggregates mediate toxic effects on neurons. The Ab
aggregation involves a conformational change of the peptide structure to
b-sheet. In the present study, we report on the effect of detergents on the
structure transitions of Ab, to mimic the effects that biomembranes may
have. In vitro , monomeric Ab(1–40) in a dilute aqueous solution is weakly
structured. By gradually adding small amounts of sodium dodecyl sulfate
(SDS) or lithium dodecyl sulfate to a dilute aqueous solution, Ab(1–40) is
converted to b-sheet, as observed by CD at 3 °C and 20 °C. The transition
is mainly a two-state process, as revealed by approximately isodichroic
points in the titrations. Ab(1–40) loses almost all NMR signals at dodecyl
sulfate concentrations giving rise to the optimal b-sheet content (approxi-
mate detergent ⁄ peptide ratio = 20). Under these conditions, thioflavin T
fluorescence measurements indicate a maximum of aggregated amyloid-like
structures. The loss of NMR signals suggests that these are also involved
in intermediate chemical exchange. Transverse relaxation optimized spec-
troscopy NMR spectra indicate that the C-terminal residues are more
dynamic than the others. By further addition of SDS or lithium dodecyl
sulfate reaching concentrations close to the critical micellar concentration,
CD, NMR and FTIR spectra show that the peptide rearranges to form a
micelle-bound structure with a-helical segments, similar to the secondary
structures formed when a high concentration of detergent is added directly
to the peptide solution.
Abbreviations
Ab-peptide, amyloid b peptide; D ⁄ P, detergent to peptide ratio; HSQC, heteronuclear single quantum coherence; LiDS, lithium dodecyl
sulfate; ppII, polyproline II; SDS-d
25,
deuterated SDS; ThT, thioflavin T; TROSY, transverse relaxation optimized spectroscopy.
FEBS Journal 275 (2008) 5117–5128 ª 2008 The Authors Journal compilation ª 2008 FEBS 5117
membrane-mimicking environments, such as SDS
micelles, the Ab-peptide displays an a-helical structure,
with two a-helical segments comprising residues 15–24
and 29–35, separated by a flexible hinge [8], and less
structured N- and C-termini. In the presence of phos-
pholipid vesicles, a-helical structures as well as b-sheet
structures have been reported [9]. Rangachari et al.
[10] have described interfacial aggregation of Ab(1–40)
at a polar ⁄ nonpolar interface, with a concomitant
increase in b-structure content, brought about by SDS
micelles. In line with this finding, it was recently shown
that the Ab(1–40) and Ab(1–42) peptides form b-sheet-
rich aggregates at SDS concentrations significantly
below the critical micellar concentration [11]. These
aggregates give rise to thioflavin T (ThT) fluorescence
and are neurotoxic.
In the present study, we report on further properties
of soluble oligomeric b-sheet-rich Ab(1–40) aggregates,
formed at submicellar SDS or lithium dodecyl sulfate
(LiDS) concentrations at detergent ⁄ peptide ratios of
approximately 20. The results obtained by CD, NMR,
FTIR and ThT fluorescence are compared and inter-
preted in terms of mixed micelle-like aggregates with
amyloid properties at intermediate detergent concen-
trations, where the peptides show dynamic properties,
particularly in the C-termini.
Results
Structural transitions of the Ab-peptide induced by
increasing concentrations of membrane-mimicking
detergents (SDS or LiDS) were studied by CD, NMR
and FTIR spectroscopy at temperatures in the range
3–25 °C. LiDS was used at low temperature measure-
ments because it has a higher solubility at lower tem-
peratures than SDS; however, the critical micellar
concentration is approximately the same for the two
detergents [12,13].
CD spectroscopy
Detergent titration experiments were performed on a
sample with 75 lm Ab(1–40) peptide in 10 mm sodium
phosphate buffer at 3 °C and 20 °C and pH 7.2. The
structural starting point for Ab(1–40) varies to some
extent as a function of temperature. At 3 °C, the
secondary structure includes contributions from a poly-
proline II (ppII) helix, whereas, at 20 °C, the second-
ary structure is almost exclusively random coil, as
described previously [5].
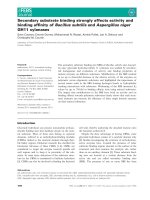
Figure 1A shows the titration of the Ab(1–40) pep-
tide with microvolumes of LiDS at 3 °C over a deter-
gent concentration interval in the range 0.05–20 mm,
corresponding to detergent⁄ peptide (D⁄ P) ratios of
0.7–267, respectively. The CD data report on a first
structural conversion from a mixture of ppII helix and
random coil (weak positive shoulder at approximately
220 nm and negative minimum at 198 nm) occurring
at low LiDS concentrations (up to 0.7 mm,D⁄ P=9)
to a signal appearing at 1.6 m m LiDS (D ⁄ P = 21)
with a maximum at 195 nm and a minimum at
218 nm, indicative of a dominating b-sheet structure.
It should be noted that, up to this titration point, the
spectra show a relatively well defined isodichroic point,
implying a two-state transition between the initial
structure and the b-sheet structure. After increasing
the LiDS concentration further (3.0 mm LiDS,
D ⁄ P = 40), a new state is observed, mostly consisting
of a-helix structure. The conversion to a-helix struc-
ture reached its final state at 20 mm LiDS with a char-
acteristic maximum and two minima at 193 and
208 ⁄ 222 nm, respectively.
Figure 1B shows the SDS titration experiment at
20 °C. In the absence of SDS, Ab(1–40) gives a CD
spectrum with a minimum at 198 nm, indicating a pre-
dominantly random coil secondary structure. As the
detergent concentration was increased, the CD signal
disappeared in the wavelength region around 198 nm
(SDS concentration of approximately 4 mm,
D ⁄ P = 53). Further increase of the SDS concentration
(up to 5 mm,D⁄ P = 67) yielded a b-sheet spectrum
with a positive maximum at 194 nm and a negative
minimum at 218 nm. Also at this temperature, there
was a relatively well-defined isodichroic point in the
titration; however, this was not as clear as in the 3 °C
titration. At high SDS concentrations (above 10 mm
SDS, D ⁄ P = 133), the secondary structure was mainly
a-helix, with a characteristic maximum at 192 nm and
two minima at 208 and 221 nm.
The mean residual molar ellipticity at 195 nm as a
function of detergent concentration at 3 °C and 20 °C
is shown in Fig. 1C. The disappearance of an initial
weakly structured state and conversion to b-sheet and
then to a-helix are evident. The CD intensities at this
wavelength allowed us to compare the detergent
secondary structure induction at 3 °C and 20 °C
(Fig. 1C). Only one transition was visible with a mid-
point at 1 mm LiDS at 3 °C. At 20 °C and with SDS,
three transitions could be distinguished. The first had a
midpoint at 0.7 mm, followed by two more transitions,
with midpoints at 2.1 and 4.6 mm SDS.
Figure 1D shows the corresponding curves for the
mean residual ellipticity at 208 nm as function of
detergent concentration. At 3 °C with LiDS, the data
show two sigmoidal transitions. The first sigmoidal
transition (positive) occurred in the range 0–1.6 mm
Detergent-induced Ab(1–40) secondary structures A. Wahlstro
¨
m et al.
5118 FEBS Journal 275 (2008) 5117–5128 ª 2008 The Authors Journal compilation ª 2008 FEBS
LiDS with a midpoint at 0.7 mm, corresponding to the
transition from initial structure to the structure domi-
nated by b-sheet. The second sigmoidal transition (neg-
ative) had a midpoint at 2.6 mm. We interpret this as
corresponding to the transition from b-sheet to a-helix.
In the SDS titration at 20 °C, the intensity at 208 nm
again indicated three sigmoidal transitions. Two posi-
tive transitions had midpoints at 0.9 and 2 mm, respec-
tively, and the third (negative) had a midpoint at
6mm. It should be noted that three transitions are
visible at 20 °C at both wavelengths studied, and that
the SDS concentration midpoints are in approximate
agreement: the first transition at approximately 0.8 mm
SDS (D ⁄ P = 11), the second one at approximately
2mm SDS (D ⁄ P = 27) and the third one at
approximately 5 mm SDS (D ⁄ P = 67). The third
transition probably involves the formation of the
partly a-helical state, whereas the two first may involve
two similar but distinguishable states with b-sheet
structures.
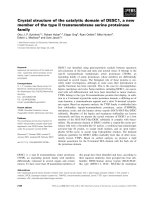
Fig. 1. Circular dichroism spectra of 75 lM Ab(1–40) peptide in 10 mM phosphate buffer at pH 7.2 in the presence of different concentra-
tions of detergent. (A) At 3 °C in LiDS: open square, buffer; open circle, 0.05 m
M; open triangle, 0.1 mM; filled square, 0.3 mM; open
diamond, 0.5 m
M; filled circle, 0.7 mM; filled hexagon, 1.0 mM; open hexagon, 1.3 mM; open star, 1.6 mM; cross, 2.0 mM; filled star,
3.0 m
M; open pentagon, 20 mM. (B) At 20 °C in SDS: open square, buffer; open circle, 0.1 mM; filled star, 0.8 mM; open triangle, 2.0 mM;
open pentagon, 3.8 m
M; filled square, 4.2 mM; open diamond, 4.3 mM; filled circle, 5.0 mM; filled triangle, 6.2 mM; open hexagon, 7.0 mM;
open star, 12.2 m
M. (C) Plot of the mean residual molar ellipticity at 195 nm for the experiment in LiDS at 3 °C (filled square) and for the
experiment in SDS at 20 °C (open circle). (D) Plot of the mean residual molar ellipticity at 208 nm for the experiment in LiDS at 3 °C (filled
square) and for the experiment in SDS at 20 °C (open circle).
A. Wahlstro
¨
m et al. Detergent-induced Ab(1–40) secondary structures
FEBS Journal 275 (2008) 5117–5128 ª 2008 The Authors Journal compilation ª 2008 FEBS 5119
NMR spectroscopy
Heteronuclear single quantum coherence (HSQC) and
transverse relaxation optimized spectroscopy (TROSY)
NMR spectroscopy were used to follow the structural
transitions of the Ab(1–40) peptide (75 lm) induced by
increasing concentrations of the membrane-mimicking
detergent LiDS. The
1
H-
15
N HSQC spectrum of
uniformly
15
N-labeled Ab(1–40) in 10 mm phosphate
buffer (pH 7.2, 3 °C) at the beginning of a titration is
shown in Fig. 2 (left). The corresponding spectrum of
the peptide in 128 mm LiDS at the end of a titration is
also shown in Fig. 2 (right, green spectrum). There are
significant chemical shift differences in comparison to
the initial state. Figure 2 (right) also includes the
HSQC spectrum of the peptide after direct addition of
150 mm LiDS at 3 °C (red spectrum). The two spectra
shown in Fig. 2 (right) were found to overlap very well
with one another. However, the intensities (when
corrected for different peptide concentrations) were
significantly smaller in the spectrum after titration.
Assignments of the amide groups of Ab(1–40) in
buffer (Table S1) were made by comparison with the
previous assignment [14]. Assignment of Ab(1–40) in
150 mm LiDS at 3 °C (Table S1) was performed by
starting the NMR experiment at 25 °C where assign-
ments are known [8] and decreasing the temperature
by 5 °C at a time following the gradual changes of the
HSQC spectra. The similarity of chemical shift
patterns at 3 °C and 25 °C suggests that the previously
determined a-helical regions involving residues 15–24
and 29–35 are the same at the two temperatures after
direct addition of a high concentration of detergent [8].
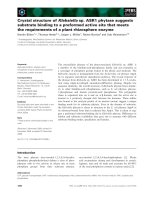
Between the two well defined states shown in Fig. 2
(i.e. at an intermediate detergent concentration), a new
state of the peptide characterized by complete NMR
signal loss was observed. This state occurred at a criti-
cal concentration of LiDS of 1–2 mm, corresponding
to D ⁄ P = 13–27.
There was no obvious change in chemical shifts, nor
linewidth, of the amide HSQC crosspeaks by the grad-
ual titration with detergent below the concentration
inducing signal loss. To study how the signal was influ-
enced by an increasing concentration of detergent, the
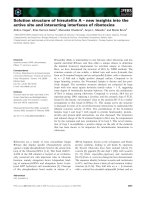
volume of each crosspeak was integrated. In a titration
series with small titration steps (0.05, 0.1, 0.2, 0.3, 0.5,
0.7, 1, 2, 10 and 20 mm), most of the signals were
unchanged or slowly decayed up to a LiDS concentra-
tion of 0.5 mm. However, beyond 0.5 mm LiDS, the
signal from every residue abruptly decreased (Fig. 3).
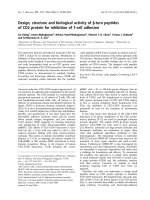
Fig. 2. HSQC NMR spectra and assignment of amide crosspeaks for the Ab(1–40) peptide, and the effect of added lithium dodecyl sulfate.
Left:
1
H-
15
N HSQC spectrum of 75 lM uniformly
15
N-labeled Ab(1–40) in 10 mM phosphate buffer. The two peaks (V39 and V40) found in
the TROSY experiment with 75 l
M
15
N-Ab(1–40) in the presence of 2 mM LiDS are indicated with arrows. Right: overlay of HSQC spectra;
75 l
M
15
N-labeled Ab(1–40) in 128 mM of LiDS (i.e. the end point in the titration series 0, 0.5, 1, 4, 8, 16, 32, 64 and 128 mM LiDS) (green
spectrum) and 300 l
M
15
N-labeled Ab(1–40) in 150 mM of LiDS, added in one addition (red spectrum). The peak intensities are corrected in
relation to the different peptide concentrations. All measurements were performed in 10 m
M phosphate buffer at pH 7.2 and 3 °C.
Detergent-induced Ab(1–40) secondary structures A. Wahlstro
¨
m et al.
5120 FEBS Journal 275 (2008) 5117–5128 ª 2008 The Authors Journal compilation ª 2008 FEBS
At 1 mm LiDS, corresponding to D ⁄ P = 13, almost
all the HSQC crosspeaks had disappeared and, at
2mm, all were lost. At LiDS concentrations of 10 and
20 mm, the crosspeaks reappeared, directly with chemi-
cal shifts closely corresponding to those observed after
direct addition of 150 mm LiDS (Fig. 2, right, red
spectrum).
The crosspeaks from the amide groups in the amino
acid residues in the N- and C-terminal ends returned
with the strongest signals upon titration with detergent
(Fig. 3). This is probably due to an increased mobility
in the N- and C-terminal end segments (i.e. residues
up to G9 and beyond G37). The chemical shifts
observed at detergent concentrations of 10 and 20 mm
were retained in the presence of the higher LiDS con-
centrations of 64 and 128 mm, which all coincide with
the chemical shifts found at 150 mm LiDS (Fig. 2).
The disappearance of all NMR peaks at detergent
concentrations of 1–2 mm may have more than one
explanation. An obvious reason for signal loss is that
Fig. 3. The crosspeak signal intensity of assigned residues of
15
N-labeled Ab(1–40) in the
1
H-
15
N HSQC spectra as a function of LiDS con-
centration (0, 0.05, 0.1, 0.2, 0.3, 0.5, 0.7, 1, 2, 10, 20 and 128 m
M) at pH 7.2 and 3 °C. The volumes of the HSQC crosspeaks of 75 lM of
15
N-Ab(1–40) were integrated. The amino acids are divided into different figures according to the earlier findings indicating that residues
15–24 and 29–35 have a-helical structure, whereas the regions in the ends and in between are unstructured [8]. The x-axis (LiDS concentra-
tion) is shown as a logarithmic scale.
A. Wahlstro
¨
m et al. Detergent-induced Ab(1–40) secondary structures
FEBS Journal 275 (2008) 5117–5128 ª 2008 The Authors Journal compilation ª 2008 FEBS 5121
large, probably heterogeneous, aggregates of peptide
and detergent are formed. Exchange on an intermedi-
ate time scale between aggregates of different sizes
may also contribute. To study this state further, TRO-
SY experiments and translational diffusion NMR
experiments were performed. TROSY makes it possi-
ble to study larger proteins or complexes because it
reduces transverse relaxation rates [15]. In the TROSY
spectrum in the presence of 2 mm LiDS (i.e. at the
same conditions where all HSQC signals disappeared),
two C-terminal residues were observable (V39 and
V40) (Fig. 2, left). This observation suggests a higher
mobility of the charged carboxy terminus of Ab(1–40)
in the aggregated state.
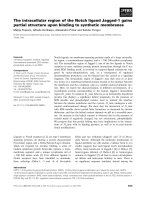
NMR translational diffusion experiments were per-
formed to investigate whether NMR-visible complexes
of different sizes could be observed during the deter-
gent titration. The results (Fig. 4) revealed a diffusion
coefficient of 1.29 · 10
)10
m
2
Æs
)1
for Ab(1–40) in D
2
O
buffer (pH 7.4, 25 °C), indicating that the observable
peptide is monomeric [4]. The diffusion coefficient did
not change significantly from this value in the presence
of 0.1, 0.5 and 1 mm deuterated SDS (SDS-d
25
). The
NMR signal disappeared abruptly at 2 mm SDS-d
25
,
and a diffusion coefficient could not be determined for
this condition. At 5 mm, the resonances had reap-
peared in the ‘new’ positions and the associated
diffusion coefficient had decreased. This implies forma-
tion of an assembly of peptides, probably also in
complex with detergent molecules (Fig. 4). At the same
time, some fibrils could be seen in the sample solution.
The diffusion coefficient for Ab(1–40) in the presence
of 10 mm SDS-d
25
was 0.85 · 10
)10
m
2
Æs
)1
, which can
be compared with the diffusion coefficient 0.48 · 10
)10
m
2
Æs
)1
for 100 lm Ab(1–40) in directly added 150 mm
SDS, which comprises a state when one peptide is
bound to one micelle [8].
FTIR spectroscopy
FTIR spectroscopy was used to obtain further infor-
mation about the striking changes in the secondary
structure of Ab(1–40) observed at concentrations in
the range of 0–4 mm SDS or LiDS. The amide I¢
region in the IR spectrum is indicative for the second-
ary structure of the peptide. It has been shown that
Ab(1–40) has a strong secondary structure concentra-
tion dependence [16]. To increase the signal-to-noise
ratio and to eliminate contributions of the baseline
drift, the concentration of peptide was as low as possi-
ble (100 lm), and only slightly higher than the CD and
NMR concentrations. The negative second derivative
of the spectra in the amide I¢ band is shown in Fig. 5.
Assignment of different secondary structures was
performed according to Byler and Susi [17]. The
spectra indicate that, at 20 °C, the peptide had a
mixture of random coil and b-sheet secondary struc-
ture in the absence of SDS and with SDS at a low
D ⁄ P ratio of 1 (0.1 mm SDS). At 1.4 mm, the random
coil contribution disappeared, the b-sheet contribution
decreased and a-helix structure became evident. At a
Fig. 4. The translational diffusion coefficient (D
t
)of75lM Ab(1–40)
versus increasing SDS-d
25
concentration (0, 0.1, 0.5, 1, 5 and
10 m
M). The experiment was performed in 10 mM phosphate
buffer at 25 °C and pH 7.4.
, diffusion coefficient for 100 lM
Ab(1–40) in 150 mM SDS at 25 °C [8]. The gray box indicates the
conditions for which a diffusion coefficient could not be determined
due to signal loss.
Fig. 5. Secondary structure induction by SDS of 100 lM Ab(1–40)
in 10 m
M phosphate buffer at pH 7.2 and 20 °C. The negative
second derivative of the peptide in the presence of different SDS
concentrations is shown: thick black line, 0 m
M; thin black line,
0.1 m
M; gray line, 1.4 mM; light gray line, 10 mM. The spectra were
normalized for trifluoroacetic acid intensity (as indicated by an aster-
isk). The wavenumber intervals corresponding to the specific
secondary structures are also indicated.
Detergent-induced Ab(1–40) secondary structures A. Wahlstro
¨
m et al.
5122 FEBS Journal 275 (2008) 5117–5128 ª 2008 The Authors Journal compilation ª 2008 FEBS
high SDS concentration (10 mm), the peptide showed
a predominantly a-helix structure, with a shoulder in
the b-sheet region.
ThT interactions
The titration of 75 lm Ab(1–40) with increasing
amounts of SDS at 20 °C was monitored by ThT
(15 lm) fluorescence, a classical probe for aggregated
amyloid material [18]. Figure 6 shows a titration curve
yielding maximum ThT fluorescence (approximately
8 · initial intensity) at 2.2 mm SDS. Further addition
of SDS decreased the fluorescence intensity to approxi-
mately 3 · initial intensity (at 45 mm SDS). The lack
of complete reversal of ThT fluorescence indicates the
presence of some remaining amyloid-like material also
at higher SDS concentrations, although most of the
aggregation appears to have been reversed. As a
control, an SDS titration of ThT in the absence of
Ab(1–40) was also performed (Fig. 6). This experiment
showed that ThT fluorescence is generally low com-
pared to the results in the presence of the peptide.
However, also in the absence of peptide, ThT fluores-
cence under SDS titration follows a sigmoid curve,
with a midpoint at approximately 2 mm. This behav-
iour of ThT is in general agreement with previous
results obtained for ThT interacting with anionic
micelles [19]. To further characterize the state of the
Ab(1–40) during the SDS titration, five representative
SDS titration points were chosen (0, 1.1, 2.2, 4.6 and
25.5 mm SDS) for investigation by native-PAGE
(Fig. S1). A preliminary qualitative assessment of the
gels could be performed with respect to the presence of
low and high molecular weight species in the different
samples [20]. Whereas the 0 and 25.5 mm SDS samples
had a relatively high population of low molecular
weight species (presumably peptide monomers), the
samples prepared with intermediate SDS concentra-
tions showed mainly high molecular weight (aggre-
gated) peptide species.
Discussion
By combining CD, NMR and FTIR experiments, we
have shown that the aggregation process of Ab(1–40)
induced by LiDS or SDS detergent gives rise to a
variety of secondary structure states, each of which is
relatively stable under its given conditions. It is
demonstrated that the extreme variability of the
secondary structure of the peptide is dependent on its
environment.
The CD results reveal that, in a dilute aqueous solu-
tion, Ab(1–40) has a dominating random coil second-
ary structure with a low contribution of ppII helix and
b-sheet at low temperature. Titrations with SDS or
LiDS show that a secondary structure conversion of
Ab(1–40) can be described essentially as a two-state
process, involving conversion of the initial weak struc-
ture to b-sheet-rich structures. Continued addition of
SDS or LiDS, reaching concentrations close to the
critical micellar concentration, induces rearrangement
of the peptide structure to a structure with a-helix con-
tributions.
The NMR results at 3 °C show that the Ab(1–40)
peptide retains its random coil ⁄ ppII structure free in
solution in the presence of low detergent concentra-
tions in the range 0.05–0.5 mm. At a detergent concen-
tration of 1–2 mm, on the other hand, the NMR signal
is essentially lost and the results suggest peptide aggre-
gation and possibly intermediate chemical exchange.
Preliminary light absorption observations (data not
shown) suggest considerable light scattering under
these conditions, in agreement with the formation of
large particles.
A high molecular weight state induced by submi-
cellar concentrations of detergent was also recently
observed by Tew et al. [11] using CD and NMR. They
observed that the 1D
1
H-NMR spectrum disappeared
at a certain SDS concentration but showed up again at
SDS concentrations above the critical micellar concen-
tration. In the present study, we aimed to analyze the
aggregated state further after assignment of the amide
Fig. 6. SDS titration monitored by ThT fluorescence. SDS titrations
in the absence of peptide (open squares) and in the presence of
75 l
M Ab(1–40) (open and filled circles) showing the fluorescence
changes of 15 l
M ThT in 10 mM phosphate buffer at pH 7.3 and
20 °C. The SDS concentrations are: 0, 0.09, 0.4, 0.6, 1.1, 1.7, 2.2,
2.8, 4.6, 6.5, 8.4, 10.3, 14.1, 17.9, 25.5 and 45 m
M. Full circles indi-
cate the concentrations analyzed by native-PAGE (see Supporting
information, Fig. S1).
A. Wahlstro
¨
m et al. Detergent-induced Ab(1–40) secondary structures
FEBS Journal 275 (2008) 5117–5128 ª 2008 The Authors Journal compilation ª 2008 FEBS 5123
HSQC crosspeaks. We were able to follow the
intensity changes for the individual amino acids at
increasing LiDS concentrations. We conclude that the
signals only partly recover towards high detergent
concentrations. At and above the critical micellar
concentration, the recovered spectrum displays amide
chemical shifts very similar to those seen in a sample
after direct addition of a high concentration of deter-
gent. The amide groups of N- and C-terminal residues
return to visibility with the strongest signal intensities,
implying higher mobility at the peptide terminus. This
observation is also strengthened by the TROSY mea-
surement showing weak amide crosspeaks from V39
and V40 at conditions where no peaks are visible in
the HSQC experiment. Under the same conditions
with high detergent concentrations, the CD spectra
provide evidence of significant a-helix formation.
The a-helical state of Ab(1–40) in SDS micelles has
been characterized previously by NMR. It was found
to consist of two a-helical segments, involving residues
15–24 and 29–35, respectively, of which the C-terminal
helix is inserted into the micelle [8]. It is interesting to
compare this structure with two earlier proposals of
full length Ab structures. (1) In complex with an affi-
body protein, Ab(1–40) forms a hairpin between resi-
dues 17–36, where residues 24–29 apparently form the
loop connecting the two b strands [21]. (2) A model
based on solid state and solution state NMR for a
fibril formed by Ab(1–42) showed a parallel ⁄ in-register
b-sheet arrangement between residues 18–26 and 31–42
[22]. Obviously, there are two segments of Ab [approx-
imately 16–25 and 30–36 ⁄ 42 in Ab(1–40) and
Ab(1–42), respectively] that are prone to form stable
hydrogen bonds. We hypothesize that these segments
therefore easily form secondary structures; with
affibodies or in fibrils, they may form a b-sheet and,
with dodecyl sulfate, they may form a-helices.
The NMR diffusion measurements revealed that, up
to a detergent concentration of 1 mm,Ab(1–40) is
monomeric and then a state follows that cannot be
characterized by diffusion NMR, but probably
involves large aggregates. Continued titration with
SDS, reaching a concentration of 5–10 mm, induces
micelle-like formations, which appear to have a more
rapid translational diffusion than the better defined
state at an SDS concentration of 150 mm, when one
peptide is associated with one micelle of normal SDS
micellar size [8].
FTIR spectroscopy indicates the presence of some
b-sheet structure in addition to random coil when
Ab(1–40) is dissolved in dilute aqueous buffer. The
NMR and CD measurements report mainly random
coil under similar conditions. This is despite the careful
procedures performed when preparing the peptide
solutions as described in the Experimental procedures.
A possible explanation for this discrepancy is the exis-
tence of small amounts of very large aggregates, or
seeds, in the sample, which remain in the sample prep-
aration and are not detectable by NMR or CD. At
1.4 mm SDS (D⁄ P = 14), the IR band indicating a
b-sheet is transformed into two shoulders, which might
represent the seeds and the b-sheet containing com-
plexes of Ab(1–40) and detergent molecules, respec-
tively. These observations emphasize the problems
encountered in spectroscopic studies with respect to an
aggregating peptide displaying heterogeneous proper-
ties. Different techniques visualize different compo-
nents of the sample, even when great care has been
taken to ensure that the same (or very similar) state of
the sample is investigated in all experiments.
The ThT and electrophoresis experiments provide
further evidence of an aggregated and amyloid-like
state of Ab(1–40) at SDS concentrations of approxi-
mately 2 mm. Obviously, these properties are not fully
reversed when the titration continues towards higher
concentrations of SDS, above the critical micellar
concentration.
The
b-sheet containing aggregates of Ab(1–40) and
detergent formed at a detergent concentration of
1–2 mm (corresponding to detergent ⁄ peptide ratios of
13–27) may have different hypothetical arrangements.
The sample is not homogeneous in this state, as is
evident from the ThT and native-PAGE experiments
(Fig. 6; see also Fig. S1). The potential occurrence of
chemical exchange between aggregates characterized by
different structures and sizes, with intermediate kinet-
ics, contributes to making NMR characterization diffi-
cult. The kinetic exchange effects may in fact be the
major reason for the loss of NMR signal intensity
towards high SDS concentrations in the titration experi-
ments, where only one fraction of the sample is NMR
visible (i.e. the fraction where detergent micelles solubi-
lize individual peptides and induce partial a-helical sec-
ondary structure). The major fraction of the peptide
molecules remains NMR invisible, suggesting that the
aggregates are only partly dissolved after the titration.
The situation may be compared to that of a partly-
folded molten globule structure of a protein like a-lact-
albumin [23]. In that case, the collapse of a core region
of partly-folded protein structure gave rise to extreme
NMR line broadening due to chemical exchange,
whereas completely unfolded protein structures
allowed NMR observations. However, the experiments
performed in the present study do not allow us to defi-
nitely decide whether there are one or more reasons
for the NMR line broadening during the SDS
Detergent-induced Ab(1–40) secondary structures A. Wahlstro
¨
m et al.
5124 FEBS Journal 275 (2008) 5117–5128 ª 2008 The Authors Journal compilation ª 2008 FEBS
titration. By contrast to the a-lactalbumin molten
globule study, where the overall molecular weight is
constant, there is both increased molecular weight in
the aggregates and heterogeneity in the present study.
Both effects may contribute to the loss of NMR
signals.
In one hypothetic structural scenario, the aggregates
are constituted by micelle-like oligomers of Ab(1–40)
peptide surrounded by detergent molecules. b-sheet
structures would be induced by peptides interacting
with other peptides. In this model, the complete loss of
structure and higher mobility of the C-terminus of the
peptide may be due to its positioning in a hydrophobic
interior of the structure (analogous to the hydrophobic
interior of a lipid bilayer). In another structural sce-
nario, the aggregate is formed by assembled Ab(1–40)
peptides, where each peptide is embedded by detergent
molecules. Presumably, this model is less likely because
it seems improbable that a b-structure should be
induced in a peptide surrounded by detergent mole-
cules.
The detailed molecular properties of the aggregated
complex may represent the state of the peptide when it
aggregates at a crowded cell membrane surface. In
turn, this situation may reflect the state of a peptide
that is closely related to the oligomeric toxic species
thought to be involved in the pathology of Alzheimer’s
disease [3]. It is interesting to note that similar aggre-
gation ⁄ solubilization effects of anionic detergents have
also been described for other molecules, including
chlorin p
6
, a natural porphyrin compound [24], other
membrane interacting short peptides, such as dynor-
phin neuropeptides [25] and antimicrobial peptides
[26], or the intrinsically disordered protein a-synuclein
implicated in misfolding and fibril formation in
Parkinson’s disease [27].
Experimental procedures
Materials
Ab(1–40) used in the CD measurements was produced by
Neosystem Laboratoire (Strasbourg, France). The peptides
studied were unmodified at the N- and C-termini. It is
known that, in physiological preparations, both non-modi-
fied and C-terminally amidated forms of the peptide are
found. For NMR HSQC and TROSY measurements,
uniformly
15
N-labeled Ab(1–40) from Alexo-Tech AB
(Umea
˚
, Sweden) was used. In the diffusion NMR study,
unlabeled Ab (1–40) was obtained from rPeptide (Athens,
GA, USA). The peptides were used without further purifi-
cation. SDS was purchased from ICN Biomedicals Inc.
(Irvine, CA, USA), LiDS was from Sigma (Stockholm,
Sweden) and deuterated SDS-d
25
was obtained from Cam-
bridge Isotope Laboratories (Andover, MA, USA).
Preparation of the peptide
CD
To remove aggregation seeds in the sample, the peptide was
dissolved in HFiP for 1 h, followed by freezing and lyophi-
lizing. The lyophilized peptide was dissolved in 10 mm
NaOH, 4 mgÆmL
)1
, and sonicated in water bath for 1 min.
NMR
The peptide was stored at –18 °C and thawed before use. In
the titration experiments, the concentration of the peptide
was 75 lm, which was determined by weight. When prepar-
ing the sample, a previously described protocol was used [6].
NaOH (10 mm) was added to the peptide yielding a concen-
tration of 2 mgÆmL
)1
and the sample was sonicated in ice
bath for 1 min. Cold distilled water and D
2
O (10% of D
2
O
was added for signal locking) were added to half the final
sample volume and, again, the sample was sonicated for
1 min. Sodium phosphate buffer (20 mm) was added to reach
the final sample volume. The peptide concentration in the
assignment experiment was 300 lm and, for that reason, the
peptide was dissolved directly in LiDS in distilled water to
avoid aggregation. After sonication in an ice bath, D
2
O was
added and, after another sonication, 20 mm sodium phos-
phate buffer was added. For all experiments, the pH was
adjusted to 7.2 by adding small amounts of NaH
2
PO
4
and
Na
2
HPO
4
using the pH meter Orion PerpHecT LogR meter
(San Diego, CA, USA). All sample preparations were
performed on ice. For diffusion NMR measurements, the
peptide was dissolved as described, but at pH 7.4.
FTIR
The sample was prepared in the same way as for the CD
experiments but using deuterated reagents.
Preparation of detergent solution
The 200 mm SDS solution was prepared in 10 mm sodium
phosphate buffer (pH 7.3) or 10 mm Tris–HCl buffer
(pH 7.3). LiDS was dissolved in 20 mm of sodium phos-
phate buffer and two stock solutions (50 and 500 mm) were
made to minimize the dilution effects. SDS-d
25
was dis-
solved in D
2
O and two stock solutions were used (10 mm
and 100 mm).
CD spectroscopy
CD spectra were recorded at 3 °C and 20 °C in LiDS and
SDS, respectively, and for different titration steps in deter-
A. Wahlstro
¨
m et al. Detergent-induced Ab(1–40) secondary structures
FEBS Journal 275 (2008) 5117–5128 ª 2008 The Authors Journal compilation ª 2008 FEBS 5125
gent at concentrations in the range 0.05–20 mm. The spec-
tral region was recorded from 190–250 nm, with a 0.2 nm
step resolution, on a Jasco J-720 CD spectropolarimeter
(Jasco Inc., Easton, MD, USA) equipped with a PTC-343
temperature controller using quartz cells of 1.0 mm optical
path length. At 20 °C, the scanning speed was 100 nmÆ
min
)1
and the spectra were collected and averaged over 20
scans. At 3 °C, a scanning speed of 50 nmÆmin
)1
was used
and ten scans were employed. The background signals
were subtracted from the CD spectra of the peptides. The
peptide concentration was 75 lm in all experiments. The
same peptide sample was used in one titration series.
NMR spectroscopy
The NMR measurements were used to follow the structural
changes in the Ab(1–40) peptide caused by LiDS titration.
Experiments were performed on a Varian Inova 600 MHz
spectrometer at 3 °C (Varian NMR, Inc., Palo Alto, CA,
USA).
1
H-
15
N HSQC experiments were acquired in
1
H
dimension in a 6 kHz window centered at 4.98 p.p.m. using
a 0.12 s acquisition time and eight scans. In the
15
N dimen-
sion, 256 increments were acquired in a 2.5 kHz window
centered at 118.5 p.p.m. These parameters were used also
in the assignment experiment and, after every temperature
change of 5 ° C, the sample equilibrated for at least 20 min
before the next run. The TROSY experiment was per-
formed to study the state characterized by NMR signal loss
in the HSQC spectra. The same parameters as for HSQC
were used and 96 scans were averaged. Solvent suppression
was performed with excitation sculpting. NMR data pro-
cessing and integration of peak volume were performed in
Varian vnmr software, whereas the spectra were presented
using sparky [28]. The diffusion experiments were per-
formed with the pulsed field gradient spin-echo experiment
(pulsed field gradient longitudinal eddy–current delay) with
the 600 MHz Varian Inova spectrometer, which is equipped
with a z-axis gradient coil. Thirty different linearly spaced
gradient strengths were used with a delay between the
gradient pulses of 150 ms and a gradient length of 2 ms.
Calibration of the pulsed field gradients was performed by
means of a standard sample, 1% H
2
OinD
2
O and
1mgÆmL
)1
GdCl
3
, and the knowledge that the
diffusion coefficient of HDO in D
2
Oat25°C is 1.90 · 10
)9
m
2
Æs
)1
[29].
FTIR spectroscopy
FTIR spectra were collected in a Bruker Tensor 37 spec-
trometer (Bruker, Ettlingen, Germany) at 20 °C with a
4cm
)1
spectral resolution. Three series of 100 scans each
were acquired and averaged, and the second derivative was
performed with nine smoothing points using opus software
(Bruker). For clarity of the results, the negative second
derivative of the spectra normalized for the trifluoroacetic
acid band (approximately 1675 cm
)1
) is shown. To improve
signal-to-noise ratios, the peptide concentration was
100 lm.
ThT and native–PAGE experiments
For ThT measurements, the final ThT concentration was
kept at 15 lm for all samples (10 mm sodium phosphate
buffer, pH 7.3, 20 °C). SDS titrations were performed
both in the absence and presence of peptide (75 lm).
Samples were excited at 450 nm (1 nm slit width) and
single wavelength emission measurements at 483 nm
(1 nm slit width) were performed in a Jobin-Yvon Flu-
oroMax spectrofluorometer (HORIBA Jobin-Yvon Inc.,
Edison, NJ, USA). Titrations were carried out in the
same way as for the CD experiments. During the SDS
titration in the presence of peptide, aliquots were sampled
at 0, 1.1, 2.2, 4.6 and 25.5 mm of SDS. These aliquots
were analyzed in a 10–20% Tris–HCl native-PAGE
(gel ran for 3 h) and subsequent silver staining was per-
formed using a silver staining kit (Bio-Rad, Hercules,
CA, USA).
Acknowledgements
We thank Andreas Barth for generous access to the
FTIR spectrometer, and L. E. Go
¨
ran Eriksson for
helpful discussions. We thank Torbjo
¨
rn Astlind for
technical help with the NMR experiments. This study
was supported by the Swedish Research Council and
by the Catalan Government postdoctoral fellowship
‘Beatriu de Pino
´
s’ (2005 BP-A 10085 to A.P M.).
Further support was obtained from the European
Commission (contract LSHG-CT-2004-512052), the
Carl Trygger Foundation, the Marianne and Marcus
Wallenberg Foundation and the Swedish Foundation
for Strategic Research (Bio-X).
References
1 Hardy J & Selkoe DJ (2002) The amyloid hypothesis of
Alzheimer’s disease: progress and problems on the road
to therapeutics. Science 297, 353–356.
2 Wilquet V & De Strooper B (2004) Amyloid-beta
precursor protein processing in neurodegeneration. Curr
Opin Neurobiol 14 , 582–588.
3 Haass C & Selkoe DJ (2007) Soluble protein
oligomers in neurodegeneration: lessons from the
Alzheimer’s amyloid b-peptide. Nat Rev Mol Cell Biol
8, 101–112.
4 Danielsson J, Jarvet J, Damberg P & Gra
¨
slund A
(2002) Translational diffusion measured by PFG-NMR
on full length and fragments of the Alzheimer Ab(1-40)
peptide. Determination of hydrodynamic radii of
Detergent-induced Ab(1–40) secondary structures A. Wahlstro
¨
m et al.
5126 FEBS Journal 275 (2008) 5117–5128 ª 2008 The Authors Journal compilation ª 2008 FEBS
random coil peptides of varying length. Magn Reson
Chem 40, S89–S97.
5 Danielsson J, Jarvet J, Damberg P & Gra
¨
slund A
(2005) The Alzheimer b-peptide shows temperature-
dependent transitions between left-handed 3
1
-helix,
b-strand and random coil secondary structures. FEBS J
272, 3938–3949.
6 Hou L, Shao H, Zhang Y, Li H, Menon NK, Neuhaus
EB, Brewer JM, Byeon IJ, Ray DG, Vitek MP et al.
(2004) Solution NMR studies of the Ab(1-40) and
Ab(1-42) peptides establish that the Met35 oxidation
state affects the mechanism of amyloid formation. JAm
Chem Soc 126, 1992–2005.
7 Ma K, Clancy EL, Zhang Y, Ray DG, Wollenberg K
& Zagorski MG (1999) Residue-specific pK
a
measure-
ments of the b-peptide and mechanism of pH-induced
amyloid formation. J Am Chem Soc 121, 8698–8706.
8 Jarvet J, Danielsson J, Damberg P, Oleszczuk M &
Gra
¨
slund A (2007) Positioning of the Alzheimer Ab(1-
40) peptide in SDS micelles using NMR and paramag-
netic probes. J Biomol NMR 39, 63–72.
9 Terzi E, Ho
¨
lzemann G & Seelig J (1997) Interaction of
Alzheimer b-amyloid peptide(1-40) with lipid mem-
branes. Biochemistry 36, 14845–14852.
10 Rangachari V, Reed DK, Moore BD & Rosenberry TL
(2006) Secondary structure and interfacial aggregation
of amyloid-b(1-40) on sodium dodecyl sulfate micelles.
Biochemistry 45, 8639–8648.
11 Tew DJ, Bottomley SP, Smith DP, Ciccotosto GD,
Babon J, Hinds MG, Masters CL, Cappai R &
Barnham KJ (2008) Stabilization of neurotoxic soluble
b-sheet-rich conformations of the Alzheimer’s disease
amyloid-b peptide. Biophys J 94, 2752–2766.
12 Henry GD & Sykes BD (1994) Methods to study
membrane protein structure in solution. Methods
Enzymol 239, 515–535.
13 Mukerjee P, Mysels KJ & Kapauan P (1967) Counter-
ion specificity in the formation of ionic micelles – size,
hydration, and hydrophobic bonding effects. J Phys
Chem 71, 4166–4175.
14 Danielsson J, Andersson A, Jarvet J & Gra
¨
slund A
(2006)
15
N relaxation study of the amyloid b-peptide:
structural propensities and persistence length. Magn
Reson Chem 44, S114–S121.
15 Pervushin K, Riek R, Wider G & Wu
¨
thrich K (1997)
Attenuated T
2
relaxation by mutual cancellation of
dipole-dipole coupling and chemical shift anisotropy
indicates an avenue to NMR structures of very large
biological macromolecules in solution. Proc Natl Acad
Sci USA 94, 12366–12371.
16 Pa
¨
ivio
¨
A, Jarvet J, Gra
¨
slund A, Lannfelt L & Westlind-
Danielsson A (2004) Unique physicochemical profile of
b-amyloid peptide variant Ab1-40E22G protofibrils:
conceivable neuropathogen in arctic mutant carriers.
J Mol Biol 339, 145–159.
17 Byler DM & Susi H (1986) Examination of the second-
ary structure of proteins by deconvolved FTIR spectra.
Biopolymers 25, 469–487.
18 Khurana R, Coleman C, Ionescu-Zanetti C, Carter SA,
Krishna V, Grover RK, Roy R & Singh S (2005)
Mechanism of thioflavin T binding to amyloid fibrils.
J Struct Biol 151, 229–238.
19 Kumar S, Singh AK, Krishnamoorthy G &
Swaminathan R (2008) Thioflavin T displays enhanced
fluorescence selectively inside anionic micelles and
mammalian cells. J Fluoresc, doi: 10.1007/s10895-
008-0378-2.
20 Klug GM, Losic D, Subasinghe SS, Aguilar MI, Martin
LL & Small DH (2003) b-Amyloid protein oligomers
induced by metal ions and acid pH are distinct from
those generated by slow spontaneous ageing at neutral
pH. Eur J Biochem 270, 4282–4293.
21 Hoyer W, Gro
¨
nwall C, Jonsson A, Sta
˚
hl S & Ha
¨
rd T
(2008) Stabilization of a b-hairpin in monomeric
Alzheimer’s amyloid-b peptide inhibits
amyloid formation. Proc Natl Acad Sci USA 105,
5099–5104.
22 Lu
¨
hrs T, Ritter C, Adrian M, Riek-Loher D,
Bohrmann B, Do
¨
beli H, Schubert D & Riek R
(2005) 3D structure of Alzheimer’s amyloid-b(1-42)
fibrils. Proc Natl Acad Sci USA 102, 17342–17347.
23 Schulman BA, Kim PS, Dobson CM & Redfield C
(1997) A residue-specific NMR view of the non-cooper-
ative unfolding of a molten globule. Nat Struct Biol 4,
630–634.
24 Mishra PP, Bhatnagar J & Datta A (2005) The inter-
play of hydrophobic and electrostatic effects in the sur-
factant-induced aggregation ⁄ deaggregation of chlorin
p
6
. J Phys Chem B 109 , 24225–24230.
25 Hugonin L, Barth A, Gra
¨
slund A & Pera
´
lvarez-Marı
´
n
A (2008) Secondary structure transitions and aggrega-
tion induced in dynorphin neuropeptides by the deter-
gent sodium dodecyl sulfate. BBA – Biomembranes,
doi: 10.1016/j.bbamem.2008.07.011.
26 Wimmer R, Andersen KK, Vad B, Davidsen MØ, Møl-
gaard S, Nesgaard LW, Kristensen HH & Otzen DE
(2006) Versatile interactions of the antimicrobial peptide
novispirin with detergents and lipids. Biochemistry 45,
481–497.
27 Ahmad MF, Ramakrishna T, Raman B & Rao ChM
(2006) Fibrillogenic and non-fibrillogenic ensembles of
SDS-bound human a-synuclein. J Mol Biol 364, 1061–
1072.
28 Goddard TD & Kneller GD, Sparky3, University of
California, San Francisco, USA. f.
edu/home/sparky.
29 Damberg P, Jarvet J & Gra
¨
slund A (2001) Accurate
measurement of translational diffusion coefficients: a
practical method to account for nonlinear gradients.
J Magn Reson 148, 343–348.
A. Wahlstro
¨
m et al. Detergent-induced Ab(1–40) secondary structures
FEBS Journal 275 (2008) 5117–5128 ª 2008 The Authors Journal compilation ª 2008 FEBS 5127
Supporting information
The following supplementary material is available:
Fig. S1. Native-PAGE of 75 lm Ab(1–40) in the
presence of different concentrations of SDS: 0, 1.1,
2.2, 4.6 and 25.5 mm.
Table S1. Resonance assignments with chemical shifts
(p.p.m.) of amide crosspeaks for
15
N-labeled Ab(1–40)
under varying conditions in terms of solvent and
temperature.
This supplementary material can be found in the
online version of this article.
Please note: Wiley-Blackwell is not responsible for
the content or functionality of any supplementary
materials supplied by the authors. Any queries (other
than missing material) should be directed to the corre-
sponding author for the article.
Detergent-induced Ab(1–40) secondary structures A. Wahlstro
¨
m et al.
5128 FEBS Journal 275 (2008) 5117–5128 ª 2008 The Authors Journal compilation ª 2008 FEBS