The Rise and Fall of the U.S. Mortgage and Credit Markets: A Comprehensive Analysis of the Meltdown pot
Bạn đang xem bản rút gọn của tài liệu. Xem và tải ngay bản đầy đủ của tài liệu tại đây (980.06 KB, 51 trang )
The Rise and Fall of the
U.S. Mortgage and Credit Markets
A Comprehensive Analysis of the Meltdown
A full-length book version, published by John Wiley & Sons, will be available in spring 2009.
James R. Barth,
Tong Li, Wenling Lu,
Triphon Phumiwasana,
and Glenn Yago
b
The Rise and Fall of the U.S. Mortgage
and Credit Markets
A Comprehensive Analysis of the Meltdown
James R. Barth, Tong Li, Wenling Lu,
Triphon Phumiwasana, and Glenn Yago
January 2009
A full-length book version, published by John Wiley & Sons, will be available in spring 2009.
The Milken Institute is an independent economic think tank whose mission is to improve the lives and economic conditions
of diverse populations in the United States and around the world by helping business and public policy leaders identify and
implement innovative ideas for creating broad-based prosperity. We put research to work with the goal of revitalizing regions
and nding new ways to generate capital for people with original ideas.
By creating ways to spread the benets of human, nancial, and social capital to as many people as possible—
by democratizing capital—we hope to contribute to prosperity and freedom in all corners of the globe.
© 2009 Milken Institute
This report is excerpted from The Rise and Fall of the U.S. Mortgage and Credit Markets:
A Comprehensive Analysis of the Meltdown, published by John Wiley & Sons.
It oers a brief preview of the extensive data and analysis found in the full-length book.
This in-depth volume will provide a denitive recounting of the mortgage meltdown
and the ensuing nancial crisis, along with policy recommendations for moving forward.
The Rise and Fall of the U.S. Mortgage and Credit Markets: A Comprehensive Analysis of the
Meltdown will be available online and in bookstores in spring 2009.
Key Findings i
Policy Recommendations ii
Introduction 1
Overview of the Housing
and Mortgage Markets 5
Buildup and Meltdown of
the Mortgage and Credit Markets 8
What Went Wrong ? 16
So Far, Only Piecemeal Fixes 22
Where Should We Go From Here? 34
About the Authors 44
i
The total value of housing units in the United
States amounts to $19.3 trillion, with $10.6 trillion
in mortgage debt and the remaining $8.7 trillion
representing equity in those units as of June 2008.
Of the approximately 80 million houses in the
United States, 27 million are paid o, while the
remaining 53 million have mortgages. Of those
households with mortgages, 5 million (or 9 percent)
were behind in their payments and roughly 3
percent were in foreclosure as of mid-2008.
Securitization was a nancial innovation that
allowed the mortgage market to tap into a broader
base for funding. But the shift from an originate-to-
hold business model to an originate-to-distribute
model opened the door to excessively risky loans,
since originators and lenders could pass along risk
to other parties.
Fueled by low “teaser” rates, subprime home
mortgage originations increased dramatically, rising
from 8 percent in 2001 to 21 percent in 2005. Eighty
percent of these subprime loans were packaged
into mortgage-backed securities (MBS).
Investors relied perhaps too heavily on rating
agencies to provide information about the quality
of MBS. More than half of all MBS that were
rated investment grade from 2005 to 2007 were
eventually downgraded.
Financial regulators failed to act on numerous
warning signals that the housing market was
overheated. These signals should have triggered
regulatory actions to tighten overly loose credit
policies and to curtail the excessive use of leverage
throughout the nancial system.
The rate of foreclosures on subprime loans originated
increased each year from 1999 to 2007 and
accounted for approximately half of all foreclosures
over the same period.
As home prices plummeted and losses on loan
defaults rippled through the nancial system, the
markets were further rattled by the uncertainty
surrounding the unregulated market for credit
default swaps (CDS). The notional amount of CDS
increased from less than $1 trillion in 2001 to slightly
more than $62 trillion in 2007, before declining to
$47 trillion on October 31, 2008. The actual exposure
to losses is clearly smaller, but it remains to be seen
exactly how large the losses will be, which parties will
bear those losses, and whether those parties have
sucient capital to absorb them.
As of late November 2008, the federal government
has thus far committed some $7.5 trillion in loans,
guarantees, and other bailout funding to address
the credit crunch and liquidity freeze, and stabilize
the nancial system.
Key Findings
ii
U.S. banking and nancial regulation is currently
multilayered, overlapping, inconsistent, and costly.
This structure is in dire need of consolidation and
streamlining.
Regulators must develop the most appropriate mix
of private and governmental responses to the crisis,
taking moral hazard issues into account. Market
discipline must play a central role.
Debt-equity swaps can be a big help in reducing
leverage and rebuilding capital.
As regulation is reformed, more eort must be
channeled toward preventing crises rather than
implementing reforms after they occur. A greater
emphasis on liquidity, credit, and capital leverage
is needed, monitoring both on- and o-balance-
sheet assets.
Some have suggested covered bonds as an
alternative to securitizing mortgages. But covered
bonds should be viewed as a complement to, not a
substitute for, securitization. Improvements should
be made to provide greater leeway to modify
mortgage loans that have been securitized and to
provide greater recourse to originators and lenders.
The establishment of a formal exchange for
credit default swaps is an urgently needed step
to create greater transparency (and indeed, such
an eort is underway as of this writing). A central
clearinghouse can set up a fund to cover losses in
the event of a member rm default, employ mark-
to-market pricing on a daily basis, and liquidate
the positions of all members who cannot post
additional collateral, thereby reducing the risk
of a systemic crisis.
If the government is to continue promoting
homeownership, a new approach is needed. Several
innovative ideas merit consideration, including
shared equity programs, down payment assistance,
community land trusts, and lease-to-purchase
programs.
One of the possible steps to stemming the tide of
foreclosures is to modify the structure of Real Estate
Mortgage Investment Conduits (REMICs), giving
these entities new exibility and authority to modify
loan terms without legal liability to investors.
Policy Recommendations
1
Introduction
For generations, the mortgage market has eciently and successfully extended credit to millions of families,
enabling them to achieve the American dream of owning their own homes. Indeed, the homeownership rate
reached a record high of 69.2 percent in the second quarter of 2004. The growth of subprime mortgages that
contributed to this record, moreover, meant that many families or individuals deemed to be less creditworthy
were provided with greater opportunities to purchase homes.
Unfortunately, a system born of good intentions veered horribly o track, derailed by poor risk-management
practices, too many assets funded with too little owner-contributed equity, and lax regulatory oversight.
In the past, the vast majority of mortgages were more carefully vetted and extended on more stringent terms by
neighborhood savings and loans, institutions that originated, held, and serviced these loans throughout their
lifetimes. But in recent years, the mortgage industry increasingly moved toward securitization (that is, packaging
mortgages into securities and selling them into the secondary market, thereby shifting credit risk).
Figure 1: Value of housing units: How much has been borrowed,
who are the borrowers, and who funds them? (Q2 2008)
Equity in housing
units $8.7 trillion
Mortgage debt
$10.6 trillion
Total value of housing
units = $19.3 trillion
Prime
91.6%
Subprime
8.4%
Securitized
59%
Nonsecuritized
41%
Government-
controlled
46%
Private
sector-
controlled
54%
Sources: Federal Reserve, Milken Institute.
Note: The share of mortgage debt that is controlled by the government and by the private sector is based on Q3 2008 data.
2
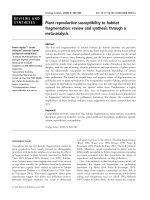
This sweeping change provided the mortgage industry with greater liquidity, helping to make new loans
accessible to more Americans at dierent levels of income than ever before. But by 2004, it was becoming ever
more apparent that credit was expanding too rapidly, on terms that were too loose. What began as healthy
growth in mortgage originations and housing starts swiftly became a home price bubble.
As home values kept escalating, many borrowers were unable to obtain loans on the basis of traditional
standards. Mortgage brokers and lenders were able to keep churning out seemingly protable mortgages
in such an environment by casting their nets even wider. Soon many loans were being written on such loose
terms that they made homes more aordable, at least initially, but were clearly unsustainable unless home
prices continued rising. Real estate agents and many of those originating mortgages earned fees by allowing
buyers with shaky credit histories and modest incomes to dive in and then passing the associated credit risk
on to others. In the reach for yield, many nancial institutions made questionable loans, while the regulatory
authorities failed to take steps to slow things down to a more normal pace.
Figure 2: The subprime share of home mortgages grows rapidly before the big decline
(1995–Q2 2008)
0
4
8
12
16
1995
1
9
9
6
1997
1998
1
9
9
9
2000
2
0
01
2002
2003
2
0
0
4
2005
2
0
06
20
0
7
Q1 2008
Q
2 2008
Percent
Q2 2008: 7.6%
1995: 8.7%
2005 peak: 13.5%
Subprime share of home mortgages outstanding
2003 low: 3.74%
One- year ARM rate
Sources: Inside Mortgage Finance, Federal Reserve, Milken Institute.
3
When home prices did come plunging back to earth, the outcome was much the same across the nation: too
many homeowners found themselves in way over their heads, and too many home builders found themselves
with an excess inventory of unsold homes.
But this is not solely a tale of home buyers who overreached and home builders who overbuilt. The damage
quickly spread far beyond the scope of the actual mortgage defaults and foreclosures.
Not only did nancial institutions suer losses on mortgages they held; so too did investors who bought
mortgage-backed securities in the secondary market. The mortgage-backed securities in essence became
another giant bubble, resting on the wobbly foundation of risky home loans. Investors from around the world
were clamoring for a piece of the action—after all, rating agencies, essentially blessed by the regulatory
authorities, handed out AAA ratings on many of the investment vehicles ultimately backed in whole or in part by
subprime mortgages. (Some observers have noted that these agencies are paid by the very parties who issued
the securities.) In addition, a large but unknown amount was soon at stake in the form of newer derivatives
known as credit default swaps that were issued on these types of securities.
From Main Street to Wall Street, one common thread runs through all facets of this story: excessive leverage.
Homeowners and major nancial rms alike had assumed too much debt while at the same time taking on
too much risk.
As of this writing, the U.S. economy is engaged in a massive wave of deleveraging, a scramble to reduce debt
and obtain new capital from any willing source. Even solid companies with no direct connection to the real
estate and nance sectors have been aected as credit markets seized up, liquidity became scarce, and a ight to
safety ensued.
From Main Street to Wall Street,
one common thread runs through all
facets of this story: excessive leverage.
4
In many cases, the government has now become the
buyer of last, if not rst, resort, intervening in the market in
ways not seen since the New Deal. As the nancial sector
lurched from crisis to crisis in 2008, the government’s
response has been marked by an improvisational quality
that has thus far failed to restore full condence in the
nancial system and reduce credit spreads.
The sheer size of the bailout, with $7.5 trillion or more
committed in capital injections and various guarantees
as of late November 2008, has provoked a storm of
controversy. Many critics have cried foul about the
government’s lack of transparency in its strategy; others fume that by rescuing rms and individuals that took
on too much leverage, the government has created thorny new problems of moral hazard (the concept that
shielding parties from the full consequences of their risk taking actually encourages them to take even greater
risks in the future). Still others worry that insucient eort and funds have thus far been devoted to halting the
rising tide of home foreclosures.
From its very outset, the Obama administration is faced with the daunting task of quelling a crisis that has
metastasized throughout the nancial sector and into the real economy. Housing markets need to be stabilized,
and the wave of foreclosures must be stemmed. But more than that, greater condence in the nation’s basic
nancial institutions and regulatory authorities must be instilled, and reforms must be undertaken to better
assure nancial stability in the future.
The government has taken on enormous amounts of actual and potential debt in an attempt to shore up the
nancial system, which only worsens the nation’s already staggering decit. Future administrations will be
grappling with the ramications of those decisions for years to come.
In a very real sense, the bill for this bubble has now been handed to taxpayers, and the nal tab is still being tallied.
The sheer size of the bailout,
with $7.5 trillion or more
committed in capital injections
and various guarantees
as of late November 2008,
has provoked a storm of
controversy.
5
Overview of the Housing and
Mortgage Markets
The mortgage market has witnessed several trends in recent years:
• Totalloanoriginations(newloansissued)increasedfrom$500billionin1990to$2.4trillionin2007before
declining to $900 billion in the rst half of 2008. Total amount outstanding increased from $2.6 trillion to
$11.3 trillion over the same period.
• TheFHAandVAshareofmortgageoriginationsdeclinedsharply,from16percentin1990tolessthan
4 percent in 2007, as the private sector become increasingly important for home mortgage funding.
This trend was reversed after 2007 in the wake of the mortgage market meltdown.
• From1990to2008,adjustableratemortgageoriginationstripled,beforedecliningto$106.7billioninthe
rst half of 2008. The outstanding amount grew tenfold.
• Mortgageoriginationstolesscreditworthyborrowers(intheformofsubprimeandAlt-Aloans)displayed
sharp increases during the boom, followed by big drops in their shares after the bubble burst.
Prior to 1980, the vast majority of all home mortgage loans were made by savings and loans, which originated,
serviced, and held the loans in their portfolios, in what is widely referred to as an originate-to-hold model. But over
time, home mortgages were increasingly securitized (i.e., put into pools and packaged into securities backed by the
individual loans) and sold in the secondary market; this process is the originate-to-distribute model.
Securitization, which allowed the mortgage market to tap into a broader base for funding, also “unbundled”
the three sources of revenue derived from home mortgages. Some rms (mortgage brokers) could handle the
origination function, other rms could opt to service the mortgages, and investors could receive the interest and
principal payments on the loans. This business model eventually had major ramications, opening the door to an
acceptance of riskier loans by originators, who could shift that risk to others.
During the housing boom, some
borrowers used their home equity to
juggle debt or finance lifestyles they
could not truly afford.
6
Because they were so removed from the origination process, investors in mortgage-backed securities (MBS)
relied on lenders—and even more heavily on rating agencies—to evaluate the quality of the underlying loans.
Although credit ratings for MBS provided information for gauging risk, they should never have been considered
a substitute for due diligence on the part of investors.
Figure 3: When is a AAA not a AAA?
Multilayered mortgage products create new and higher ratings
Origination of
mortgage loans
High-grade CDO
Pool of mortgage
loans: prime or subprime
Senior AAA 88%
Junior AAA 5%
AA 3%
A 2%
BBB 1%
Unrated 1%
Mortgage bonds
AAA 80%
AA 11%
A 4% Mezzanine CDO
BBB 3% CDO-squared (CDO of CDO)
BB-unrated 2%
Senior AAA 62%
Junior AAA 14% Senior AAA 60%
AA 8% Junior AAA 27%
A 6% AA 4% CDO-cubed…
BBB 6% A 3%
Unrated 4% BBB 3%
Unrated 2%
High-grade CDO
3%
Mezzanine CDO
(BBB-rated)
21%
CDO-squared
4%
CLO
36%
Other CDO
36%
U.S. CDOs: Outstanding = $900 billion
July 2007
Sources: International Monetary Fund, Milken Institute.
Purchasers of the securities issued by Fannie Mae, Freddie Mac, and Ginnie Mae are guaranteed interest and
principal payments, even if there are defaults on the underlying mortgages. MBS from private-label issuers are
typically guaranteed by monoline insurers (so called because they only provide coverage for securities available
in the capital markets). In 2006, these rms had insured $543 billion in MBS worldwide, which represented 25
percent of their total guarantees. The deterioration in the value of MBS in 2007 and 2008 raised concerns about
the insurers’ ability to honor their guarantees, even for municipal and other securities.
7
An important contributing factor to the most recent credit boom and the record homeownership rate it
produced were the low interest rates that prevailed from 2001 to the end of 2004, as the Federal Reserve took
steps to combat the 2001 recession and prevent deation.
Figure 4: Did the Fed lower interest rates too much and for too long?
Federal funds rate vs. rates on xed and adjustable mortgages
1-year adjustable
mortgage rate
target federal
funds rate
0
2
4
6
8
10
12
1991 1993 1995 1997 1999 2001 2003 2005 2007
Percent
Record low from June 25, 2003
to June 30, 2004: 1%
30-year average
fixed mortgage rate
Oct. 8, 2008: 1.5%
Oct. 29, 2008: 1%
Sources: Freddie Mac, Federal Reserve, Milken Institute.
The low interest rate environment had another eect on many home buyers: they increasingly opted for
adjustable rate mortgages (ARMs) over xed-rate mortgages (FRMs). ARMs held a clear attraction for lenders, as
they shifted interest rate risk to the borrowers. During the housing boom, many borrowers happily took that risk
in exchange for the low initial payments that made purchasing homes more aordable.
In addition to funding home purchases, mortgage loans can also allow borrowers to tap into any equity that is
built up in their homes. Indeed, nearly 15 percent of all mortgage originations in both 2006 and 2007 were home
equity loans, up sharply from only about 5 percent in 2001. During the housing boom, consumers increasingly
came to view their homes as ready sources of credit. In fact, some borrowers were using their home equity to
juggle debt or nance lifestyles they could not truly aord unless home prices kept rising.
8
Buildup and Meltdown of
the Mortgage and Credit Markets
The demand for residential real estate was seemingly insatiable. After rising at an average annual rate of slightly
less than 3 percent during the 1990s, home prices jumped nationally by an average of nearly 9 percent per year
from 2000 to 2006—and much higher in some overheated regions.
Fueled by low interest rates, subprime home mortgage originations increased dramatically, rising from 8 percent
in 2001 to 21 percent in 2005. Eighty percent of these subprime loans were packaged into MBS in 2006, up from
32 percent in 1994.
Mortgage brokers found subprime loans attractive because they could earn fees while passing along the
credit risk to those who ultimately funded the loans. In hindsight, many participants in the housing market
who should have known better clearly underestimated the risks associated with subprime loans—and there
were undoubtedly some players who chose to purposefully exploit the situation for short-term gain. Increased
mortgage originations, in turn, pushed housing prices to even higher levels.
The subprime mortgage industry developed a number of innovative products that fueled its growth, including
hybrids (loans that begin with a low xed rate for an initial period, then reset to higher variable rates for the
remainder of the term of the loan). In 2006, hybrids accounted for nearly two-thirds of all subprime mortgage
loans. Many subprime borrowers simply intended to renance before the rates went higher—and that strategy
did work for a time. Some borrowers and lenders alike may have tended to focus only on the borrower’s ability to
carry the low initial payments.
As for the risks being incurred by lenders, some seem to have operated under the optimistic expectation that
home prices would continue rising—or that mortgage loans would simply be securitized, shifting the credit risk
to another party. Now that we are in a crisis, it is instructive to look back and examine whether there were ample
signs of a housing bubble and whether heeding these warning signs could have mitigated the damage. Figure 5
shows that the recent run-up in prices quickly outstripped historical norms.
9
Figure 5: The recent run-up of nominal home prices was extraordinary
(1890–Q2 2008)
0
50
100
150
200
250
1890 1900 1910 1920 1930 1940 1950 1960 1970 1980 1990 2000 2010
World
War I
World
War II
1970s
boom
1980s
boom
Current
boom
Annualized growth rate of nominal home index: 3.4%
Index, 2000 = 100
Great
Depression
Long-term trend line
Sources: Shiller (2002), Milken Institute.
Note: The annualized growth rate is the geometric mean.
There were other warning signals. Median home prices rose sharply relative to median household income,
showing that borrowers were stretching further and further to buy homes, and rent-to-price ratios also
experienced precipitous declines. Given these signs, it is fair to ask why regulators and government ocials
failed to curtail the boom by, for example, tightening lending standards or increasing capital requirements.
By mid-2007, it was clear that the housing market had fallen into real distress. The most obvious sign was a long,
steep plunge in home prices, as chronicled in gure 6 by two S&P/Case-Shiller home price indexes and one
regulatory (OFHEO) home price index.
10
There were 1.3 million foreclosure starts from
the third quarter of 2006 to the second quarter
of 2008. Behind these numbers are countless
stories of families in crisis.
Figure 6: The collapse in home prices begins
(quarterly, Q1 1988–Q2 2008)
-18
-12
-6
0
6
12
18
24
1988 1992 1996 2000 2004 2008
OFHEO Conventional and
Conforming Home Price Index
Home price indexes, percent change from a year earlier
S&P/Case-Shiller national
S&P/Case-Shiller 10-city
Sources: S&P/Case-Shiller, OFHEO, Moody’s Economy.com, Milken Institute.
Falling prices unleashed a cascade of consequences, as many homeowners, especially those who bought near
the end of the boom, found themselves underwater (owing more than their home’s value). Borrowers with ARMs
were unable to renance before their rates reset. Foreclosures rose sharply, especially in Arizona, California,
Florida, and Nevada. One-third of homes sold between the third quarter of 2007 and the second quarter of 2008
were sold at a loss.
11
There were 1.3 million foreclosure starts over the two-year period from the third quarter of 2006 to the second
quarter of 2008. Behind these numbers are countless stories of families in crisis. In many neighborhoods, empty
properties sit neglected, driving nearby home values down even further. It is striking to note that the rate of
foreclosures on subprime loans originated increased each year beginning in 2003. For loans originated in 2006,
the foreclosure rate was 5.5 percent just six months from origination.
Given the increasing dollar amount of subprime loans being made, regulatory authorities should have initiated
corrective action well before August 2007. Indeed, why do we have numerous and well-staed regulatory
agencies at all if they are asleep at the wheel?
The Pain Spreads Throughout the Financial Sector and Beyond
The nancial crisis began spreading more widely in August 2007 with the collapse of two Bear Stearns hedge
funds that invested heavily in subprime-related securities; many investors grew increasingly concerned about
declining asset values and excessive leverage at
other nancial rms. Suddenly, the crisis on Main
Street had arrived on Wall Street’s doorstep.
The credit crunch was on: the spread between
LIBOR and the overnight index swap rate and the
TED spread, both indicators for availability of credit,
jumped in July 2007 and remain much higher than
their normal levels even as of this writing. The
meltdown of the mortgage market had produced
a widespread shortage of liquidity in the nancial
system. Firms with cash were holding onto it, and
other rms were rebuilding their capital, making
them reluctant to lend. These multifaceted problems soon spilled over to the real economy. Even for nonnancial
rms, credit spreads widened and stock prices declined. The unemployment rate rose as recessionary eects set in.
Eorts to help the credit markets and the real economy toward recovery became critical.
The disruptions in the mortgage and credit markets have been accompanied by unexpected twists—and no
one knows for certain what the ultimate cost will be. Estimates from various sources of the likely losses range
up to a high of $3 trillion. Worldwide through October 31, 2008, nancial institutions have taken cumulative
losses/write-downs of $685 billion. They have raised $688 billion in capital and cut 149,220 jobs. More recently,
Citigroup alone announced it was cutting another 52,000 jobs. The top ten nancial institutions accounted for 63
percent of the losses/write-downs, 58 percent of the capital raised, and 68 percent of the jobs cut.
Worldwide through October
31, 2008, financial institutions
have taken cumulative losses and
write-downs of $685 billion and
cut 149,220 jobs. More recently,
Citigroup announced it was
cutting another 52,000 jobs.
12
While nancial giants were calculating their mounting losses, millions of ordinary Americans watched in dismay
as their investment accounts were shrinking by the day. The eect on current retirees and those nearing
retirement age was devastating, and it remains to be seen how these losses, if they are not reversed, will strain
the Social Security system in the years to come.
The pain has indeed spread far and wide. Even the yield spread between state and local government (municipal)
bonds and ten-year Treasury bonds increased to its highest level since 1970, at almost ten percentage points.
This spread is typically negative, because municipal bonds have a tax advantage over Treasury bonds that
increases for individuals in higher tax brackets. But now municipal bonds have been harmed by the exposure
of the monoline insurers that guaranteed them. Tightening market conditions also reduced the supply of credit
available to state and local governments, which increasingly faced shortfalls.
Figure 7: Sign of collapse: Widening spreads between mortgage-backed and high-yield bonds
(weekly, 2004–October 31, 2008)
0
400
800
1,200
1,600
2,000
2004 2005 2006 2007 2008
Basis points, spread over 10-year Treasury bond
Merrill Lynch Mortgage-Backed Securities Index
Average, 2004–October 31, 2008: 327 bps
Merrill Lynch High-Yield Bond Index
Average, 2004–October 31, 2008: 389 bps
Maximum spread: August 29, 2008: 955.8 bps
Sources: Bloomberg, Milken Institute.
13
Figure 8: Widening TED spread: Spread between three-month LIBOR and T-bill rate
(daily, October 31, 2005–October 31, 2008)
0
50
100
150
200
250
300
350
400
450
500
12/2005 04/2006 08/2006 12/2006 04/2007 08/2007 12/2007 04/2008 08/2008
Historical high before 2008
November 1987: 255 bps
August 20, 2007: 240 bps
Average since 1985: 86 bps
Average since August 2007: 148 bps
Basis points
October 10, 2008: 463.6 bps
August 16, 2007: Countrywide takes
emergency loan of $11 billion from
a group of banks.
September 16, 2008: Fed rescues
AIG for $85 billion.
Sources: Bloomberg, Milken Institute.
Note: The TED spread is calculated as the dierence between the three-month LIBOR and the three-month T-bill interest rate.
The total amount of commercial paper (short-term debt routinely issued by corporations to cover operating expenses)
declined by $366 billion from September 10, 2008, to October 22, 2008. The slump further demonstrates how the
subprime mortgage market meltdown had spread throughout and beyond the nancial sector.
Even the safety of money market funds was called into question. Investors took withdrawals from their money
market funds from twelve of the top twenty institutions in the four days from September 12 to September 16,
2008. During this ve-day period, the Reserve Primary Fund suered massive withdrawals—$24.8 billion, or
nearly half of its assets—and on September 16 “broke the buck,” which means the value of its shares dropped
below a dollar.
All of the factors discussed above shook condence, but there was another looming cloud: the unregulated market
for credit default swaps (CDS), which had grown enormously in recent years. A CDS is a private contract between
two parties, traded over the counter, so no one could say with certainty just how big each rm’s exposure might
be. This murkiness eroded condence throughout 2008. CDS spreads widened not only for banks, but even more
sharply for the travel and leisure industry, with automobiles and parts industry a close second.
14
There has been mounting concern about the tremendous growth in this market. The notional amount of CDS
increased from less than $1 trillion in 2001 to slightly more than $62 trillion in 2007, before declining to $47
trillion on October 31, 2008 (partly due to the industry’s own eorts and partly due to recent auctions and
settlements of Fannie Mae, Freddie Mac, and Lehman Brothers CDS contracts). At the present time, no one can
say what amount is ultimately at risk in the CDS market. The notional amount is vast, but the actual exposure to
losses is clearly smaller. But it remains to be seen exactly how large any losses will be, which parties will bear the
losses, and whether those parties have sucient capital to absorb them.
Figure 9: Counterparty risk increases for nancial rms
(daily, July 2007–October 31, 2008)
0
100
200
300
400
500
600
700
07/2007 09/2007 11/2007 01/2008 03/2008 05/2008 07/2008 09/2008 11/2008
Average CDS spread, basis points
Bear Stearns acquired
Government announces support for
Fannie Mae and Freddie Mac
Lehman Brother files for bankruptcy
and Merrill Lynch acquired
AIG rescued
Citigroup agrees to buy Wachovia
October 10, 2008: 607 bps
Sources: Datastream, Milken Institute.
Note: Credit Derivatives Research (CDR) Counterparty Risk Index averages the market spreads of the credit default swaps of fteen major
credit derivatives dealers, including ABN Amro, Bank of America, BNP Paribas, Barclays Bank, Citigroup, Credit Suisse, Deutsche Bank, Goldman
Sachs Group, HSBC, Lehman Brothers, JPMorgan Chase, Merrill Lynch, Morgan Stanley, UBS, and Wachovia.
15
This uncertainty is the very reason why regulatory authorities are trying to shift these types of credit derivatives
to a central exchange: to better reduce the risk that the failure of a single counterparty will cause a systemic
crisis. The failure of Lehman Brothers and the massive Federal Reserve loans to AIG in September 2008
sharpened concerns about counterparty risk and intensied interest in establishing a clearinghouse that will
enable the netting of osetting contracts, thereby reducing the notional amount of contracts to a level that
actually represents the risk exposure to sellers. Once established, it can set up a fund to cover any losses in
the event of a member institution default, employ mark-to-market pricing on a daily basis, and liquidate the
positions of all member institutions who cannot post additional collateral, thereby reducing the risk of a systemic
crisis. On October 31, 2008, the Depository Trust & Clearing Corporation (DTCC) announced that it will publish
aggregate market data from its Trade Information Warehouse, the worldwide central trade registry it maintains
on credit derivatives. This type of information should help to alleviate market concerns about transparency.
16
What Went Wrong . . . ?
The crisis in the housing and credit markets demands a full
accounting of what went wrong. It is virtually impossible to
prevent a similar disruption in the future (or at least contain
its severity) without thoroughly understanding the factors
that caused this turmoil.
…with Origination Practices and
New Financial Products?
Part of what went wrong in the mortgage origination process
can be attributed to the simple fact that new products create
learning curves for both lenders and borrowers. The process
by which lenders and borrowers decide on specic mortgage
products is imperfect, and can even result in renegotiations
of mortgage terms or the discontinuation of some products. And regulatory authorities should always
be vigilant against fraud in mortgage markets, especially during periods of rapid credit expansion.
It is clear that origination practices did not always provide adequate information to potential borrowers that
would enable them to make informed decisions, especially regarding new products. Some borrowers simply
did not understand the terms of their loans.
Instead of trying to limit the products nancial institutions can oer, it makes more sense to concentrate eorts
on better informing potential customers about the available options and the specic terms of their loans. In
November 2008, the U.S. Department of Housing and Urban Development (HUD) began to require mortgage
lenders and brokers to provide borrowers with an easy-to-read standard Good Faith Estimate that will clearly
help answer the key questions they have when applying for a mortgage.
…with Securitization and Rating Agencies?
The broad industry shift to an originate-to-distribute model relies on the ability to sell mortgage-backed securities
(MBS) to investors. Rating agencies play a crucial role in providing information about the quality of such securities—
but in the wake of the mortgage market meltdown, their performance has been called into question.
As of November 5, 2008, AAA-rated securities accounted for 29 to 45 percent of all rated xed-income securities
(depending on which of three rating agencies was providing the rating) that were issued between January 1, 2000,
and September 30, 2008, and are still outstanding. It is interesting to note that around 90 percent or more of the
securities were rated investment grade by the three major agencies (Standard & Poor’s, Moody’s, and Fitch).
Rating agencies received
fees from the very issuers
of securities who
requested the ratings.
Almost everything wound
up with AAA ratings
through the issuance of
complex new investment
vehicles that were “sliced
and diced.”
17
Focusing more narrowly on the ratings of MBS from 2005 to 2007, more than half of these securities rated as
investment grade were eventually downgraded to below investment grade. Even among the securities rated
AAA, roughly one in six were downgraded within three years.
The rating process for securities backed by subprime loans was marked by a fundamental conict: Agencies
received fees from the very issuers who requested the ratings—and almost everything wound up with AAA
ratings through the issuance of complex new investment vehicles that were created from the “slicing and dicing”
of earlier securities.
Table 1: 56 percent of mortgage-backed securities issued from 2005 to 2007 were eventually downgraded
S&P Total Downgraded
Downgraded as a
percentage of total
AAA 1,032 156 15.1
AA(+/-) 3,495 1,330 38.1
A(+/-) 2,983 1,886 63.2
BBB(+/-) 2,954 2,248 76.1
BB(+/-) 789 683 86.6
B(+/-) 8 7 87.5
Total 11,261 6,310 56.0
Sources: Inside Mortgage Finance, Milken Institute.
Note: A bond is considered investment grade if its credit rating is BBB- or higher by S&P.
…with Leverage?
How could $1.2 trillion in subprime mortgages outstanding cause such a large global nancial disaster? Leverage
is certainly a part of the problem. If banks maintain a leverage ratio of 10:1, only $120 billion of capital can
support $1.2 trillion. With such a small amount supporting such risky loans, a 10 percent decline in the $1.2
trillion of assets could wipe out all of the banks’ capital. Of course, some institutions were more highly leveraged
than 10:1, and in some areas, home prices have fallen much more than 10 percent; so too has the value of the
subprime mortgages. (If the ratio were 30:1, which was the case with some rms, then the supporting capital
for $1.2 trillion would be only $40 billion.) These situations can force some institutions into insolvency if capital
cannot be raised to oset the decline in the value of assets.
18
Letting regulated institutions grow
too big with too little capital is a
recipe for disaster.
One fundamental truth governs all nancial institutions: the greater the leverage, the smaller the decline in asset
values that can be absorbed before insolvency occurs. This is why regulatory authorities overseeing nancial
institutions set minimum capital requirements.
Figure 10 shows the leverage ratios for dierent types of nancial institutions, as measured by total assets
relative to common equity. As of June 2008, the leverage ratios range from 9.1 to 67.9. Letting regulated
institutions grow too big with too little capital is a recipe for disaster.
Figure 10: Leverage ratios of dierent types of nancial rms
(June 2008)
0 10 20 30 40 50 60 70 80
9.1Credit unions
9.8Commercial banks
9.4Savings institutions
31.6
Brokers/hedge funds
23.7
Federal Home Loan Banks
21.5Fannie Mae
67.9Freddie Mac
Leverage ratio, total assets/common equtity
Sources: Federal Deposit Insurance Corporation, Oce of Federal Housing Enterprise Oversight, National Credit Union Administration,
Bloomberg, Google Finance, Milken Institute.
19
There has been a dramatic decline in the capital-asset ratio and the long-term increase in the leverage of
commercial banks. Indeed, each dollar of capital supported $3.56 of assets in 1896, whereas the same dollar
supported $9.89 of assets in 2007. The leverage issue for nancial rms is compounded by the fact that they also
rely on borrowings to fund their assets. In 1994, borrowed funds were 14 percent of total assets, but they had
increased to 20 percent by the second quarter of 2008. Heavier reliance on borrowed funds means that banks
must be able to roll over those funds to maintain the same total amount of assets, apart from any increases in
equity. This puts banks in a more dicult position when asset values decline and the investors from whom they
borrow become increasingly reluctant to lend. In such a situation, banks are required to raise additional capital,
sell assets, or undertake a combination of the two, even just to be sure there is sucient cash to meet payrolls
and other ongoing operating expenses.
…with Fannie Mae and Freddie Mac?
These two government-sponsored enterprises (or GSEs) became the dominant players in the home mortgage
market, holding or guaranteeing more than $5.5 trillion in home mortgages. But both Fannie Mae and Freddie
Mac were enormously highly leveraged. With thin capital ratios, any signicant decline in the value of their
assets would wipe out their capital—and both institutions did indeed suer substantial losses when housing
prices began to decline. On a fair value basis, Fannie Mae reported it was near insolvency in the second quarter
of 2008, while Freddie Mac reported it was actually insolvent. One quarter later, however, both institutions were
reporting insolvency on a fair value basis.
This dire situation can largely be explained by the fact that both
institutions have had a mandate not simply to focus on prots, but
to provide funding for aordable housing. Also, both institutions
recently were holding relatively large amounts of securities backed
by subprime and Alt-A mortgages (Alt-A loans are a notch above
subprime, but considered riskier than prime loans). The subprime-
backed securities alone accounted for 71 percent of the core capital
of Fannie Mae, and 116 percent of the core capital of Freddie Mac.
Furthermore, interest-only conventional mortgages securitized by
Freddie Mac increased from $25 billion in 2005 to $159 billion, or
more than 500 percent, in 2007.
Going forward, much
more effort should be
devoted to preemptive
actions that can prevent
asset bubbles rather
than to cleaning up
the mess once the
bubbles have burst.