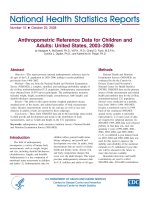
Anthropometric Reference Data for Children and Adults: United States, 2003–2006 ppt
Bạn đang xem bản rút gọn của tài liệu. Xem và tải ngay bản đầy đủ của tài liệu tại đây (1.24 MB, 45 trang )
Number 10 n October 22, 2008
Anthropometric Reference Data for Children and
Adults: United States, 2003–2006
by Margaret A. McDowell, Ph.D., M.P.H., R.D.; Cheryl D. Fryar, M.S.P.H.;
Cynthia L. Ogden, Ph.D.; and Katherine M. Flegal, Ph.D.
Abstract
Objective—This report presents national anthropometric reference data for
all ages of the U.S. population in 2003–2006, adding to results published
previously from 1960–2002.
Methods—Data are from the National Health and Nutrition Examination
Survey (NHANES), a complex, stratified, and multistage probability sample of
the civilian, noninstitutionalized U.S. population. Anthropometry measurements
were obtained from 19,593 survey participants. The anthropometric measures
included weight, height, recumbent length, circumferences, limb lengths, and
skinfold thickness measurements.
Results—The tables in this report include weighted population means,
standard errors of the means, and selected percentiles of body measurement
values. Because measurements varied by sex and age (as well as race and
ethnicity in adults), results are reported by these subgroups.
Conclusions—These latest NHANES data add to the knowledge about trends
in child growth and development and trends in the distribution of body
measurements, such as weight and height, in the U.S. population.
Keywords: anthropometry c body measures c nutrition surveys c National Health
and Nutrition Examination Survey (NHANES)
Introduction
The field of anthropometry
encompasses a variety of human body
measurements, such as weight, height,
and size, including skinfold thicknesses,
circumferences, lengths, and breadths.
Anthropometry is a key component of
nutritional status assessment in children
and adults (1). Anthropometric data for
children reflect general
health status,
dietary adequacy, and growth and
development over time. In adults, body
measurement data are used to evaluate
health and dietary status, disease risk,
and body composition changes that
occur over the adult lifespan. This report
provides anthropometric reference data
for U.S. children and adults of all ages.
Methods
National Health and Nutrition
Examination Surveys (NHANES) are
conducted by the the Centers for
Disease Control and Prevention’s
National Center for Health Statistics
(NCHS). NHANES data are the primary
source of body measurement and related
health and nutrition data for the civilian,
noninstitutionalized U.S. population.
Surveys were conducted on a periodic
basis from 1960 to 1994. NHANES
became a continuous survey in 1999.
Each of the continuous NHANES
annual survey samples is nationally
representative; 2 or more years of data
are required for subgroup analyses (2).
NHANES 1999–2006 data were released
publicly in four data sets, each one
spanning 2 years (1999–2000, 2001–
2002, 2003–2004, and 2005–2006)
(3–5). A combined 4-year dataset based
on 2003–2004 and 2005–2006 data was
used for this report to improve the
stability and reliability of the statistical
estimates (4–5). Additional 2-year data
sets will be released in the future as
more data become available.
Household interviews and health
examinations are used to collect
NHANES data. All health examinations
U.S. DEPARTMENT OF HEALTH AND HUMAN SERVICES
Centers for Disease Control and Prevention
National Center for Health Statistics
Page 2 National Health Statistics Reports n Number 10 n October 22, 2008
are conducted
in mobile examination
centers. The examination centers are
staffed by full-time personnel, including
health technicians who obtain body
measurements from survey participants.
All of the NHANES health technicians
completed a comprehensive body
measurement training program that
utilized videotape, demonstration, and
practice exercises with an expert
examiner. Health technician performance
was monitored by means of direct
observation, data review, and expert
examiner evaluations.
Although portions of the health
examination component have varied
during the surveys’ history, much of the
anthropometry component methodology
has remained consistent over time. The
NHANES anthropometry examinations
are completed in a room that is
equipped with a digital scale, a wall-
mounted stadiometer, a bench, a wall
mirror, an infantometer, and a computer
workstation. A health technician
performs the anthropometry exam and is
assisted by a recorder. NHANES
subjects wear socks and disposable
examination gowns during the
examination. The use of consistent data
collection methods in representative
population samples makes possible the
examination of trends in body
measurements over time in the U.S.
population.
Sample description
NHANES is a complex, multistage
probability sample of the civilian
noninstitutionalized U.S. population. The
NHANES 2003–2006 sample included
participants of all ages. Adolescents
12–19 years of age, persons 60 years of
age and older, Mexican Americans,
black persons, and low-income persons
were oversampled to improve the
precision of the statistical estimates for
these groups. Additional information
pertaining to the NHANES 2003–2006
survey design, survey methodology, and
public-use data is available on the
NHANES website (4–5).
The analytic sample for this report
was based on the 2003–2006 examined
sample of 19,593 persons. Pregnant
females were excluded from the
tabulations of weight, body mass index
(BMI), circumference measurements,
and skinfold thickness data.
Anthropometry examination
component
The NHANES 2005–2006
Anthropometry Training and Procedures
Manual describes the protocol,
equipment, quality control, and
measurement procedures that were used
during the NHANES anthropometry
examination (6). An anthropometry
methodology videotape that was
produced during NHANES III (1988–
1994) illustrates the NHANES
anthropometry methodology that was
used to collect the 2003–2006 data (7).
Weight was measured to the nearest
0.1 kilogram. Stature, length, and
circumference measurements were made
to the nearest millimeter. Skinfold
thickness measures were made to the
nearest 0.1 millimeter. Weight was
measured using a digital floor scale, and
an infantometer was used to measure
recumbent length on infants and young
children. Standing height was measured
with a wall-mounted stadiometer. Head
circumference measurements were made
using a plastic head circumference
measurement tape. Upper arm length
was measured with a tape measure from
the posterior border of the acromion
process to the tip of the olecranon
process; during the measurement the
upper arm length midpoint was marked.
The mid-arm circumference was
measured with a tape measure. Triceps
and subscapular skinfolds were
measured with a skinfold caliper. Waist
circumference was measured with a tape
measure at the uppermost lateral border
of the hip crest (ilium). Weight,
recumbent length, and standing height
values were recorded automatically. The
other body measurement data were
recorded using computer-assisted data
entry, and all results were based on a
single body measurement examination.
In addition to the measurements
above, three additional measurements
were taken on participants aged 8 years
and older. Upper leg length
measurements were taken on seated
participants; the distance from the
inguinal crease to the distal end of the
femur was measured. Maximal calf
circumference was also measured in a
seated position; a measurement tape was
positioned around the calf at the point
of maximum circumference. Mid-thigh
circumference was measured on
standing participants with the
measurement tape placed around the
mid-thigh, perpendicular to the long axis
of the femur bone.
Statistical analysis
Population means, standard errors
of the means, and percentiles were
weighted using the NHANES
examination sample weights to produce
national estimates. The NHANES
examination sample weights incorporate
the differential probabilities of selection
and include adjustments for
oversampling of selected populations,
noncoverage, and nonresponse. Standard
errors were estimated using SUDAAN
by Taylor series linearization because of
the complex sample design (8).
The reliability of the estimates
produced for this report was evaluated.
The relative standard error (RSE),
calculated as the standard error divided
by the estimate, and minimum sample
size criterion were used. NCHS
recommends that an estimate with an
RSE greater than 30 percent be
considered unreliable (2). The
recommended minimum sample sizes
were based on a combination of the
average design effects and specified
proportions (or percentiles) (9). The
average design effects reflect the impact
of the complex sample design on
variance estimates. They were calculated
as the ratio of the variance of a statistic
(accounting for the complex sample
design) to the variance of the same
statistic based on a hypothetical simple
random sample of the same size.
Average design effects were calculated
for each anthropometry variable over
sex for children and adolescents and
over sex and race-ethnicity for adults
aged 20 years and older. Minimum
sample sizes for a specified design
effect and percentile were obtained from
published tables (9). The percentile
National Health Statistics Reports n Number 10 n October 22, 2008 Page 3
estimates that did not meet the standards
for either RSE or minimum sample size
were replaced with asterisks (Tables 1–
41).
The age categories used for adults
aged 20 years and older were based on
the survey sample domains that were
recommended in the NHANES Analytic
Guidelines (2). The results for
participants who were under 20 years of
age are by single years or, in the case of
infants under 1 year of age, single
months of age.
Results
The anthropometric measurements
that were performed in the survey are
listed in Table A. Results for children
are reported by sex and age group, and
the results for adults aged 20 years and
older are also presented by sex,
race-ethnicity group, and age. Results
from previous surveys for most
measurements have been reported for
the National Health Examination Survey
and NHANES conducted from 1960–
2002 (10–30).
References
1. Simko MD, Cowell C, Gilbride JA.
Nutrition assessment: A
comprehensive guide for planning
intervention. 2nd ed. Gaithersburg,
MD: Aspen Publishers. 1995.
2. Centers for Disease Control and
Prevention. Analytic guidelines.
Hyattsville, MD: National Center for
Health Statistics. Available from:
nhanes_03_04/nhanes_analytic_
guidelines_dec_2005.pdf. September
2006.
3. National Center for Health Statistics.
National Health and Nutrition
Examination Surveys 1999–2006.
nhanes/datalink.htm.
4. National Center for Health Statistics.
National Health and Nutrition
Examination Survey, 2003–
2004examination files. Available
from:
major/nhanes/nhanes2003-2004/
exam03_04.htm. 2005.
5. National Center for Health Statistics.
National Health and Nutrition
Table A. Anthropometric measurments performed in the National Health and Nutrition Examination Survey, 2003–2006
Table number Measurement (unit of measure) Age group and sex
1 Weight (kilograms) Birth–19 years of age
2 Weight (pounds) Birth–19 years of age
3 Weight (kilograms) Females 20 years and older
4 Weight (pounds) Females 20 years and older
5 Weight (kilograms) Males 20 years and older
6 Weight (pounds) Males 20 years and older
7 Standing height (centimeters) Males and females 2–19 years
8 Standing height (inches) Males and females 2–19 years
9 Standing height (centimeters) Females 20 years and older
10 Standing height (inches) Females 20 years and older
11 Standing height (centimeters) Males 20 years and older
12 Standing height (inches) Males 20 years and older
13 Body mass index (BMI value) Males and females 2–19 years
14 Body mass index (BMI value) Females 20 years and older
15 Body mass index (BMI value) Males 20 years and older
16 Head circumference (centimeters) Birth–6 months
17 Recumbent length (centimeters) Birth–47 months
18 Waist circumference (centimeters) Males and females 2–19 years
19 Waist circumference (centimeters) Females 20 years and older
20 Waist circumference (centimeters) Males 20 years and older
21 Mid-arm circumference (centimeters) Males and females 2 months–19 years
22 Mid-arm circumference (centimeters) Females 20 years and older
23 Mid-arm circumference (centimeters) Males 20 years and older
24 Upper arm length (centimeters) Males and females 2 months–19 years
25 Upper arm length (centimeters) Females 20 years and older
26 Upper arm length (centimeters) Males 20 years and older
27 Subscapular skinfold (millimeters) Males and females 2 months–19 years
28 Subscapular skinfold (millimeters) Females 20 years and older
29 Subscapular skinfold (millimeters) Males 20 years and older
30 Triceps skinfold (millimeters) Males and females 2 months–19 years
31 Triceps skinfold (millimeters) Females 20 years and older
32 Triceps skinfold (millimeters) Males 20 years and older
33 Maximal calf circumference (centimeters) Males and females 8–19 years
34 Maximal calf circumference (centimeters) Females 20 years and older
35 Maximal calf circumference (centimeters) Males 20 years and older
36 Upper leg
length (centimeters) Males and females 8–19 years
37 Upper leg length (centimeters) Females 20 years and older
38 Upper leg length (centimeters) Males 20 years and older
38 Mid-thigh circumference (centimeters) Males and females 8–19 years
40 Mid-thigh circumference (centimeters) Females 20 years and older
41 Mid-thigh circumference (centimeters) Males 20 years and older
Page 4 National Health Statistics Reports n Number 10 n October 22, 2008
Examination Survey, 2005–2006
examination files. Available from:
nhanes/nhanes2005-2006/
exam05_06.htm. 2007.
6. Centers for Disease Control and
Prevention. NHANES anthropometry
and physical activity monitor
procedures manual. Available from:
nhanes_05_06/BM.pdf. January 2005.
7. Centers for Disease Control and
Prevention. NHANES III
anthropometric procedures video.
Washington, DC: U.S. Government
Printing Office. GPO stock no:
017–022–01335–5. Available from:
nhanes/avideo.htm.
8. Wolter KM. Introduction to variance
estimation. New York, NY: Springer-
Verlag. 1990.
9. National Center for Health Statistics.
Analytic and reporting guidelines:
The Third National Health and
Nutrition Examination Survey,
NHANES III (1988–94), appendix B.
Available from:
nchs/data/nhanes/nhanes3/nh3gui.pdf.
October 1996.
10. Stoudt HW, Damon A, McFarland R,
Roberts J. Skinfolds, body girths,
biacromial diameter, and selected
anthropometric indices of adults,
United States, 1960–1962. National
Center for Health Statistics. Vital
Health Stat 11(35). Available from:
sr_11/sr11_035acc.pdf. 1970.
11. Stoudt HW, Damon A, McFarland R,
Roberts J. Weight, height, and
selected body dimensions of adults:
United States, 1960–1962. National
Center for Health Statistics. Vital
Health Stat 11(8). 1965.
12. Roberts J. Weight by height and age
of adults: United States, 1960–1962.
National Center for Health
Statistics.Vital Health Stat 11(14).
1966.
13. Malina RM, Hamill PVV, Johnston
FE, Lemeshow S. Selected body
measurements of children 6–11 years,
United States. National Center for
Health Statistics. Vital Health Stat
11(123). Available from: http://
www.cdc.gov/nchs/data/series/sr_11/
sr11_123acc.pdf. 1973.
14. Hamill PV, Johnston FE, Lemeshow
S. Height and weight of youths
12–17 years, United States. National
Center for Health Statistics. Vital
Health Stat 11(124). Available from:
sr_11/sr11_124.pdf. 1973.
15. Abraham S, Johnson CL, Najjar MF.
Weight and height of adults 18–74
years of age: United States, 1971–74.
National Center for Health Statistics.
Vital Health Stat 11(211). 1979.
16. Johnson CL, Fulwood R, Abraham S,
Bryner JD. Basic data on
anthropometric measurements and
angular measurements of the hip and
knee joints for selected age groups
1–74 years of age: United States,
1971–1975. National Center for
Health Statistics. Vital Health Stat
11(219). Available from: http://
www.cdc.gov/nchs/data/series/sr_11/
sr11_219.pdf. 1981.
17. Najjar MF, Rowland M.
Anthropometric reference data and
prevalence of overweight: United
States, 1976–80. National Center for
Health Statistics. Vital Health Stat
11(238). Available from: http://
www.cdc.gov/nchs/data/series/sr_11/
sr11_238.pdf. 1987.
18. Najjar MF, Kuczmarski RJ.
Anthropometric data and prevalence
of overweight for Hispanics:
1982–84. Vital Health Stat 11(239).
Available from:
nchs/data/series/sr_11/sr11_239.pdf.
1989.
19. National Center for Health Statistics.
Anthropometric Reference Data,
United States, 1988–1994. Available
from:
major/nhanes/anthropometric_
measures.htm.
20. Ogden CL, Fryar CD, Carroll MD,
Flegal KM. Mean body weight,
height, and body mass index, United
States 1960–2002. Advance data
from vital and health statistics; no
347. Hyattsville, MD: National
Center for Health Statistics. 2004.
21. McDowell MA, Fryar CD, Hirsch R,
Ogden CL. Anthropometric reference
data for children and adults: U.S.
population, 1999–2002. Advance data
from vital and health statistics; no
361. Hyattsville, MD: National
Center for Health Statistics. 2005.
22. Ogden CL, Carroll MD, Curtin LR,
McDowell MA, Tabak CJ, Flegal
KM. Prevalence of overweight and
obesity in the United States, 1999–
2004. JAMA 295(13):1549–55. 2006.
23. Freedman DS, Khan LK, Serdula
MK, Ogden CL, Dietz WH. Racial
and ethnic differences in secular
trends for childhood BMI, weight,
and height. Obesity (Silver Spring)
14(2):301–8. 2006.
24. Flegal KM, Ogden CL, Carroll MD.
Prevalence and trends in overweight
in Mexican-American adults and
children. Nutr Rev 62(7 Pt 2):S144–
8. 2004.
25. Hedley AA, Ogden CL, Johnson CL,
Carroll MD, Curtin LR, Flegal KM.
Prevalence of overweight and obesity
among U.S. children, adolescents,
and adults, 1999–2002. JAMA
291(23):2847–50. 2004.
26. Ogden CL, Carroll MD, Flegal KM.
Epidemiologic trends in overweight
and obesity. Endocrinol Metab Clin
North Am 32(4):741–60,vii. 2003.
27. Ogden CL, Flegal KM, Carroll MD,
Johnson CL. Prevalence and trends
in overweight among U.S. children
and adolescents, 1999–2000. JAMA
288(14):1728–32. 2002.
28. Flegal KM, Carroll MD, Ogden CL,
Johnson CL. Prevalence and trends
in obesity among U.S. adults,
1999–2000. JAMA 288(14):1723–7.
2002.
29. Ogden CL, Troiano RP, Briefel RR,
Kuczmarski RJ, Flegal KM, Johnson
CL. Prevalence of overweight among
preschool children in the United
States, 1971 through 1994. Pediatrics
99(4):E1. 1997.
30. Kuczmarski RJ, Flegal KM,
Campbell SM, Johnson CL.
Increasing prevalence of overweight
among U.S. adults. The National
Health and Nutrition Examination
Surveys, 1960 to 1991. JAMA
272(3):205–11. 1994.
National Health Statistics Reports n Number 10 n October 22, 2008 Page 5
Table
error
1.
of
Weight in
the mean,
kilograms for
and selected
children and adolescents from birth through
percentiles: United States, 2003–2006
19 years of age by sex and age, by mean, standard
Number Standard
Percentile
1
Sex and age examined Mean error 5th 10th 15th 25th 50th 75th 85th 90th 95th
Male
Birthto2months
3–5months
6–8months
9–11months
1 year
2 years
3 years
4 years
5 years
6 years
7 years
8 years
9 years
10 years
11 years
12 years
13 years
14 years
15 years
16 years
17 years
18 years
19 years
Female
Birthto2months
3–5months
6–8months
9–11months
1 year
2 years
3 years
4 years
5 years
6 years
7 years
8 years
9 years
10 years
11 years
12 years
13 years
14 years
15 years
16 years
17 years
18 years
19 years
101
139
130
124
360
292
210
208
202
176
181
151
176
172
158
275
284
260
270
308
279
283
271
81
94
122
126
328
335
191
226
199
193
157
184
185
189
175
249
292
269
248
253
252
272
239
5.2
7.3
8.4
9.7
11.6
14.1
15.8
18.6
22.1
24.2
26.6
31.4
34.6
40.1
46.8
50.8
57.8
63.1
70.2
76.1
75.0
77.2
80.2
4.9
6.8
8.1
9.2
10.9
13.4
15.8
17.9
20.5
23.4
27.3
30.7
36.7
42.4
49.2
52.9
57.4
58.8
60.9
61.5
66.0
67.6
67.4
0.12
0.08
0.13
0.15
0.12
0.14
0.16
0.31
0.49
0.33
0.58
0.90
0.71
0.86
1.62
1.23
1.37
1.73
1.36
1.50
1.30
1.67
1.60
0.10
0.10
0.13
0.11
0.11
0.13
0.20
0.21
0.37
0.49
0.62
0.94
0.99
1.07
1.31
1.31
0.98
1.75
0.76
0.95
1.66
2.15
1.79
*
*
*
*
8.9
11.3
*
*
*
*
*
*
*
*
*
32.0
35.9
42.5
48.5
53.4
54.1
53.7
54.3
*
*
*
*
8.4
10.2
*
*
*
*
*
*
*
*
*
*
36.8
*
*
*
*
*
*
*
6.2
6.8
*
9.2
12.0
13.4
15.2
17.4
19.5
19.6
23.4
25.8
28.4
33.2
35.9
39.4
43.9
52.4
55.3
56.7
57.2
58.1
*
*
*
*
8.8
10.7
12.8
14.8
15.9
18.4
21.1
22.3
26.2
29.1
33.3
36.4
41.2
44.0
46.5
47.2
49.1
47.8
50.9
4.2
6.4
7.2
8.6
9.8
12.3
13.6
15.5
18.1
20.0
21.0
24.2
26.6
29.7
34.1
37.0
41.9
47.2
55.0
57.9
58.6
59.4
61.2
*
*
7.1
8.0
9.1
11.2
13.4
15.2
16.9
19.1
21.7
23.5
27.8
30.7
34.8
40.4
43.0
45.8
47.6
49.5
51.4
49.7
52.8
4.6
6.7
7.6
8.9
10.5
12.8
14.2
16.2
18.9
20.9
22.4
25.3
28.2
31.7
35.5
39.5
43.9
51.4
58.2
61.5
60.9
64.0
64.7
4.4
6.2
7.3
8.2
9.9
12.1
14.1
16.1
17.6
19.9
23.9
25.0
29.6
32.5
38.0
43.6
47.1
48.5
50.7
53.2
54.1
54.6
55.3
Kilograms
5.2
7.2
8.4
9.7
11.5
13.9
15.3
18.1
21.0
23.7
25.6
29.0
32.3
37.3
44.2
46.9
55.6
59.8
66.3
70.7
70.6
72.7
76.5
4.9
6.6
8.0
9.0
10.9
13.1
15.5
17.5
19.6
22.1
25.7
28.2
34.0
40.5
47.3
49.5
54.4
54.4
57.6
58.8
60.6
63.0
63.0
5.9
7.8
9.1
10.4
12.6
15.1
17.1
20.0
23.5
26.2
29.6
34.3
39.4
45.1
54.0
57.3
64.4
70.7
76.9
88.5
84.2
83.7
92.9
5.4
7.3
8.8
10.0
11.9
14.4
16.8
19.4
22.1
25.3
29.7
33.9
42.0
49.0
56.7
59.7
63.4
64.8
67.6
67.0
71.9
76.2
73.6
6.3
8.0
9.5
10.6
13.3
15.8
18.1
21.3
25.2
27.6
32.3
38.3
42.5
53.6
63.3
65.1
73.5
76.5
84.7
96.3
92.0
97.8
99.6
*
*
9.2
10.3
12.5
15.4
17.8
20.2
24.4
27.4
33.6
39.1
46.7
55.5
62.4
67.4
72.6
75.8
76.7
71.5
79.7
86.2
84.3
*
8.2
9.9
*
13.8
16.4
18.7
22.7
26.9
29.5
33.9
41.9
44.1
56.8
67.0
72.8
81.0
84.3
89.9
101.9
101.3
105.8
107.3
*
*
*
*
13.0
16.1
18.5
20.8
25.5
29.7
35.5
42.1
50.7
58.5
68.2
76.2
76.0
81.0
81.0
79.6
87.3
92.1
92.7
*
*
*
*
14.4
16.9
*
*
*
*
*
*
*
*
*
82.9
90.9
99.1
100.4
116.1
111.0
110.4
117.3
*
*
*
*
13.4
16.8
*
*
*
*
*
*
*
*
*
*
88.5
*
*
*
*
*
*
* Figure does not meet standards of reliability or precision.
1
Age shown is age at time of examination.
NOTE: Pregnant females were excluded.
Page 6 National Health Statistics Reports n Number 10 n October 22, 2008
Table
error
2.
of
Weight in
the mean,
pounds for children and adolescents from birth through
and selected percentiles: United States, 2003–2006
19 years of age by sex and age, by mean, standard
Number Standard
Percentile
Sex and
1
age examined Mean error 5th 10th 15th 25th 50th 75th 85th 90th 95th
Male
Birth to 2 months
3–5 months
6–8 months
9–11 months
1 year
2 years
3 years
4 years
5 years
6 years
7 years
8 years
9 years
10 years
11 years
12 years
13 years
14 years
15 years
16 years
17 years
18 years
19 years
Female
Birth to 2 months
3–5 months
6–8 months
9–11 months
1 year
2 years
3 years
4 years
5 years
6 years
7 years
8 years
9 years
10 years
11 years
12 years
13 years
14 years
15 years
16 years
17 years
18 years
19 years
101
139
130
124
360
292
210
208
202
176
181
151
176
172
158
275
284
260
270
308
279
283
271
81
94
122
126
328
335
191
226
199
193
157
184
185
189
175
249
292
269
248
253
252
272
239
11.5
16.0
18.6
21.5
25.5
31.1
34.8
40.9
48.7
53.3
58.7
69.3
76.3
88.3
103.2
112.0
127.4
139.1
154.9
167.7
165.4
170.2
176.8
10.9
14.9
17.9
20.2
24.1
29.5
34.8
39.4
45.3
51.5
60.2
67.7
81.0
93.5
108.4
116.7
126.4
129.6
134.2
135.6
145.6
149.0
148.6
0.27
0.18
0.30
0.32
0.28
0.31
0.35
0.68
1.07
0.72
1.28
1.99
1.57
1.89
3.58
2.71
3.03
3.81
2.99
3.31
2.86
3.68
3.54
0.22
0.23
0.30
0.25
0.24
0.29
0.45
0.46
0.82
1.08
1.37
2.07
2.18
2.35
2.88
2.88
2.15
3.85
1.67
2.10
3.65
4.75
3.95
*
*
*
*
19.6
24.8
*
*
*
*
*
*
*
*
*
70.5
79.1
93.6
106.9
117.8
119.2
118.5
119.7
*
*
*
*
18.4
22.4
*
*
*
*
*
*
*
*
*
*
81.2
*
*
*
*
*
*
*
13.6
15.0
*
20.3
26.5
29.5
33.4
38.4
43.0
43.3
51.7
56.9
62.6
73.2
79.2
86.9
96.9
115.4
121.8
125.0
126.2
128.1
*
*
*
*
19.3
23.7
28.2
32.6
35.1
40.6
46.5
49.3
57.9
64.1
73.3
80.2
90.9
97.1
102.4
104.2
108.1
105.3
112.2
9.2
14.1
15.9
18.9
21.5
27.2
30.1
34.2
40.0
44.1
46.3
53.4
58.7
65.4
75.2
81.6
92.4
104.2
121.2
127.8
129.2
130.8
134.8
*
*
15.7
17.5
20.0
24.6
29.5
33.5
37.2
42.1
47.9
51.8
61.3
67.7
76.7
89.0
94.7
101.1
104.9
109.1
113.3
109.6
116.4
10.1
14.7
16.7
19.7
23.1
28.2
31.3
35.8
41.7
46.1
49.3
55.7
62.2
70.0
78.2
87.0
96.8
113.4
128.3
135.7
134.2
141.1
142.5
9.7
13.7
16.1
18.1
21.7
26.6
31.2
35.4
38.7
43.8
52.7
55.1
65.3
71.6
83.7
96.0
103.9
106.8
111.7
117.3
119.4
120.3
121.9
Pounds
11.5
15.9
18.5
21.4
25.3
30.7
33.8
39.8
46.3
52.2
56.4
64.0
71.2
82.2
97.4
103.3
122.5
131.8
146.1
155.8
155.6
160.3
168.7
10.8
14.5
17.7
19.9
24.1
29.0
34.2
38.6
43.3
48.8
56.6
62.1
75.0
89.2
104.3
109.1
119.9
120.0
126.9
129.7
133.6
138.8
138.9
12.9
17.1
20.0
23.0
27.7
33.2
37.8
44.0
51.7
57.8
65.2
75.6
86.9
99.5
119.0
126.3
142.0
155.9
169.4
195.1
185.7
184.6
204.8
11.8
16.2
19.4
22.1
26.3
31.8
37.0
42.7
48.7
55.8
65.5
74.8
92.7
108.1
125.1
131.7
139.8
142.9
149.0
147.7
158.5
168.1
162.2
13.8
17.7
20.9
23.4
29.3
34.9
39.9
46.9
55.5
60.8
71.3
84.5
93.7
118.2
139.6
143.6
162.0
168.6
186.8
212.3
202.8
215.5
219.7
*
*
20.2
22.7
27.5
34.0
39.3
44.6
53.8
60.4
74.1
86.3
102.8
122.4
137.6
148.5
160.0
167.2
169.0
157.7
175.6
190.0
185.8
*
18.1
21.8
*
30.5
36.1
41.2
50.1
59.3
65.1
74.6
92.3
97.2
125.3
147.8
160.5
178.6
185.8
198.1
224.7
223.4
233.2
236.5
*
*
*
*
28.6
35.4
40.8
45.8
56.1
65.5
78.3
92.8
111.8
129.1
150.3
168.0
167.6
178.6
178.5
175.5
192.5
203.0
204.3
*
*
*
*
31.6
37.2
*
*
*
*
*
*
*
*
*
182.7
200.5
218.4
221.3
256.0
244.7
243.3
258.6
*
*
*
*
29.5
37.0
*
*
*
*
*
*
*
*
*
*
195.2
*
*
*
*
*
*
* Figure does not meet standards of reliability
1
Age shown is age at time of examination.
NOTE: Pregnant females were excluded.
or precision.
National Health Statistics Reports n Number 10 n October 22, 2008 Page 7
Table 3. Weight in kilograms for
and selected percentiles: United
females
States,
20 years of
2003–2006
age and older by race and ethnicity and age, by mean, standard error of the mean,
Number Standard
Percentile
Race and ethnicity and age examined Mean error 5th 10th 15th 25th 50th 75th 85th 90th 95th
1
All race and ethnicity groups
20 years and over
20–29 years
30–39 years
40–49 years
50–59 years
60–69 years
70–79 years
80 years and over
Non-Hispanic white
20 years and over
20–39 years
40–59 years
60 years and over
Non-Hispanic black
20 years and over
20–39 years
40–59 years
60 years and over
Mexican American
20 years and over
20–39 years
40–59 years
60 years and over
4,330
706
663
779
602
694
468
418
2,233
615
674
944
959
329
355
275
817
300
234
283
74.7
70.7
74.7
77.7
78.0
77.3
70.6
64.5
74.3
72.1
77.6
72.0
83.8
82.4
86.2
82.0
73.6
72.8
76.4
69.4
0.53
1.03
1.06
1.03
1.15
0.91
1.07
0.69
0.57
0.99
0.91
0.60
0.71
1.33
0.73
1.33
0.94
1.24
1.22
1.01
50.5
48.0
51.2
52.3
51.8
51.9
49.4
46.1
50.8
50.4
52.2
49.1
53.0
52.5
54.5
52.8
50.5
49.8
53.7
49.8
53.5
51.3
54.1
55.2
54.7
56.8
53.2
49.8
53.8
52.7
55.4
53.5
57.9
56.4
60.5
56.1
53.8
53.0
56.5
52.4
56.1
53.1
56.5
58.2
57.5
59.2
55.1
52.3
56.4
54.6
57.8
55.7
61.4
59.7
66.5
59.4
56.3
54.7
59.1
55.1
60.2
56.3
59.8
62.8
62.9
64.0
60.0
55.3
60.3
58.1
62.8
60.6
68.6
66.6
72.2
66.1
60.7
59.6
63.5
58.9
Kilograms
70.7
65.3
70.2
72.9
73.7
74.0
68.3
63.8
70.1
67.1
72.9
70.0
80.2
77.6
82.1
79.0
70.8
70.4
73.4
67.4
84.3
78.8
83.6
89.2
88.1
86.9
78.9
71.9
83.4
80.7
88.3
80.7
95.1
94.3
97.1
93.9
83.1
82.9
85.5
77.9
94.1
88.7
94.3
100.1
99.4
96.4
84.1
76.7
92.6
90.2
97.7
87.0
105.8
104.0
108.1
101.8
90.8
90.0
94.0
84.0
101.8
98.6
101.7
106.6
106.3
102.0
91.2
80.6
100.7
98.5
106.1
93.1
114.4
113.2
117.8
108.4
96.9
95.7
99.7
89.0
113.6
110.7
114.2
116.9
117.8
112.9
98.9
86.4
111.6
110.7
116.6
102.1
125.2
124.3
126.4
118.7
103.9
103.9
106.9
98.3
1
Persons of other races and unknown race
NOTE: Pregnant females were excluded.
and ethnicity are included.
Page 8 National Health Statistics Reports n Number 10 n October 22, 2008
Table 4. Weight in pounds for females 20 years of age
and selected percentiles: United States, 2003–2006
and older by race and ethnicity and age, by mean, standard error of the mean,
Number Standard
Percentile
Race and ethnicity and age examined Mean error 5th 10th 15th 25th 50th 75th 85th 90th 95th
1
All race and ethnicity groups
20 years and over
20–29 years
30–39 years
40–49 years
50–59 years
60–69 years
70–79 years
80 years and over
Non-Hispanic white
20 years and over
20–39 years
40–59 years
60 years and over
Non-Hispanic black
20 years and over
20–39 years
40–59 years
60 years and over
Mexican American
20 years and over
20–39 years
40–59 years
60 years and over
4,330
706
663
779
602
694
468
418
2,233
615
674
944
959
329
355
275
817
300
234
283
164.7
155.9
164.7
171.3
172.1
170.5
155.6
142.2
163.7
158.9
171.0
158.8
184.8
181.6
190.1
180.8
162.2
160.5
168.4
153.0
1.17
2.27
2.34
2.27
2.53
2.02
2.35
1.53
1.26
2.17
2.01
1.32
1.56
2.94
1.61
2.94
2.07
2.73
2.68
2.22
111.2
105.8
112.8
115.3
114.1
114.3
109.0
101.7
112.1
111.2
115.2
108.3
116.9
115.8
120.2
116.3
111.4
109.8
118.4
109.8
118.0
113.1
119.3
121.8
120.7
125.1
117.3
109.9
118.5
116.1
122.1
118.0
127.6
124.3
133.4
123.7
118.6
116.9
124.6
115.6
123.8
117.0
124.5
128.2
126.7
130.6
121.4
115.3
124.3
120.4
127.5
122.9
135.3
131.7
146.5
131.1
124.1
120.6
130.2
121.6
132.8
124.1
131.9
138.4
138.7
141.1
132.2
121.8
133.0
128.1
138.5
133.6
151.2
146.8
159.2
145.7
133.7
131.4
139.9
129.9
Pounds
155.8
144.0
154.8
160.8
162.5
163.1
150.6
140.6
154.5
148.0
160.7
154.2
176.8
171.0
180.9
174.2
156.0
155.2
161.9
148.6
185.9
173.7
184.3
196.6
194.2
191.6
174.0
158.5
183.9
177.9
194.6
178.0
209.6
207.9
214.2
207.0
183.1
182.7
188.4
171.7
207.5
195.5
208.0
220.7
219.1
212.6
185.3
169.0
204.2
198.8
215.3
191.8
233.3
229.2
238.4
224.4
200.2
198.4
207.3
185.3
224.3
217.4
224.3
235.0
234.3
224.9
201.0
177.7
221.9
217.1
233.8
205.2
252.2
249.6
259.7
238.9
213.6
210.9
219.7
196.2
250.4
244.2
251.8
257.7
259.7
248.8
218.0
190.5
246.0
244.0
257.0
225.1
275.9
274.0
278.7
261.8
229.1
229.2
235.7
216.8
1
Persons of other races and unknown race
NOTE: Pregnant females were excluded.
and ethnicity are included.
National Health Statistics Reports n Number 10 n October 22, 2008 Page 9
Table 5. Weight in kilograms for
and selected percentiles: United
males 20 years of age
States, 2003–2006
and older by race and ethnicity and age, by mean, standard error of the mean,
Number Standard
Percentile
Race and ethnicity and age examined Mean error 5th 10th 15th 25th 50th 75th 85th 90th 95th
1
All race and ethnicity groups
20 years and over
20–29 years
30–39 years
40–49 years
50–59 years
60–69 years
70–79 years
80 years and over
Non-Hispanic white
20 years and over
20–39 years
40–59 years
60 years and over
Non-Hispanic black
20 years and over
20–39 years
40–59 years
60 years and over
Mexican American
20 years and over
20–39 years
40–59 years
60 years and over
4,489
811
741
769
591
669
555
353
2,339
666
709
964
941
361
316
264
903
375
247
281
88.3
85.4
88.1
91.8
90.2
90.0
85.0
76.3
89.6
87.7
92.5
87.2
90.6
91.8
91.2
85.7
81.9
82.1
82.0
79.8
0.46
1.06
0.80
0.83
0.95
0.98
0.92
0.62
0.48
0.90
0.85
0.58
0.99
1.50
1.16
1.21
0.85
1.31
0.92
1.15
62.2
59.9
62.6
65.9
64.5
63.8
61.4
55.4
64.2
62.6
66.9
62.4
62.3
62.0
63.4
59.6
60.0
59.8
61.2
55.6
66.7
63.4
67.1
71.1
69.1
68.5
65.4
59.7
68.6
66.5
72.1
66.7
66.6
66.6
68.2
64.0
62.7
61.7
65.5
61.2
70.1
66.5
70.0
74.1
72.6
72.0
68.4
63.4
71.7
69.9
75.1
69.8
70.2
70.4
70.5
67.3
66.0
64.8
68.5
64.9
75.2
71.4
74.3
79.3
77.0
77.7
73.4
66.9
76.8
74.6
79.8
75.5
75.0
74.4
75.9
72.2
70.5
69.3
72.4
68.6
Kilograms
85.6 98.4
81.1 94.3
85.9 98.1
88.9 101.2
88.7 100.5
88.0 100.2
83.8 94.7
75.5 84.7
87.3 99.2
84.2 96.9
90.5 102.6
85.4 96.4
86.2 100.5
86.2 102.7
86.7 100.6
84.4 96.9
79.6 90.0
79.0 91.1
80.6 89.0
78.6 89.2
106.4
104.6
104.3
109.8
108.0
108.0
98.9
89.4
107.0
104.4
110.2
103.9
109.6
112.1
107.6
105.2
97.7
99.5
93.5
95.2
111.5
111.5
109.6
114.0
113.1
112.9
104.5
92.9
111.9
109.8
114.6
109.8
117.8
122.3
118.5
109.3
102.1
103.2
97.5
99.4
122.6
122.6
120.8
124.7
124.4
121.3
116.7
99.7
122.7
122.2
124.1
118.7
137.2
143.1
137.6
116.7
112.9
114.3
109.3
107.1
1
Persons of other races and unknown race and ethnicity are included.
Page 10 National Health Statistics Reports n Number 10 n October 22, 2008
Table 6. Weight in pounds for males 20 years of age
and selected percentiles: United States, 2003–2006
and older by race and ethnicity and age, by mean, standard error of the mean,
Number Standard
Percentile
Race and ethnicity and age examined Mean error 5th 10th 15th 25th 50th 75th 85th 90th 95th
1
All race and ethnicity groups
20 years and over
20–29 years
30–39 years
40–49 years
50–59 years
60–69 years
70–79 years
80 years and over
Non-Hispanic white
20 years and over
20–39 years
40–59 years
60 years and over
Non-Hispanic black
20 years and over
20–39 years
40–59 years
60 years and over
Mexican American
20 years and over
20–39 years
40–59 years
60 years and over
4,489
811
741
769
591
669
555
353
2,339
666
709
964
941
361
316
264
903
375
247
281
194.7
188.3
194.1
202.3
198.8
198.3
187.4
168.1
197.4
193.5
203.8
192.3
199.8
202.4
201.0
189.0
180.5
181.1
180.7
175.9
1.02
2.33
1.77
1.83
2.10
2.16
2.03
1.36
1.05
1.98
1.88
1.27
2.19
3.31
2.56
2.66
1.88
2.89
2.03
2.55
137.1
132.0
137.9
145.4
142.2
140.7
135.4
122.1
141.6
138.1
147.5
137.5
137.3
136.8
139.7
131.3
132.3
131.9
134.9
122.6
147.0
139.7
148.0
156.7
152.2
151.1
144.2
131.5
151.3
146.6
158.9
147.1
146.8
146.8
150.3
141.1
138.2
136.0
144.5
134.9
154.6
146.5
154.2
163.3
159.9
158.7
150.7
139.8
158.0
154.1
165.5
154.0
154.7
155.2
155.3
148.4
145.5
142.9
151.0
143.2
165.7
157.3
163.8
174.8
169.8
171.2
161.8
147.6
169.2
164.5
176.0
166.4
165.3
164.0
167.4
159.3
155.5
152.7
159.6
151.3
Pounds
188.8
178.7
189.3
196.1
195.5
194.1
184.7
166.5
192.5
185.7
199.6
188.3
190.1
190.0
191.1
186.1
175.5
174.1
177.7
173.2
216.8
207.9
216.3
223.1
221.6
220.8
208.8
186.7
218.6
213.7
226.2
212.5
221.5
226.4
221.7
213.7
198.3
200.9
196.3
196.7
234.5
230.5
230.0
242.0
238.1
238.1
218.0
197.0
236.0
230.2
243.0
229.1
241.7
247.2
237.3
231.8
215.4
219.5
206.2
209.8
245.8
245.8
241.6
251.2
249.4
248.9
230.4
204.9
246.7
242.0
252.7
242.1
259.6
269.6
261.3
240.9
225.1
227.5
214.9
219.1
270.3
270.3
266.4
275.0
274.3
267.4
257.4
219.9
270.5
269.4
273.5
261.6
302.5
315.5
303.2
257.2
248.8
251.9
240.9
236.2
1
Persons of other races and unknown race and ethnicity are included.
National Health Statistics Reports n Number 10 n October 22, 2008 Page 11
Table 7. Height in centimeters for children and adolescents
and selected percentiles: United States, 2003–2006
aged 2–19 years by sex and age, by mean, standard error of the mean,
Number Standard
Percentile
Sex and
1
age examined Mean error 5th 10th 15th 25th 50th 75th 85th 90th 95th
2 years
3 years
4 years
5 years
6 years
7 years
8 years
9 years
10 years
11 years
12 years
13 years
14 years
15 years
16 years
17 years
18 years
19 years
2 years
3 years
4 years
5 years
6 years
7 years
8 years
9 years
10 years
11 years
12 years
13 years
14 years
15 years
16 years
17 years
18 years
19 years
Male
Female
258
209
206
202
176
181
152
176
171
158
275
284
260
270
308
278
284
271
285
187
225
199
193
157
184
185
189
174
249
292
270
254
261
275
304
267
91.9
98.5
107.1
114.4
120.6
124.7
131.1
136.8
142.3
150.0
154.7
161.9
168.7
173.6
175.9
176.6
176.8
176.7
90.2
98.3
105.2
112.2
119.0
125.8
131.3
138.6
144.2
151.3
156.7
158.6
160.5
162.1
162.9
162.2
163.0
163.1
0.22
0.44
0.44
0.52
0.47
0.75
0.68
0.49
0.77
1.16
0.54
0.87
0.70
0.61
0.66
0.49
0.54
0.91
0.39
0.35
0.40
0.54
0.53
0.77
0.54
0.70
0.73
0.69
0.55
0.62
0.58
0.60
0.58
0.41
0.49
0.58
*
*
*
*
*
*
*
*
*
*
*
*
*
*
164.2
*
*
*
*
*
*
*
*
*
*
*
*
*
*
147.1
*
*
*
*
151.9
*
86.9
92.6
99.9
107.0
114.0
113.5
123.6
129.2
133.0
140.6
145.2
149.7
158.4
163.5
166.9
167.5
167.1
165.3
84.0
91.9
99.2
105.2
112.7
118.0
123.3
130.2
135.0
141.1
148.3
150.0
150.7
154.3
153.6
155.6
154.7
153.1
88.0
93.3
102.0
108.5
115.7
115.6
124.6
130.3
134.3
141.4
146.5
151.7
159.9
165.4
167.8
168.7
169.5
168.0
84.8
93.7
100.6
105.8
113.3
119.3
124.3
131.4
136.9
143.8
149.4
151.2
152.3
155.9
154.7
157.0
156.1
155.4
89.2
94.9
104.4
111.4
117.5
120.2
127.1
132.9
136.8
144.4
149.5
154.1
163.1
169.2
170.4
171.2
172.4
170.8
87.2
95.9
101.9
107.4
114.8
121.4
126.8
133.4
138.6
146.2
152.0
153.8
155.7
158.4
157.0
158.5
158.4
158.1
Centimeters
91.9
98.2
106.8
114.6
120.8
125.2
130.3
137.1
141.5
149.4
153.9
162.2
169.0
174.8
176.0
176.8
176.4
177.4
90.2
98.1
105.2
111.7
118.2
125.6
130.5
138.3
143.7
151.4
156.7
157.7
161.0
162.0
162.8
162.2
162.8
163.3
94.5
102.1
110.8
117.9
124.0
129.3
134.6
141.4
147.0
156.1
160.3
168.3
174.7
178.0
180.2
181.7
181.3
182.5
93.2
101.5
107.9
116.6
122.8
129.3
135.2
143.7
148.7
156.9
160.8
163.0
165.0
165.8
168.7
166.2
167.6
168.0
96.2
103.8
111.8
119.6
125.6
131.5
138.0
143.3
149.3
159.8
162.5
171.3
177.5
180.2
183.8
183.4
183.5
185.5
94.5
102.8
110.4
119.0
125.7
131.5
137.9
146.0
151.3
159.9
164.0
166.5
167.5
168.5
171.5
168.0
169.8
170.3
96.8
105.2
113.9
120.8
127.0
133.1
139.1
143.9
151.3
161.1
164.8
173.5
179.0
182.0
186.9
185.2
186.3
186.6
95.6
104.1
111.9
119.6
127.6
133.1
138.7
147.1
152.8
161.3
166.6
167.9
169.3
170.1
172.4
169.2
171.1
172.4
*
*
*
*
*
*
*
*
*
*
*
*
*
*
188.7
*
*
*
*
*
*
*
*
*
*
*
*
*
*
170.5
*
*
*
*
173.3
*
* Figure does not meet standards of reliability
1
Age shown is age at time of examination.
or precision.
Page 12 National Health Statistics Reports n Number 10 n October 22, 2008
Table 8. Height in inches for
selected percentiles: United
children and adolescents
States, 2003–2006
aged 2–19 years by sex and age, by mean, standard error of the mean, and
Number Standard
Percentile
1
Sex and age examined Mean error 5th 10th 15th 25th 50th 75th 85th 90th 95th
2 years
3 years
4 years
5 years
6 years
7 years
8 years
9 years
10 years
11 years
12 years
13 years
14 years
15 years
16 years
17 years
18 years
19 years
2 years
3 years
4 years
5 years
6 years
7 years
8 years
9 years
10 years
11 years
12 years
13 years
14 years
15 years
16 years
17 years
18 years
19 years
Male
Female
258
209
206
202
176
181
152
176
171
158
275
284
260
270
308
278
284
271
285
187
225
199
193
157
184
185
189
174
249
292
270
254
261
275
304
267
36.2
38.8
42.2
45.0
47.5
49.1
51.6
53.9
56.0
59.1
60.9
63.7
66.4
68.3
69.2
69.5
69.6
69.6
35.5
38.7
41.4
44.2
46.9
49.5
51.7
54.5
56.8
59.6
61.7
62.4
63.2
63.8
64.1
63.9
64.2
64.2
0.09
0.17
0.17
0.20
0.19
0.29
0.27
0.19
0.30
0.46
0.21
0.34
0.28
0.24
0.26
0.19
0.21
0.36
0.15
0.14
0.16
0.21
0.21
0.30
0.21
0.28
0.29
0.27
0.22
0.24
0.23
0.24
0.23
0.16
0.19
0.23
*
*
*
*
*
*
*
*
*
*
*
*
*
*
64.6
*
*
*
*
*
*
*
*
*
*
*
*
*
*
57.9
*
*
*
*
59.8
*
34.2
36.5
39.3
42.1
44.9
44.7
48.7
50.9
52.4
55.4
57.2
58.9
62.3
64.4
65.7
65.9
65.8
65.1
33.1
36.2
39.1
41.4
44.4
46.5
48.5
51.2
53.2
55.6
58.4
59.1
59.3
60.7
60.5
61.3
60.9
60.3
34.7
36.7
40.1
42.7
45.5
45.5
49.0
51.3
52.9
55.7
57.7
59.7
63.0
65.1
66.1
66.4
66.7
66.1
33.4
36.9
39.6
41.6
44.6
47.0
48.9
51.7
53.9
56.6
58.8
59.5
60.0
61.4
60.9
61.8
61.5
61.2
35.1
37.4
41.1
43.9
46.3
47.3
50.0
52.3
53.9
56.8
58.9
60.7
64.2
66.6
67.1
67.4
67.9
67.3
34.3
37.8
40.1
42.3
45.2
47.8
49.9
52.5
54.6
57.6
59.8
60.5
61.3
62.4
61.8
62.4
62.3
62.2
Inches
36.2
38.7
42.1
45.1
47.6
49.3
51.3
54.0
55.7
58.8
60.6
63.9
66.5
68.8
69.3
69.6
69.4
69.8
35.5
38.6
41.4
44.0
46.6
49.5
51.4
54.5
56.6
59.6
61.7
62.1
63.4
63.8
64.1
63.8
64.1
64.3
37.2
40.2
43.6
46.4
48.8
50.9
53.0
55.7
57.9
61.4
63.1
66.3
68.8
70.1
71.0
71.5
71.4
71.8
36.7
40.0
42.5
45.9
48.4
50.9
53.2
56.6
58.5
61.8
63.3
64.2
65.0
65.3
66.4
65.4
66.0
66.1
37.9
40.9
44.0
47.1
49.4
51.8
54.3
56.4
58.8
62.9
64.0
67.4
69.9
70.9
72.4
72.2
72.2
73.0
37.2
40.5
43.5
46.8
49.5
51.8
54.3
57.5
59.6
63.0
64.6
65.6
65.9
66.3
67.5
66.1
66.8
67.0
38.1
41.4
44.8
47.6
50.0
52.4
54.8
56.6
59.6
63.4
64.9
68.3
70.5
71.7
73.6
72.9
73.3
73.5
37.6
41.0
44.1
47.1
50.2
52.4
54.6
57.9
60.1
63.5
65.6
66.1
66.7
67.0
67.9
66.6
67.3
67.9
*
*
*
*
*
*
*
*
*
*
*
*
*
*
74.3
*
*
*
*
*
*
*
*
*
*
*
*
*
*
67.1
*
*
*
*
68.2
*
* Figure does not meet standards of reliability or precision.
1
Age shown is age at time of examination.
National Health Statistics Reports n Number 10 n October 22, 2008 Page 13
Table 9. Height in centimeters for females 20 years of age
mean, and selected percentiles: United States, 2003–2006
and older by race and ethnicity and age, by mean, standard error of the
Number Standard
Percentile
Race and ethnicity and age examined Mean error 5th 10th 15th 25th 50th 75th 85th 90th 95th
1
All race and ethnicity groups
20 years and over
20–29 years
30–39 years
40–49 years
50–59 years
60–69 years
70–79 years
80 years and over
Non-Hispanic white
20 years and over
20–39 years
40–59 years
60 years and over
Non-Hispanic black
20 years and over
20–39 years
40–59 years
60 years and over
Mexican American
20 years and over
20–39 years
40–59 years
60 years and over
4,857
1,061
842
784
604
691
463
412
2,477
866
677
934
1,035
407
355
273
975
455
238
282
162.2
163.2
163.2
163.1
162.2
161.8
159.2
156.0
163.0
164.8
163.6
160.2
162.7
163.2
163.2
160.6
157.8
158.7
157.7
153.9
0.16
0.31
0.32
0.29
0.34
0.33
0.34
0.37
0.15
0.22
0.27
0.27
0.26
0.43
0.40
0.32
0.24
0.32
0.48
0.48
150.7
152.2
152.4
152.1
150.7
151.9
149.0
146.2
152.1
154.7
152.6
149.7
151.5
151.6
152.2
150.0
147.3
148.2
*
144.9
153.3
154.8
154.4
153.9
153.3
153.8
150.9
148.0
154.4
157.2
155.5
152.0
153.9
154.7
154.1
152.6
149.8
150.7
149.9
145.9
154.9
156.5
156.2
155.8
155.4
155.1
152.6
149.4
156.3
158.6
157.5
153.6
155.5
156.3
155.9
153.6
151.1
152.5
151.1
147.4
157.7
158.7
158.9
158.5
158.1
157.6
155.0
151.7
158.7
160.7
159.4
155.9
158.2
158.5
158.7
156.2
153.6
154.6
153.5
150.1
Centimeters
162.2
163.0
163.0
163.1
162.1
161.9
159.0
155.8
163.0
164.7
163.4
159.8
162.7
163.0
163.5
160.5
157.8
159.0
157.6
154.0
166.7
167.9
167.6
167.6
166.8
165.9
163.7
159.7
167.5
168.9
167.7
164.5
167.0
167.3
167.5
165.2
161.9
162.6
161.7
158.1
169.1
169.8
170.4
169.8
168.7
168.0
165.5
162.3
169.7
171.1
169.9
166.7
169.6
170.1
169.7
166.8
164.3
165.0
164.0
159.7
170.8
171.4
172.0
171.9
170.3
170.0
167.4
164.3
171.3
172.4
171.8
168.6
171.0
171.8
171.2
169.0
166.2
166.6
165.8
161.6
173.1
172.8
174.2
174.0
172.4
171.5
169.4
166.1
173.6
174.4
174.0
170.5
173.8
174.5
173.7
170.5
168.1
168.9
*
164.3
* Figure does not
1
Persons of other
meet standards of reliability or precision.
races and unknown race and ethnicity are included.
Page 14 National Health Statistics Reports n Number 10 n October 22, 2008
Table 10. Height in inches for females 20 years of age
and selected percentiles: United States 2003–2006
and older by race and ethnicity and age, by mean, standard error of the mean,
Number Standard
Percentile
Race and ethnicity and age examined Mean error 5th 10th 15th 25th 50th 75th 85th 90th 95th
1
All race and ethnicity groups
20 years and over
20–29 years
30–39 years
40–49 years
50–59 years
60–69 years
70–79 years
80 years and over
Non-Hispanic white
20 years and over
20–39 years
40–59 years
60 years and over
Non-Hispanic black
20 years and over
20–39 years
40–59 years
60 years and over
Mexican American
20 years and over
20–39 years
40–59 years
60 years and over
4,857
1,061
842
784
604
691
463
412
2,477
866
677
934
1,035
407
355
273
975
455
238
282
63.8
64.3
64.3
64.2
63.9
63.7
62.7
61.4
64.2
64.9
64.4
63.1
64.1
64.3
64.3
63.2
62.1
62.5
62.1
60.6
0.06
0.12
0.13
0.12
0.13
0.13
0.13
0.15
0.06
0.09
0.11
0.11
0.10
0.17
0.16
0.12
0.10
0.13
0.19
0.19
59.3
59.9
60.0
59.9
59.3
59.8
58.6
57.5
59.9
60.9
60.1
58.9
59.7
59.7
59.9
59.1
58.0
58.3
*
57.1
60.3
60.9
60.8
60.6
60.4
60.5
59.4
58.3
60.8
61.9
61.2
59.8
60.6
60.9
60.7
60.1
59.0
59.3
59.0
57.4
61.0
61.6
61.5
61.4
61.2
61.1
60.1
58.8
61.5
62.4
62.0
60.5
61.2
61.5
61.4
60.5
59.5
60.1
59.5
58.0
62.1
62.5
62.5
62.4
62.2
62.1
61.0
59.7
62.5
63.3
62.8
61.4
62.3
62.4
62.5
61.5
60.5
60.9
60.4
59.1
Inches
63.8
64.2
64.2
64.2
63.8
63.7
62.6
61.3
64.2
64.8
64.3
62.9
64.0
64.2
64.4
63.2
62.1
62.6
62.0
60.6
65.6
66.1
66.0
66.0
65.7
65.3
64.4
62.9
66.0
66.5
66.0
64.8
65.8
65.9
65.9
65.0
63.7
64.0
63.7
62.2
66.6
66.9
67.1
66.9
66.4
66.1
65.2
63.9
66.8
67.4
66.9
65.6
66.8
67.0
66.8
65.7
64.7
64.9
64.6
62.9
67.2
67.5
67.7
67.7
67.1
66.9
65.9
64.7
67.5
67.9
67.6
66.4
67.3
67.6
67.4
66.5
65.4
65.6
65.3
63.6
68.2
68.0
68.6
68.5
67.9
67.5
66.7
65.4
68.4
68.7
68.5
67.1
68.4
68.7
68.4
67.1
66.2
66.5
*
64.7
* Figure does not
1
Persons of other
meet standards of reliability or precision.
races and unknown race and ethnicity are included.
National Health Statistics Reports n Number 10 n October 22, 2008 Page 15
Table 11. Height in centimeters for males 20 years of age and older by race and ethnicity and age, by mean, standard error of the mean,
and selected percentiles: United States 2003–2006
Percentile
Number Standard
Race and ethnicity and age examined Mean error 5th 10th 15th 25th 50th 75th 85th 90th 95th
All race and ethnicity groups
1
Centimeters
20 years and over 4,482 176.3 0.17 163.6 166.6 168.4 171.3 176.3 181.5 184.4 186.0 188.7
20–29 years 808 177.6 0.34 164.2 167.1 169.3 172.3 177.8 183.0 185.3 186.8 190.1
30–39 years 742 176.4 0.33 162.7 165.9 167.9 171.4 176.4 181.5 184.6 186.4 189.6
40–49 years 769 177.1 0.28 165.6 168.2 169.8 172.3 177.0 181.8 184.6 186.2 188.0
50–59 years 591 176.6 0.38 165.1 167.2 168.8 171.4 176.6 181.5 184.6 186.5 189.1
60–69 years 668 175.4 0.28 163.1 166.2 167.8 170.5 175.3 180.7 182.7 184.8 187.2
70–79 years 555 173.8 0.41 162.1 164.1 166.3 168.6 174.0 178.5 180.4 182.9 185.7
80 years and over 349 170.7 0.36 159.2 161.7 163.4 166.4 170.7 175.0 177.8 179.0 181.2
Non-Hispanic white
20 years and over 2,331 177.5 0.20 166.0 168.5 170.2 172.6 177.4 182.4
184.9 186.5 189.1
20–39 years 664 178.9 0.25 167.4 170.1 171.9 174.4 178.9 183.4 185.7 187.7 190.3
40–59 years 710 178.0 0.35 167.3 169.2 170.8 173.1 177.9 182.8 185.2 186.6 188.8
60 years and over 957 174.6 0.20 162.6 165.2 167.1 169.8 174.6 179.7 182.2 183.7 186.4
Non-Hispanic black
20 years and over 943 177.2 0.20 165.4 167.8 169.8 172.3 177.0 181.9 184.7 186.4 189.6
20–39 years 361 178.0 0.35 166.3 167.9 170.1 173.1 177.7 183.0 185.2 187.1 190.6
40–59 years 316 177.4 0.33 166.0 168.6 170.3 172.7 177.2 181.6 184.5 186.6 189.0
60 years and over 266 174.3 0.52 163.0 164.7 166.8 169.4 174.0 179.1 181.8 183.5 185.7
Mexican American
20 years and over 902 170.3 0.34 158.7 161.1 163.0 165.2 170.4 174.9 177.0 178.9 182.0
20–39 years 375 170.6 0.46 158.3 161.2 163.3 165.3 170.6 175.2 177.6 180.5 183.7
40–59 years 246 170.2 0.40 159.4 161.4 163.3 165.6 170.8 174.9 176.3 178.1 180.1
60 years and over 281 167.8 0.42 157.7 159.4 160.8 163.4 167.8 172.4 173.7 175.1 176.9
1
Persons of other races and unknown race and ethnicity are included.
Page 16 National Health Statistics Reports n Number 10 n October 22, 2008
Table 12. Height in inches for males 20 years of age and older by race and ethnicity and age, by mean, standard error of the mean, and
selected percentiles: United States 2003–2006
Percentile
Number Standard
Race and ethnicity and age examined Mean error 5th 10th 15th 25th 50th 75th 85th 90th 95th
All race and ethnicity groups
1
Inches
20 years and over 4,482 69.4 0.07 64.4 65.6 66.3 67.4 69.4 71.5 72.6 73.2 74.3
20–29 years 808 69.9 0.13 64.7 65.8 66.6 67.8 70.0 72.0 73.0 73.5 74.8
30–39 years 742 69.4 0.13 64.1 65.3 66.1 67.5 69.5 71.5 72.7 73.4 74.7
40–49 years 769 69.7 0.11 65.2 66.2 66.8 67.9 69.7 71.6 72.7 73.3 74.0
50–59 years 591 69.5 0.15 65.0 65.8 66.5 67.5 69.5 71.5 72.7 73.4 74.4
60–69 years 668 69.0 0.11 64.2 65.4 66.1 67.1 69.0 71.1 71.9 72.7 73.7
70–79 years 555 68.4 0.16 63.8 64.6 65.5 66.4 68.5 70.3 71.0 72.0 73.1
80 years and over 349 67.2 0.14 62.7 63.6 64.3 65.5 67.2 68.9 70.0 70.5 71.3
Non-Hispanic white
20 years and over 2,331 69.9 0.08 65.4 66.3 67.0 68.0 69.8 71.8
72.8 73.4 74.5
20–39 years 664 70.4 0.10 65.9 67.0 67.7 68.6 70.4 72.2 73.1 73.9 74.9
40–59 years 710 70.1 0.14 65.9 66.6 67.3 68.2 70.0 72.0 72.9 73.5 74.3
60 years and over 957 68.8 0.08 64.0 65.0 65.8 66.8 68.8 70.7 71.7 72.3 73.4
Non-Hispanic black
20 years and over 943 69.8 0.08 65.1 66.1 66.9 67.8 69.7 71.6 72.7 73.4 74.6
20–39 years 361 70.1 0.14 65.5 66.1 67.0 68.1 70.0 72.0 72.9 73.7 75.1
40–59 years 316 69.8 0.13 65.4 66.4 67.0 68.0 69.8 71.5 72.7 73.5 74.4
60 years and over 266 68.6 0.20 64.2 64.9 65.7 66.7 68.5 70.5 71.6 72.2 73.1
Mexican American
20 years and over 902 67.0 0.13 62.5 63.4 64.2 65.0 67.1 68.8 69.7 70.5 71.6
20–39 years 375 67.2 0.18 62.3 63.5 64.3 65.1 67.1 69.0 69.9 71.1 72.3
40–59 years 246 67.0 0.16 62.8 63.6 64.3 65.2 67.2 68.9 69.4 70.1 70.9
60 years and over 281 66.1 0.17 62.1 62.7 63.3 64.3 66.1 67.9 68.4 68.9 69.6
1
Persons of other races and unknown race and ethnicity are included.
National Health Statistics Reports n Number 10 n October 22, 2008 Page 17
Table 13. Body mass index values for children and adolescents aged 2–19 years by sex and age, by mean, standard error of the mean,
and selcted percentiles: United States 2003–2006
Percentile
Number Standard
Sex and age
1
examined Mean error 5th 10th 15th 25th 50th 75th 85th 90th 95th
Male Body mass index
2 years 258 16.8 0.10 15.1 15.3 15.6 15.8 16.6 17.6 18.1 18.3 19.2
3 years 209 16.2 0.11 * 14.5 14.8 15.3 16.2 16.9 17.2 17.6 *
4 years 206 16.2 0.14 * 14.1 14.3 14.8 16.0 16.9 17.7 18.4 *
5 years 202 16.8 0.25 * 14.2 14.5 14.9 16.0 17.5 18.5 19.5 *
6 years 176 16.5 0.15 * 14.2 14.7 15.0 16.1 17.4 18.7 19.1 *
7 years 181 16.9 0.24 * 14.3 14.7 15.1 16.2 17.6 19.3 20.0 *
8 years 151 18.1 0.35 * 14.6 15.0 15.5 17.2 19.1 20.8 22.5 *
9 years 176 18.4 0.34 * 14.7 15.1 15.7 17.3 20.3 21.6 22.7 *
10 years 171 19.6 0.33 * 15.5 15.7 16.5 18.0 21.8 24.4
26.0 *
11 years 158 20.5 0.54 * 15.9 16.5 16.9 18.3 22.8 26.6 27.4 *
12 years 275 21.0 0.44 15.2 16.0 16.6 17.3 19.7 23.2 25.8 28.1 31.8
13 years 284 21.8 0.40 15.7 16.8 17.3 17.8 20.8 24.0 25.9 28.5 31.5
14 years 260 22.0 0.51 16.4 17.2 17.5 18.5 20.9 23.8 26.4 29.1 32.4
15 years 270 23.2 0.36 17.7 17.9 18.7 19.7 21.9 25.0 27.7 30.5 31.6
16 years 308 24.5 0.43 17.5 18.9 19.4 20.3 22.6 27.7 30.6 32.7 35.5
17 years 278 24.0 0.45 18.3 18.8 19.0 20.0 22.4 26.7 29.4 31.3 34.0
18 years 283 24.6 0.54 17.7 19.0 19.6 20.9 23.1 27.5 30.2 31.7 36.3
19 years 271 25.6 0.53 18.4 19.3 20.1 21.6 24.2 28.6 31.7 34.0 36.4
Female
2 years 285 16.6 0.11 * 14.7 15.1 15.4 16.3 17.4 18.3 18.7 *
3 years
187 16.3 0.18 * 14.5 14.8 15.1 15.9 16.9 18.0 19.0 *
4 years 224 16.1 0.14 * 14.3 14.6 15.0 15.8 16.7 17.1 18.0 *
5 years 199 16.2 0.19 * 14.3 14.5 14.9 15.5 16.9 18.1 18.9 *
6 years 193 16.4 0.21 * 14.1 14.5 14.8 15.9 17.3 18.4 19.4 *
7 years 157 17.1 0.26 * 14.4 14.8 15.2 16.4 18.2 19.6 20.5 *
8 years 184 17.6 0.42 * 14.2 14.6 15.1 16.6 18.7 21.5 22.8 *
9 years 185 18.9 0.36 * 15.1 15.5 15.9 18.1 21.1 22.6 24.4 *
10 years 189 20.2 0.40 * 15.3 15.7 16.5 19.3 22.4 25.7 26.9 *
11 years 174 21.3 0.47 * 15.9 16.3 17.6 20.6 23.9 26.1 28.4 *
12 years 249 21.4 0.45 * 15.5 16.9 18.0 20.0 23.1 27.5 29.0 *
13 years 292 22.7 0.35
* 17.0 17.8 18.9 21.4 25.8 28.1 30.1 *
14 years 269 22.8 0.62 * 17.7 18.1 18.6 21.2 25.2 28.9 31.0 *
15 years 247 23.2 0.28 * 18.3 18.7 19.7 22.1 25.8 27.3 29.4 *
16 years 253 23.2 0.39 * 18.5 19.1 20.1 21.5 25.0 27.4 30.1 *
17 years 252 25.0 0.60 * 19.1 19.5 20.7 22.9 27.4 30.8 32.7 *
18 years 271 25.4 0.80 * 18.5 19.1 20.7 23.5 28.2 33.1 34.7 *
19 years 238 25.3 0.64 * 19.6 20.1 21.1 23.6 27.4 31.1 33.7 *
* Figure does not meet standards of reliability or precision.
1
Age shown is age at time of examination.
NOTE: Pregnant females were excluded. Body mass index (BMI) is calculated as follows: BMI = weight(kilograms)/height(meters
2
).
Page 18 National Health Statistics Reports n Number 10 n October 22, 2008
Table 14. Body mass index values for females 20 years of age and older by race and ethnicity and age, by mean, standard error of the
mean, and selected percentiles: United States 2003–2006
Percentile
Number Standard
Race and ethnicity and age examined Mean error 5th 10th 15th 25th 50th 75th 85th 90th 95th
All race and ethnicity groups
1
Body mass index
20 years and over 4,313 28.4 0.19 19.4 20.7 21.6 23.1 26.9 32.2 35.5 38.1 41.6
20–29 years 705 26.5 0.36 18.2 19.4 20.1 21.4 24.4 30.0 33.4 35.9 41.3
30–39 years 663 28.1 0.38 19.4 20.3 21.2 22.9 26.1 32.2 35.4 37.9 41.2
40–49 years 778 29.2 0.39 19.8 21.2 21.9 23.6 27.5 33.4 36.9 38.9 43.5
50–59 years 602 29.6 0.39 20.2 21.3 22.4 23.9 28.3 33.9 37.7 40.2 44.1
60–69 years 691 29.5 0.33 20.6 22.1 23.2 24.7 28.1 32.9 36.1 37.9 42.0
70–79 years 463 27.8 0.40 19.6 21.1 22.5 24.0 27.0 30.9 33.1 35.8 39.6
80 years and over 411 26.4 0.27 19.7 20.8 21.7 23.1 26.0 29.6 31.7 33.0 34.3
Non-Hispanic white
20 years and over 2,222
27.9 0.22 19.3 20.5 21.4 22.9 26.4 31.6 34.9 37.3 41.1
20–39 years 615 26.5 0.36 19.0 19.6 20.4 21.6 24.5 30.1 33.8 36.0 40.4
40–59 years 673 29.0 0.35 19.8 21.0 21.7 23.5 27.3 33.3 36.5 38.8 43.0
60 years and over 934 28.0 0.21 19.8 21.3 22.4 24.0 27.1 31.0 33.4 35.8 39.6
Non-Hispanic black
20 years and over 956 31.6 0.28 20.5 22.2 23.7 25.9 30.5 36.2 39.7 41.4 46.4
20–39 years 328 30.8 0.46 19.8 21.3 22.5 24.8 29.4 35.1 39.5 40.9 45.4
40–59 years 355 32.4 0.33 20.6 23.3 24.8 27.1 30.8 37.4 40.4 43.2 47.3
60 years and over 273 31.8 0.44 22.1 23.1 24.0 26.0 31.0 35.9 38.3 41.2 46.4
Mexican American
20 years and over 815 29.5 0.37 20.8 22.1 22.8 24.6 28.2 33.2 36.3 38.1 42.6
20–39 years 300 28.8 0.47 20.2 21.3 22.1 23.6 27.7 32.8
35.2 37.8 42.5
40–59 years 234 30.7 0.50 22.0 23.0 23.8 25.2 29.9 34.6 37.6 39.0 43.1
60 years and over 281 29.2 0.44 21.9 22.7 23.6 25.1 28.2 32.4 34.5 36.1 40.2
1
Persons of other races and unknown race and ethnicity are included.
NOTE: Pregnant females were excluded. Body mass index (BMI) is calculated as follows: BMI = weight(kilograms)/height(meters
2
).
National Health Statistics Reports n Number 10 n October 22, 2008 Page 19
Table 15. Body mass index values for males 20 years of age and older by race and ethnicity and age, by mean, standard error of the
mean, and selected percentiles: United States 2003–2006
Percentile
Number Standard
Race and ethnicity and age examined Mean error 5th 10th 15th 25th 50th 75th 85th 90th 95th
All race and ethnicity groups
1
Body mass index
20 years and over 4,474 28.4 0.14 20.8 22.1 23.1 24.6 27.7 31.2 33.4 35.3 38.6
20–29 years 808 27.0 0.31 19.2 20.7 21.7 23.1 25.8 30.1 32.6 34.2 38.9
30–39 years 741 28.2 0.23 21.0 22.3 23.1 24.5 27.6 31.0 32.9 34.7 37.7
40–49 years 768 29.2 0.26 22.1 23.1 24.0 25.5 28.4 31.9 34.1 36.0 38.8
50–59 years 590 28.9 0.27 21.1 22.4 23.6 25.3 28.1 31.7 34.3 36.5 39.3
60–69 years 665 29.2 0.29 21.5 23.1 24.1 25.8 28.6 32.0 34.2 36.2 38.5
70–79 years 554 28.1 0.25 21.1 22.3 23.5 24.8 27.6 30.9 32.8 34.2 36.5
80 years and over 348 26.2 0.19 19.7 21.0 21.7 23.1 26.1 28.7 30.4 31.8 33.3
Non-Hispanic white
20 years and over 2,328
28.4 0.16 20.9 22.2 23.1 24.7 27.7 31.2 33.6 35.4 38.6
20–39 years 664 27.4 0.26 20.1 21.4 22.2 23.5 26.4 30.2 32.6 34.2 37.3
40–59 years 708 29.2 0.26 21.6 23.0 24.0 25.5 28.4 31.8 34.3 36.4 39.2
60 years and over 956 28.6 0.16 21.2 22.7 23.9 25.2 28.1 31.2 33.2 35.2 37.8
Non-Hispanic black
20 years and over 939 28.8 0.30 20.5 21.5 22.8 24.4 27.5 32.0 34.6 36.7 41.4
20–39 years 360 28.9 0.45 20.2 20.8 22.1 24.0 27.8 32.0 34.8 38.2 42.4
40–59 years 316 28.9 0.37 21.3 22.4 23.1 24.7 27.3 32.0 34.6 36.9 41.3
60 years and over 263 28.1 0.30 20.4 21.6 22.9 24.4 27.3 31.5 33.6 35.1 38.0
Mexican American
20 years and over 901 28.2 0.26 21.2 22.8 23.5 24.9 27.7 30.6 32.4 34.0 37.1
20–39 years 375 28.1 0.36 20.8 22.4 23.2 24.7 27.7 30.7
32.8 34.0 37.7
40–59 years 246 28.3 0.31 21.9 23.4 24.1 25.7 27.9 30.5 31.6 33.0 36.2
60 years and over 280 28.2 0.33 21.5 23.0 23.7 24.9 27.5 30.7 33.0 34.6 36.2
1
Persons of other races and unknown race and ethnicity are included.
NOTE: Body mass index (BMI) is calculated as follows: BMI = weight(kilograms)/height(meters
2
).
Table 16. Head circumference in centimeters for infants from birth through 6 months of age by sex and age, by mean, standard
error of the mean, and selected percentiles: United States 2003–2006
Percentile
Number Standard
5th 10th 15th 25th 50th
Centimeters
75th
85th 90th 95th
1
Sex and age
Male
examined Mean error
Birth–2months 100 39.1 0.21 * * 37.4 37.9 39.0 40.5 40.8 * *
3–5months 137 42.9 0.17 * 40.6 41.2 41.7 42.8 43.8 44.6 44.7 *
6months 44 44.2 0.34 * * * * * * * * *
Female
Birth–2months 81 38.4 0.18 * * 37.1 37.5 38.4 39.2 39.7 * *
3–5months 93 41.3 0.16 * * 39.6 40.3 41.5 42.4 42.6 * *
6months
* Figure does not meet standards of reliability or
41
precision.
43.2 0.30 * * * * * * * * *
1
Age shown is age at time of examination.
Page 20 National Health Statistics Reports n Number 10 n October 22, 2008
Table 17. Recumbent length in centimeters for children from birth through 47 months of age by sex and age, by mean, standard
error of the mean, and selected percentiles: United States 2003–2006
Percentile
Number Standard
Sex and age
1
examined Mean error 5th 10th 15th 25th 50th 75th 85th 90th 95th
Male Centimeters
0–2 months 100 56.9 0.42 * * 53.2 54.7 57.0 59.7 60.5 * *
3–5 months 139 64.4 0.39 * 60.8 61.1 62.3 64.3 66.5 67.3 68.1 *
6–8 months 130 69.2 0.36 * 64.8 65.6 67.3 69.2 71.5 72.2 73.0 *
9–11 months 123 73.8 0.33 * 70.4 70.9 71.6 74.0 75.4 76.8 77.3 *
12–23 months 353 82.3 0.30 74.7 76.4 77.4 78.6 82.3 85.9 87.5 88.6 91.1
24–35 months 268 92.4 0.28 85.5 87.3 88.1 89.6 92.3 95.1 96.7 97.9 99.2
36–47 months 198 99.4 0.42 * 93.3 93.8 95.9 99.2 102.9 104.4 106.0 *
Female
0–2 months 80 56.5 0.62 * * * 54.3 56.0 57.9 * * *
3–5 months 94 63.1 0.36 *
* 59.7 61.5 63.5 64.9 65.8 * *
6–8 months 121 67.8 0.35 * * 65.1 66.3 67.9 69.2 70.5 * *
9–11 months 125 71.6 0.27 * * 68.4 70.1 71.9 73.4 74.2 * *
12–23 months 324 80.5 0.29 73.3 75.0 75.7 76.8 80.6 84.0 85.2 86.3 88.1
24–35 months 312 90.4 0.40 82.3 84.0 84.9 87.0 90.3 93.9 95.6 96.3 97.8
36–47 months 183 99.5 0.37 * 93.2 95.2 97.0 99.4 102.2 103.8 105.1 *
* Figure does not meet standards of reliablilty or precision.
1
Age shown is age at time of examination.
National Health Statistics Reports n Number 10 n October 22, 2008 Page 21
Table 18. Waist circumference in centimeters for children and adolescents aged 2–19 years by sex and age, by mean, standard
error of the mean, and selected percentiles: United States 2003–2006
Percentile
Number Standard
Sex and age
1
examined Mean error 5th 10th 15th 25th 50th 75th 85th 90th 95th
Male Centimeters
2 years 231 48.7 0.25 * 45.0 45.4 46.4 48.3 50.9 51.9 52.8 *
3 years 199 50.2 0.30 * 45.9 46.5 47.7 50.0 52.3 53.4 54.3 *
4 years 199 52.3 0.40 * 47.4 47.9 49.0 51.5 54.3 55.8 58.0 *
5 years 198 56.5 0.73 * 49.4 50.4 51.4 54.4 58.3 60.8 64.1 *
6 years 174 57.0 0.46 * 50.8 52.3 53.0 55.5 59.4 63.0 65.7 *
7 years 177 58.9 0.77 * 51.8 52.4 53.4 56.5 61.9 65.8 69.7 *
8 years 146 63.2 1.11 * 53.7 54.8 56.3 59.7 67.3 72.1 81.0 *
9 years 173 64.9 0.91 * 55.0 55.5 57.0 63.0 68.8 75.5 77.0 *
10 years 171 69.1 0.93 * 57.4 58.0 60.0 65.4 76.3 81.9 86.2 *
11 years 153 72.9 1.63 * 58.2 60.3 61.6 67.4 83.1
89.5 93.5 *
12 years 272 75.3 1.17 59.1 60.9 62.0 64.6 71.2 82.5 88.5 91.5 107.9
13 years 282 77.9 1.13 62.2 63.7 64.9 66.8 74.6 84.2 89.4 97.4 107.1
14 years 257 78.3 1.34 63.4 65.7 66.9 68.6 73.8 82.9 93.5 99.4 103.0
15 years 266 81.3 0.92 66.5 68.1 69.4 72.1 78.2 86.9 92.8 98.9 104.3
16 years 303 85.5 1.12 68.1 70.4 71.1 74.3 79.0 94.3 105.0 109.8 114.5
17 years 272 83.9 0.87 68.8 70.7 71.6 74.1 79.0 90.4 99.5 105.2 110.7
18 years 277 86.3 1.44 69.6 70.9 72.5 75.2 81.3 95.4 103.4 107.1 116.4
19 years 262 88.1 1.27 70.0 72.2 74.0 76.5 83.5 96.8 106.0 110.9 118.6
Female
2 years 269 48.4 0.29 * 43.4 44.5 45.4 48.3 50.5 52.5 53.5 *
3 years 177 50.5 0.36 * 46.0 46.5 47.9 49.6 51.7 54.1 54.8
*
4 years 223 52.6 0.34 * 47.5 48.4 49.6 52.3 54.6 55.7 57.2 *
5 years 194 54.9 0.64 * 49.0 49.6 50.7 53.0 57.1 60.8 63.4 *
6 years 188 56.2 0.50 * 49.8 50.6 52.0 55.1 58.9 61.6 63.1 *
7 years 154 60.0 0.85 * 52.5 53.1 55.0 57.9 62.6 67.8 71.0 *
8 years 179 62.6 1.19 * 52.8 53.5 54.8 58.8 65.9 75.5 80.1 *
9 years 183 67.5 1.06 * 56.3 57.8 59.7 64.5 72.8 77.9 80.5 *
10 years 183 71.4 1.02 * 58.6 60.1 62.3 69.1 77.9 84.1 86.0 *
11 years 172 75.1 1.13 * 61.0 61.8 65.1 72.5 82.5 90.3 92.5 *
12 years 242 75.3 1.06 * 60.6 63.6 66.1 73.6 80.6 89.2 94.3 *
13 years 289 78.4 0.88 61.8 65.0 65.9 69.1 75.5 84.7 94.3 97.8 100.1
14 years 265 79.1
1.50
* 66.7 67.9 70.1 74.8 85.8 91.8 99.2 *
15 years 237 80.4 0.90 * 67.2 69.6 71.6 76.7 87.8 92.6 99.0 *
16 years 248 79.9 0.98 * 67.9 69.7 71.7 77.2 84.7 91.6 98.6 *
17 years 244 83.4 1.23 * 68.5 71.1 74.1 79.0 87.7 98.7 101.3 *
18 years 268 84.0 1.52 * 68.5 70.6 73.2 80.5 90.5 100.7 106.6 *
19 years 230 85.8 1.71 * 69.5 71.5 73.6 81.3 92.7 102.9 107.8 *
* Figure does not meet standards of reliability or precision.
1
Age shown is age at time of examination.
NOTE: Pregnant females were excluded.
Page 22 National Health Statistics Reports n Number 10 n October 22, 2008
Table 19. Waist circumference in centimeters for females 20 years of age and older by race and ethnicity and age, by mean, standard
error of the mean, and selected percentiles: United States 2003–2006
Percentile
Number Standard
Race and ethnicity and age examined Mean error 5th 10th 15th 25th 50th 75th 85th 90th 95th
All race and ethnicity groups
1
Centimeters
20 years and over 4,134 94.1 0.44 71.9 74.8 77.4 81.8 92.0 104.0 110.8 115.6 123.3
20–29 years 680 88.2 0.90 68.6 71.7 73.1 75.8 84.3 96.7 106.1 113.5 119.5
30–39 years 648 91.6 0.92 71.6 74.1 76.2 79.6 89.3 100.2 106.9 111.8 121.1
40–49 years 767 95.2 0.75 72.9 76.2 79.3 83.7 92.6 105.4 111.4 116.8 125.5
50–59 years 582 96.9 0.92 72.3 76.3 78.8 84.8 95.4 108.1 113.8 117.7 127.7
60–69 years 670 98.6 0.62 75.7 79.8 82.8 88.1 97.1 108.8 114.8 118.9 123.8
70–79 years 441 96.2 0.91 72.6 79.0 82.6 87.5 96.1 103.9 109.7 113.1 120.8
80 years and over 346 94.0 0.72 74.9 78.6 80.8 86.1 93.9 101.6 105.5 109.3 112.8
Non-Hispanic white
20 years and over 2,127 93.7 0.54 71.8 74.3 76.8 81.5 91.7 103.6
110.4 115.2 122.6
20–39 years 599 88.9 0.90 70.2 72.8 74.0 76.9 85.2 97.4 105.3 112.3 119.9
40–59 years 664 95.4 0.73 72.0 75.3 78.0 83.2 93.3 105.9 111.9 116.9 125.6
60 years and over 864 96.6 0.51 74.7 78.8 82.0 87.3 96.0 104.9 110.6 114.9 121.5
Non-Hispanic black
20 years and over 906 99.2 0.55 73.6 77.7 81.0 87.0 97.4 110.2 116.5 121.7 129.5
20–39 years 315 95.8 1.04 70.9 74.6 77.3 81.8 93.4 107.3 114.4 119.1 128.2
40–59 years 343 101.2 0.73 75.9 81.3 85.6 89.2 99.7 111.6 117.3 123.5 131.4
60 years and over 248 102.4 0.75 79.4 83.5 86.4 91.1 100.9 112.4 118.8 121.9 128.5
Mexican American
20 years and over 790 95.8 0.79 75.9 78.6 80.9 85.2 94.1 104.3 110.0 114.7 121.2
20–39 years 292 93.8 0.93 74.6 77.3 79.7 83.4 91.7 102.9 107.8 112.0 120.5
40–59 years 228 98.2 1.07 77.4 80.5 83.1 88.1 96.5 107.0 112.7 116.1
123.6
60 years and over 270 98.4 0.82 80.1 83.1 87.0 90.0 97.4 106.4 111.5 113.1 121.2
1
Persons of other races and unknown race and ethnicity are included.
NOTE: Pregnant females were excluded.
National Health Statistics Reports n Number 10 n October 22, 2008 Page 23
Table 20. Waist circumference in centimeters for males 20 years of age and older by race and ethnicity and age, by mean, standard
error of the mean, and selected percentiles: United States 2003–2006
Percentile
Number Standard
Race and ethnicity and age examined Mean error 5th 10th 15th 25th 50th 75th 85th 90th 95th
All race and ethnicity groups
1
Centimeters
20 years and over 4,310 100.8 0.43 78.6 82.6 85.9 90.4 99.6 109.8 115.0 119.2 127.8
20–29 years 783 93.8 0.80 73.5 76.8 78.8 82.8 90.9 101.3 108.4 113.3 123.9
30–39 years 715 98.2 0.63 78.9 81.9 85.1 88.9 96.8 105.7 111.4 115.0 120.7
40–49 years 750 102.9 0.66 82.4 86.6 89.3 93.4 101.8 111.4 115.3 119.6 128.6
50–59 years 564 103.9 0.69 83.6 87.1 90.2 94.0 102.9 111.1 117.3 122.3 129.7
60–69 years 649 106.7 0.74 84.6 90.2 93.0 97.5 105.5 115.6 120.8 124.6 129.9
70–79 years 530 105.4 0.73 84.8 88.9 91.8 96.1 104.4 113.5 118.3 121.9 129.1
80 years and over 319 100.4 0.38 82.1 84.9 88.4 92.5 100.2 108.0 112.9 116.0 119.4
Non-Hispanic white
20 years and over 2,242 102.0 0.45 80.2 84.2 87.0 91.6 101.0 110.7
116.1 120.0 128.7
20–39 years 652 96.5 0.63 76.7 79.9 81.9 86.0 94.1 104.1 110.6 114.1 123.4
40–59 years 686 104.3 0.65 84.2 88.2 90.5 95.1 103.1 112.0 117.0 122.3 130.4
60 years and over 904 106.3 0.41 85.7 90.2 93.0 96.9 105.1 114.7 118.9 123.3 129.8
Non-Hispanic black
20 years and over 899 98.3 0.73 74.2 78.4 81.5 86.8 95.9 107.4 114.8 119.6 130.2
20–39 years 345 95.5 1.04 73.3 76.0 78.2 82.9 92.4 104.9 112.6 117.0 130.3
40–59 years 299 100.0 0.95 77.9 81.5 83.7 89.2 97.3 108.2 114.9 120.4 130.7
60 years and over 255 102.0 0.86 79.3 83.0 88.6 92.2 101.8 110.4 117.7 121.0 125.0
Mexican American
20 years and over 875 97.8 0.85 79.3 83.2 85.6 88.9 96.7 104.6 109.4 113.2 118.9
20–39 years 358 96.2 1.07 76.6 81.3 83.9 87.3 94.2 102.8 108.6 112.0 118.8
40–59 years 243 99.4 0.71 * 85.8 88.3 93.1 98.3 105.4 109.0 111.3 *
60 years and over 274 103.0 0.89 84.0 89.6 92.1 95.7 102.1 110.4 115.6 118.5 121.6
* Figure does not meet standards of reliability or precision.
1
Persons of other races and unknown race and ethnicity are included.
Page 24 National Health Statistics Reports n Number 10 n October 22, 2008
Table 21. Mid-arm circumference in centimeters for children and adolescents aged 2 months–19 years by sex and age, by mean,
standard error of the mean, and selected percentiles: United States, 2003–2006
Percentile
Number Standard
Sex and age
1
examined Mean error 5th 10th 15th 25th 50th 75th 85th 90th 95th
Male Centimeters
2months 13 * * * * * * * * * * *
3–5months 133 14.1 0.07 * 12.9 13.2 13.5 14.1 14.7 15.0 15.2 *
6–8months 129 14.7 0.13 * 13.2 13.6 13.9 14.6 15.5 15.9 16.3 *
9–11months 123 15.3 0.12 * * 14.2 14.7 15.2 15.9 16.4 * *
1 year 341 15.6 0.09 13.7 14.0 14.2 14.7 15.6 16.4 16.9 17.3 17.5
2 years 270 16.1 0.09 14.3 14.5 14.9 15.3 16.0 16.9 17.3 17.5 18.1
3 years 199 16.6 0.11 * 14.7 15.1 15.4 16.3 17.3 18.0 18.4 *
4 years 200 17.3 0.18 * 15.2 15.5 16.0 17.1 18.1 18.8 19.5 *
5 years 200 18.4 0.24 * 15.9 16.2 16.6 17.9 19.1 20.1 21.2 *
6 years 174 18.9 0.15 * 16.4 16.9 17.4 18.5 20.2
21.4 21.7 *
7 years 177 19.7 0.24 * 16.9 17.4 17.9 19.1 20.6 21.8 23.1 *
8 years 146 20.9 0.31 * 17.8 18.1 18.4 20.3 22.2 23.6 24.4 *
9 years 173 21.7 0.32 * 17.6 18.2 19.1 21.3 23.6 24.8 25.8 *
10 years 170 23.4 0.31 * 19.1 19.7 20.5 22.2 26.1 28.1 29.4 *
11 years 154 24.6 0.55 * 19.5 20.3 21.3 23.3 27.6 29.7 31.3 *
12 years 271 25.4 0.42 19.4 20.3 20.9 22.0 24.2 28.2 30.0 32.6 34.3
13 years 282 26.8 0.38 20.3 21.5 22.4 23.5 26.1 29.5 31.8 32.6 34.3
14 years 257 27.7 0.40 21.1 22.9 23.2 24.2 27.2 30.0 31.8 33.7 36.1
15 years 267 29.3 0.33 24.0 24.6 25.1 26.3 28.3 32.2 33.4 34.5 36.2
16 years 302 30.8 0.37 24.5 25.6 26.0 26.8 29.8 33.6 36.8 38.3 39.7
17 years
273 30.7 0.36 24.9 26.1 26.6 27.3 29.6 33.1 35.0 37.1 38.8
18 years 278 31.5 0.42 24.7 26.2 27.0 28.3 30.2 34.4 36.2 37.8 39.8
19 years 266 32.4 0.41 25.6 26.9 27.5 29.0 31.9 35.3 38.2 38.8 40.6
Female
2months 10 * * * * * * * * * * *
3–5months 93 13.8 0.11 * * * 13.1 13.6 14.2 * * *
6–8months 120 14.6 0.11 * * 13.4 13.7 14.4 15.4 15.9 * *
9–11months 122 15.0 0.13 * * 13.7 14.2 14.9 15.9 16.3 * *
1 year 319 15.4 0.09 13.1 13.7 14.0 14.5 15.4 16.1 16.6 17.0 17.5
2 years 305 16.1 0.09 14.1 14.4 14.7 15.1 16.0 17.0 17.6 17.9 18.4
3 years 176 16.8 0.12 * 15.2 15.4 15.8 16.6 17.3 18.1 18.5 *
4 years 223 17.4
0.12
* 15.6 15.9 16.2 17.1 18.3 18.9 19.2 *
5 years 195 17.9 0.18 * 15.8 16.1 16.6 17.4 19.1 20.0 20.6 *
6 years 187 18.8 0.19 * 16.3 16.9 17.3 18.3 19.7 20.7 22.0 *
7 years 155 20.1 0.25 * 17.0 17.3 18.1 19.4 21.5 23.3 24.0 *
8 years 181 20.9 0.42 * 17.1 17.8 18.5 20.1 22.4 24.8 25.6 *
9 years 183 22.5 0.38 * 18.6 19.0 19.8 22.1 25.2 26.4 27.2 *
10 years 183 23.9 0.37 * 18.9 19.8 20.8 23.3 26.2 28.3 30.0 *
11 years 174 25.3 0.41 * 20.1 20.7 21.7 24.8 28.1 29.6 30.8 *
12 years 243 25.5 0.44 * 20.8 21.5 22.6 24.5 27.2 29.9 32.0 *
13 years 289 26.9 0.32 19.9 21.6 22.5 23.8 25.7 29.5 31.7 32.7 35.8
14 years 264 27.0 0.52 * 22.2 22.6
23.4 26.1 29.4 32.0 33.2 *
15 years 240 27.7 0.27 * 22.9 23.6 24.7 26.7 30.5 32.1 33.2 *
16 years 248 27.8 0.34 * 23.3 23.9 24.9 26.8 29.5 32.0 33.4 *
17 years 247 29.0 0.46 * 23.4 24.4 25.3 28.1 31.4 33.0 35.5 *
18 years 272 29.3 0.58 * 23.3 24.1 25.6 28.3 32.1 34.6 36.5 *
19 years 235 29.4 0.51 * 24.6 25.0 25.9 28.0 31.1 34.2 36.9 *
* Figure does not meet standards of reliability or precision.
1
Age shown is age at time of examination.
NOTE: Pregnant females were excluded.
National Health Statistics Reports n Number 10 n October 22, 2008 Page 25
Table 22. Mid-arm circumference in centimeters for females 20 years of age and older by race and ethnicity and age, by mean,
standard error of the mean, and selected percentiles: United States 2003–2006
Percentile
Number Standard
Race and ethnicity and age examined Mean error 5th 10th 15th 25th 50th 75th 85th 90th 95th
All race and ethnicity groups
1
Centimeters
20 years and over 4,195 31.9 0.15 24.3 25.7 26.5 27.9 31.0 35.1 37.4 39.2 42.0
20–29 years 685 30.3 0.30 23.5 24.2 25.1 26.2 29.0 33.1 35.8 37.6 41.4
30–39 years 652 31.9 0.29 24.7 25.8 26.9 27.9 30.7 35.3 37.9 39.5 41.3
40–49 years 773 32.7 0.28 24.9 26.2 27.1 28.7 31.7 35.9 38.2 40.1 42.4
50–59 years 585 32.8 0.23 25.6 26.3 27.4 28.6 32.0 35.9 38.5 40.0 42.3
60–69 years 683 33.0 0.20 25.5 27.0 27.8 29.0 32.1 36.1 37.9 39.5 43.7
70–79 years 452 31.3 0.28 24.4 25.8 26.7 27.9 30.6 34.1 35.9 37.3 39.5
80 years and over 365 29.2 0.23 22.7 23.8 24.9 26.1 28.9 32.0 33.5 34.5 36.0
Non-Hispanic white
20 years and over 2,158 31.7 0.18 24.2 25.6 26.4 27.8 30.8 34.8
36.9 38.7 41.5
20–39 years 602 30.8 0.30 23.7 24.9 25.7 27.1 29.5 33.5 36.3 38.3 40.6
40–59 years 665 32.5 0.23 25.0 26.1 27.0 28.4 31.6 35.6 37.9 39.8 42.2
60 years and over 891 31.4 0.17 23.8 25.6 26.6 27.9 30.9 34.4 36.3 37.4 40.1
Non-Hispanic black
20 years and over 925 34.4 0.25 25.3 26.8 28.2 29.9 33.9 38.0 40.5 42.3 45.6
20–39 years 319 33.6 0.38 24.6 26.0 27.1 28.8 33.0 37.5 40.0 41.5 44.6
40–59 years 347 35.3 0.31 26.1 27.8 29.6 31.0 34.7 39.2 41.4 43.1 45.8
60 years and over 259 34.2 0.45 25.7 26.8 28.3 30.1 34.1 37.3 39.7 41.3 45.3
Mexican American
20 years and over 798 32.2 0.25 25.3 26.4 27.2 28.6 31.6 35.1 37.4 38.6 40.5
20–39 years 294 31.7 0.34 25.0 26.0 26.5 28.0 31.1 34.6 36.9 37.9 40.3
40–59 years 231 33.2 0.29 26.6 27.7 28.3 29.7 32.5 36.0 38.1 39.2 40.5
60 years and over 273 32.1 0.30 25.5 26.2 27.5 28.5 31.4 35.2 36.5 38.3 40.5
1
Persons of other races and unknown race and ethnicity are included.
NOTE: Pregnant females were excluded.