math calculus bible
Bạn đang xem bản rút gọn của tài liệu. Xem và tải ngay bản đầy đủ của tài liệu tại đây (1.18 MB, 370 trang )
Contents
1 Functions 2
1.1 The Concept of a Function . . . . . . . . . . . . . . . . . . . . 2
1.2 Trigonometric Functions . . . . . . . . . . . . . . . . . . . . . 12
1.3 Inverse Trigonometric Functions . . . . . . . . . . . . . . . . . 19
1.4 Logarithmic, Exponential and Hyperbolic Functions . . . . . . 26
2 Limits and Continuity 35
2.1 Intuitive treatment and definitions . . . . . . . . . . . . . . . 35
2.1.1 Introductory Examples . . . . . . . . . . . . . . . . . . 35
2.1.2 Limit: Formal Definitions . . . . . . . . . . . . . . . . 41
2.1.3 Continuity: Formal Definitions . . . . . . . . . . . . . 43
2.1.4 Continuity Examples . . . . . . . . . . . . . . . . . . . 48
2.2 Linear Function Approximations . . . . . . . . . . . . . . . . . 61
2.3 Limits and Sequences . . . . . . . . . . . . . . . . . . . . . . . 72
2.4 Properties of Continuous Functions . . . . . . . . . . . . . . . 84
2.5 Limits and Infinity . . . . . . . . . . . . . . . . . . . . . . . . 94
3 Differentiation 99
3.1 The Derivative . . . . . . . . . . . . . . . . . . . . . . . . . . 99
3.2 The Chain Rule . . . . . . . . . . . . . . . . . . . . . . . . . . 111
3.3 Differentiation of Inverse Functions . . . . . . . . . . . . . . . 118
3.4 Implicit Differentiation . . . . . . . . . . . . . . . . . . . . . . 130
3.5 Higher Order Derivatives . . . . . . . . . . . . . . . . . . . . . 137
4 Applications of Differentiation 146
4.1 Mathematical Applications . . . . . . . . . . . . . . . . . . . . 146
4.2 Antidifferentiation . . . . . . . . . . . . . . . . . . . . . . . . 157
4.3 Linear First Order Differential Equations . . . . . . . . . . . . 164
i
ii CONTENTS
4.4 Linear Second Order Homogeneous Differential Equations . . . 169
4.5 Linear Non-Homogeneous Second Order Differential Equations 179
5 The Definite Integral 183
5.1 Area Approximation . . . . . . . . . . . . . . . . . . . . . . . 183
5.2 The Definite Integral . . . . . . . . . . . . . . . . . . . . . . . 192
5.3 Integration by Substitution . . . . . . . . . . . . . . . . . . . . 210
5.4 Integration by Parts . . . . . . . . . . . . . . . . . . . . . . . 216
5.5 Logarithmic, Exponential and Hyperbolic Functions . . . . . . 230
5.6 The Riemann Integral . . . . . . . . . . . . . . . . . . . . . . 242
5.7 Volumes of Revolution . . . . . . . . . . . . . . . . . . . . . . 250
5.8 Arc Length and Surface Area . . . . . . . . . . . . . . . . . . 260
6 Techniques of Integration 267
6.1 Integration by formulae . . . . . . . . . . . . . . . . . . . . . . 267
6.2 Integration by Substitution . . . . . . . . . . . . . . . . . . . . 273
6.3 Integration by Parts . . . . . . . . . . . . . . . . . . . . . . . 276
6.4 Trigonometric Integrals . . . . . . . . . . . . . . . . . . . . . . 280
6.5 Trigonometric Substitutions . . . . . . . . . . . . . . . . . . . 282
6.6 Integration by Partial Fractions . . . . . . . . . . . . . . . . . 288
6.7 Fractional Power Substitutions . . . . . . . . . . . . . . . . . . 289
6.8 Tangent x/2 Substitution . . . . . . . . . . . . . . . . . . . . 290
6.9 Numerical Integration . . . . . . . . . . . . . . . . . . . . . . 291
7 Improper Integrals and Indeterminate Forms 294
7.1 Integrals over Unbounded Intervals . . . . . . . . . . . . . . . 294
7.2 Discontinuities at End Points . . . . . . . . . . . . . . . . . . 299
7.3 . . . . . . . . . . . . . . . . . . . . . . . . . . . . . . . . . . 304
7.4 Improper Integrals . . . . . . . . . . . . . . . . . . . . . . . . 314
8 Infinite Series 315
8.1 Sequences . . . . . . . . . . . . . . . . . . . . . . . . . . . . . 315
8.2 Monotone Sequences . . . . . . . . . . . . . . . . . . . . . . . 320
8.3 Infinite Series . . . . . . . . . . . . . . . . . . . . . . . . . . . 323
8.4 Series with Positive Terms . . . . . . . . . . . . . . . . . . . . 327
8.5 Alternating Series . . . . . . . . . . . . . . . . . . . . . . . . . 341
8.6 Power Series . . . . . . . . . . . . . . . . . . . . . . . . . . . . 347
8.7 Taylor Polynomials and Series . . . . . . . . . . . . . . . . . . 354
CONTENTS 1
8.8 Applications . . . . . . . . . . . . . . . . . . . . . . . . . . . . 360
9 Analytic Geometry and Polar Coordinates 361
9.1 Parabola . . . . . . . . . . . . . . . . . . . . . . . . . . . . . . 361
9.2 Ellipse . . . . . . . . . . . . . . . . . . . . . . . . . . . . . . . 362
9.3 Hyperbola . . . . . . . . . . . . . . . . . . . . . . . . . . . . . 363
9.4 Second-Degree Equations . . . . . . . . . . . . . . . . . . . . . 363
9.5 Polar Coordinates . . . . . . . . . . . . . . . . . . . . . . . . . 364
9.6 Graphs in Polar Coordinates . . . . . . . . . . . . . . . . . . . 365
9.7 Areas in Polar Coordinates . . . . . . . . . . . . . . . . . . . . 366
9.8 Parametric Equations . . . . . . . . . . . . . . . . . . . . . . . 366
Chapter 1
Functions
In this chapter we review the basic concepts of functions, polynomial func-
tions, rational functions, trigonometric functions, logarithmic functions, ex-
ponential functions, hyperbolic functions, algebra of functions, composition
of functions and inverses of functions.
1.1 The Concept of a Function
Basically, a function f relates each element x of a set, say D
f
, with exactly
one element y of another set, say R
f
. We say that D
f
is the domain of f and
R
f
is the range of f and express the relationship by the equation y = f(x).
It is customary to say that the symbol x is an independent variable and the
symbol y is the dependent variable.
Example 1.1.1 Let D
f
= {a, b, c}, R
f
= {1, 2, 3} and f(a) = 1, f(b) = 2
and f(c) = 3. Sketch the graph of f.
graph
Example 1.1.2 Sketch the graph of f(x) = |x|.
Let D
f
be the set of all real numbers and R
f
be the set of all non-negative
real numbers. For each x in D
f
, let y = |x| in R
f
. In this case, f(x) = |x|,
2
1.1. THE CONCEPT OF A FUNCTION 3
the absolute value of x. Recall that
|x| =
x if x ≥ 0
−x if x < 0
We note that f(0) = 0, f(1) = 1 and f(−1) = 1.
If the domain D
f
and the range R
f
of a function f are both subsets
of the set of all real numbers, then the graph of f is the set of all ordered
pairs (x, f(x)) such that x is in D
f
. This graph may be sketched in the xy-
coordinate plane, using y = f(x). The graph of the absolute value function
in Example 2 is sketched as follows:
graph
Example 1.1.3 Sketch the graph of
f(x) =
√
x −4.
In order that the range of f contain real numbers only, we must impose
the restriction that x ≥ 4. Thus, the domain D
f
contains the set of all real
numbers x such that x ≥ 4. The range R
f
will consist of all real numbers y
such that y ≥ 0. The graph of f is sketched below.
graph
Example 1.1.4 A useful function in engineering is the unit step function,
u, defined as follows:
u(x) =
0 if x < 0
1 if x ≥ 0
The graph of u(x) has an upward jump at x = 0. Its graph is given below.
4 CHAPTER 1. FUNCTIONS
graph
Example 1.1.5 Sketch the graph of
f(x) =
x
x
2
− 4
.
It is clear that D
f
consists of all real numbers x = ±2. The graph of f is
given below.
graph
We observe several things about the graph of this function. First of all,
the graph has three distinct pieces, separated by the dotted vertical lines
x = −2 and x = 2. These vertical lines, x = ±2, are called the vertical
asymptotes. Secondly, for large positive and negative values of x, f(x) tends
to zero. For this reason, the x-axis, with equation y = 0, is called a horizontal
asymptote.
Let f be a function whose domain D
f
and range R
f
are sets of real
numbers. Then f is said to be even if f(x) = f(−x) for all x in D
f
. And
f is said to be odd if f(−x) = −f(x) for all x in D
f
. Also, f is said to be
one-to-one if f(x
1
) = f(x
2
) implies that x
1
= x
2
.
Example 1.1.6 Sketch the graph of f(x) = x
4
− x
2
.
This function f is even because for all x we have
f(−x) = (−x)
4
− (−x)
2
= x
4
− x
2
= f(x).
The graph of f is symmetric to the y-axis because (x, f(x)) and (−x, f(x)) are
on the graph for every x. The graph of an even function is always symmetric
to the y-axis. The graph of f is given below.
graph
1.1. THE CONCEPT OF A FUNCTION 5
This function f is not one-to-one because f(−1) = f (1).
Example 1.1.7 Sketch the graph of g(x) = x
3
− 3x.
The function g is an odd function because for each x,
g(−x) = (−x)
3
− 3(−x) = −x
3
+ 3x = −(x
3
− 3x) = −g(x).
The graph of this function g is symmetric to the origin because (x, g(x))
and (−x, −g(x)) are on the graph for all x. The graph of an odd function is
always symmetric to the origin. The graph of g is given below.
graph
This function g is not one-to-one because g(0) = g(
√
3) = g(−
√
3).
It can be shown that every function f can be written as the sum of an
even function and an odd function. Let
g(x) =
1
2
(f(x) + f(−x)), h(x) =
1
2
(f(x) −f(−x)).
Then,
g(−x) =
1
2
(f(−x) + f(x)) = g(x)
h(−x) =
1
2
(f(−x) −f(x)) = −h(x).
Furthermore
f(x) = g(x) + h(x).
Example 1.1.8 Express f as the sum of an even function and an odd func-
tion, where,
f(x) = x
4
− 2x
3
+ x
2
− 5x + 7.
We define
g(x) =
1
2
(f(x) + f(−x))
=
1
2
{(x
4
− 2x
3
+ x
2
− 5x + 7) + (x
4
+ 2x
3
+ x
2
+ 5x + 7)}
= x
4
+ x
2
+ 7
6 CHAPTER 1. FUNCTIONS
and
h(x) =
1
2
(f(x) −f(−x))
=
1
2
{(x
4
− 2x
3
+ x
2
− 5x + 7) −(x
4
+ 2x
3
+ x
2
+ 5x + 7)}
= −2x
3
− 5x.
Then clearly g(x) is even and h(x) is odd.
g(−x) = (−x)
4
+ (−x)
2
+ 7
= x
4
+ x
2
+ 7
= g(x)
h(−x) = −2(−x)
3
− 5(−x)
= 2x
3
+ 5x
= −h(x).
We note that
g(x) + h(x) = (x
4
+ x
2
+ 7) + (−2x
3
− 5x)
= x
4
− 2x
3
+ x
2
− 5x + 7
= f(x).
It is not always easy to tell whether a function is one-to-one. The graph-
ical test is that if no horizontal line crosses the graph of f more than once,
then f is one-to-one. To show that f is one-to-one mathematically, we need
to show that f(x
1
) = f(x
2
) implies x
1
= x
2
.
Example 1.1.9 Show that f(x) = x
3
is a one-to-one function.
Suppose that f(x
1
) = f(x
2
). Then
0 = x
3
1
− x
3
2
= (x
1
− x
2
)(x
2
1
+ x
1
x
2
+ x
2
2
) (By factoring)
If x
1
= x
2
, then x
2
1
+ x
1
x
2
+ x
2
2
= 0 and
x
1
=
−x
2
±
x
2
2
− 4x
2
2
2
=
−x
2
±
−3x
2
2
2
.
1.1. THE CONCEPT OF A FUNCTION 7
This is only possible if x
1
is not a real number. This contradiction proves
that f(x
1
) = f(x
2
) if x
1
= x
2
and, hence, f is one-to-one. The graph of f is
given below.
graph
If a function f with domain D
f
and range R
f
is one-to-one, then f has a
unique inverse function g with domain R
f
and range D
f
such that for each
x in D
f
,
g(f(x)) = x
and for such y in R
f
,
f(g(y)) = y.
This function g is also written as f
−1
. It is not always easy to express g
explicitly but the following algorithm helps in computing g.
Step 1 Solve the equation y = f(x) for x in terms of y and make sure that there
exists exactly one solution for x.
Step 2 Write x = g(y), where g(y) is the unique solution obtained in Step 1.
Step 3 If it is desirable to have x represent the independent variable and y
represent the dependent variable, then exchange x and y in Step 2 and
write
y = g(x).
Remark 1 If y = f(x) and y = g(x) = f
−1
(x) are graphed on the same
coordinate axes, then the graph of y = g(x) is a mirror image of the graph
of y = f(x) through the line y = x.
Example 1.1.10 Determine the inverse of f(x) = x
3
.
We already know from Example 9 that f is one-to-one and, hence, it has
a unique inverse. We use the above algorithm to compute g = f
−1
.
Step 1 We solve y = x
3
for x and get x = y
1/3
, which is the unique solution.
8 CHAPTER 1. FUNCTIONS
Step 2 Then g(y) = y
1/3
and g(x) = x
1/3
= f
−1
(x).
Step 3 We plot y = x
3
and y = x
1/3
on the same coordinate axis and compare
their graphs.
graph
A polynomial function p of degree n has the general form
p(x) = a
0
x
n
+ a
1
x
n−1
+ ··· + a
n−1
x + a
n
, a
2
= 0.
The polynomial functions are some of the simplest functions to compute.
For this reason, in calculus we approximate other functions with polynomial
functions.
A rational function r has the form
r(x) =
p(x)
q(x)
where p(x) and q(x) are polynomial functions. We will assume that p(x) and
q(x) have no common non-constant factors. Then the domain of r(x) is the
set of all real numbers x such that q(x) = 0.
Exercises 1.1
1. Define each of the following in your own words.
(a) f is a function with domain D
f
and range R
f
(b) f is an even function
(c) f is an odd function
(d) The graph of f is symmetric to the y-axis
(e) The graph of f is symmetric to the origin.
(f) The function f is one-to-one and has inverse g.
1.1. THE CONCEPT OF A FUNCTION 9
2. Determine the domains of the following functions
(a) f(x) =
|x|
x
(b) f(x) =
x
2
x
3
− 27
(c) f(x) =
√
x
2
− 9 (d) f(x) =
x
2
− 1
x −1
3. Sketch the graphs of the following functions and determine whether they
are even, odd or one-to-one. If they are one-to-one, compute their in-
verses and plot their inverses on the same set of axes as the functions.
(a) f(x) = x
2
− 1 (b) g(x) = x
3
− 1
(c) h(x) =
√
9 −x, x ≥ 9 (d) k(x) = x
2/3
4. If {(x
1
, y
1
), (x
2
, y
2
), . . . , (x
n+1
, y
n+1
)} is a list of discrete data points in
the plane, then there exists a unique nth degree polynomial that goes
through all of them. Joseph Lagrange found a simple way to express this
polynomial, called the Lagrange polynomial.
For n = 2, P
2
(x) = y
1
x −x
2
x
1
− x
2
+ y
2
x −x
1
x
2
− x
1
For n = 3, P
3
(x) = y
1
(x −x
2
)(x −x
3
)
(x
1
− x
2
)(x
1
− x
3
)
+ y
2
(x −x
1
)(x −x
3
)
(x
2
− x
1
)(x
2
− x
3
)
+
y
3
(x −x
1
)(x −x
2
)
(x
3
− x
1
)(x
3
− x
2
)
P
4
(x) =y
1
(x −x
2
)(x −x
3
)(x −x
4
)
(x
1
− x
2
)(x
1
− x
3
)(x
1
− x
4
)
+ y
2
(x −x
1
)(x −x
3
)(x −x
4
)
(x
2
− x
1
)(x
2
− x
3
)(x
2
− x
4
)
+
y
3
(x −x
1
)(x −x
2
)(x −x
4
)
(x
3
− x
1
)(x
3
− x
2
)(x
3
− x
4
)
+ y
4
(x −x
1
)(x −x
2
)(x −x
3
)
(x
4
− x
1
)(x
4
− x
2
)(x
4
− x
3
)
Consider the data {(−2, 1), (−1, −2), (0, 0), (1, 1), (2, 3)}. Compute P
2
(x),
P
3
(x), and P
4
(x); plot them and determine which data points they go
through. What can you say about P
n
(x)?
10 CHAPTER 1. FUNCTIONS
5. A linear function has the form y = mx + b. The number m is called
the slope and the number b is called the y-intercept. The graph of this
function goes through the point (0, b) on the y-axis. In each of the
following determine the slope, y-intercept and sketch the graph of the
given linear function:
a) y = 3x −5 b) y = −2x + 4 c) y = 4x −3
d) y = 4 e) 2y + 5x = 10
6. A quadratic function has the form y = ax
2
+ bx + c, where a = 0. On
completing the square, this function can be expressed in the form
y = a
x +
b
2a
2
−
b
2
− 4ac
4a
2
.
The graph of this function is a parabola with vertex
−
b
2a
, −
b
2
− 4ac
4a
and line of symmetry axis being the vertical line with equation x =
−b
2a
.
The graph opens upward if a > 0 and downwards if a < 0. In each of
the following quadratic functions, determine the vertex, symmetry axis
and sketch the graph.
a) y = 4x
2
− 8 b) y = −4x
2
+ 16 c) y = x
2
+ 4x + 5
d) y = x
2
− 6x + 8 e) y = −x
2
+ 2x + 5 f) y = 2x
2
− 6x + 12
g) y = −2x
2
− 6x + 5 h) y = −2x
2
+ 6x + 10 i) 3y + 6x
2
+ 10 = 0
j) y = −x
2
+ 4x + 6 k) y = −x
2
+ 4x l) y = 4x
2
− 16x
7. Sketch the graph of the linear function defined by each linear equation
and determine the x-intercept and y-intercept if any.
a) 3x − y = 3 b) 2x −y = 10 c) x = 4 −2y
1.1. THE CONCEPT OF A FUNCTION 11
d) 4x − 3y = 12 e) 3x + 4y = 12 f) 4x + 6y = −12
g) 2x − 3y = 6 h) 2x + 3y = 12 i) 3x + 5y = 15
8. Sketch the graph of each of the following functions:
a) y = 4|x| b) y = −4|x|
c) y = 2|x| + |x −1| d) y = 3|x| + 2|x −2| −4|x + 3|
e) y = 2|x + 2| −3|x + 1|
9. Sketch the graph of each of the following piecewise functions.
a) y =
2 if x ≥ 0
−2 if x < 0
b) y =
x
2
for x ≤ 0
2x + 4 for x > 0
c) y =
4x
2
if x ≥ 0
3x
3
x < 0
d) y =
3x
2
for x ≤ 1
4 for x > 1
e) y = n − 1 for n − 1 ≤ x < n, for each integer n.
f) y = n for n −1 < x ≤ n for each integer n.
10. The reflection of the graph of y = f(x) is the graph of y = −f(x). In
each of the following, sketch the graph of f and the graph of its reflection
on the same axis.
a) y = x
3
b) y = x
2
c) y = |x|
d) y = x
3
− 4x e) y = x
2
− 2x f) y = |x| + |x −1|
g) y = x
4
− 4x
2
h) y = 3x −6 i) y =
x
2
+ 1 for x ≤ 0
x
3
+ 1 if x < 0
12 CHAPTER 1. FUNCTIONS
11. The graph of y = f(x) is said to be
(i) Symmetric with respect to the y-axis if (x, y) and (−x, y) are both
on the graph of f;
(ii) Symmetric with respect to the origin if (x, y) and (−x, −y) are both
on the graph of f.
For the functions in problems 10 a) – 10 i), determine the functions whose
graphs are (i) Symmetric with respect to y-axis or (ii) Symmetric with
respect to the origin.
12. Discuss the symmetry of the graph of each function and determine whether
the function is even, odd, or neither.
a) f(x) = x
6
+ 1 b) f(x) = x
4
− 3x
2
+ 4 c) f(x) = x
3
− x
2
d) f(x) = 2x
3
+ 3x e) f(x) = (x −1)
3
f) f(x) = (x + 1)
4
g) f(x) =
√
x
2
+ 4 h) f(x) = 4|x| + 2 i) f(x) = (x
2
+ 1)
3
j) f(x) =
x
2
− 1
x
2
+ 1
k) f(x) =
√
4 −x
2
l) f(x) = x
1/3
1.2 Trigonometric Functions
The trigonometric functions are defined by the points (x, y) on the unit circle
with the equation x
2
+ y
2
= 1.
graph
Consider the points A(0, 0), B(x, 0), C(x, y) where C(x, y) is a point on
the unit circle. Let θ, read theta, represent the length of the arc joining
the points D(1, 0) and C(x, y). This length is the radian measure of the
angle CAB. Then we define the following six trigonometric functions of θ as
1.2. TRIGONOMETRIC FUNCTIONS 13
follows:
sin θ =
y
1
, cos θ =
x
1
, tan θ =
y
x
=
sin θ
cos θ
,
csc θ =
1
y
=
1
sin θ
, sec θ =
1
x
=
1
cos θ
, cot θ =
x
y
=
1
tan θ
.
Since each revolution of the circle has arc length 2π, sin θ and cos θ have
period 2π. That is,
sin(θ + 2nπ) = sin θ and cos(θ + 2nπ) = cos θ, n = 0, ±1, ±2, . . .
The function values of some of the common arguments are given below:
θ 0 π/6 π/4 π/3 π/2 2π/3 3π/4 5π/6 π
sin θ 0 1/2
√
2/2
√
3/2 1
√
3/2
√
2/2 1/2 0
cos θ 1
√
3/2
√
2/2 1/2 0 −1/2 −
√
2/2 −
√
3/2 -1
θ 7π/6 5π/4 4π/3 3π/2 5π/3 7π/4 11π/6 2π
sin θ −1/2 −
√
2/2 −
√
3/2 −1 −
√
3/2 −
√
2/2 −1/2 0
cos θ −
√
3/2 −
√
2/2 −1/2 0 1/2
√
2/2
√
3/2 1
A function f is said to have period p if p is the smallest positive number
such that, for all x,
f(x + np) = f(x), n = 0, ±1, ±2, . . . .
Since csc θ is the reciprocal of sin θ and sec θ is the reciprocal of cos(θ), their
periods are also 2π. That is,
csc(θ + 2nπ) = csc(θ) and sec(θ + 2nπ) = sec θ, n = 0, ±1, ±2, . . . .
It turns out that tan θ and cot θ have period π. That is,
tan(θ + nπ) = tan θ and cot(θ + nπ) = cot θ, n = 0, ±1, ±2, . . . .
Geometrically, it is easy to see that cos θ and sec θ are the only even trigono-
metric functions. The functions sin θ, cos θ, tan θ and cot θ are all odd func-
tions. The functions sin θ and cos θ are defined for all real numbers. The
14 CHAPTER 1. FUNCTIONS
functions csc θ and cot θ are not defined for integer multiples of π, and sec θ
and tan θ are not defined for odd integer multiples of π/2. The graphs of the
six trigonometric functions are sketched as follows:
graph
The dotted vertical lines represent the vertical asymptotes.
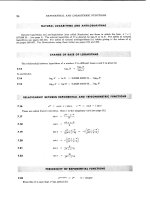
There are many useful trigonometric identities and reduction formulas.
For future reference, these are listed here.
sin
2
θ + cos
2
θ = 1 sin
2
θ = 1 − cos
2
θ cos
2
θ = 1 − sin
2
θ
tan
2
θ + 1 = sec
2
θ tan
2
θ = sec
2
θ − 1 sec
2
θ − tan
2
θ = 1
1 + cot
2
θ = csc
2
θ cot
2
θ = csc
2
θ − 1 csc
2
θ − cot
2
θ = 1
sin 2θ = 2 sin θ cos θ cos 2θ = 2 cos
2
θ − 1 cos 2θ = 1 + 2 sin
2
θ
sin(x + y) = sin x cos y + cos x sin y, cos(x + y) = cos x cos y − sin x sin y
sin(x −y) = sin x cos y − cos x sin y, cos(x − y) = cos x cos y + sin x sin y
tan(x + y) =
tan x + tan y
1 −tan x tan y
tan(x −y) =
tan x − tan y
1 + tan x tan y
sin α + sin β = 2 sin
α + β
2
cos
α −β
2
sin α −sin β = 2 cos
α + β
2
sin
α −β
2
cos α + cos β = 2 cos
α + β
2
cos
α −β
2
cos α −cos β = −2 sin
α + β
2
sin
α −β
2
1.2. TRIGONOMETRIC FUNCTIONS 15
sin x cos y =
1
2
(sin(x + y) + sin(x −y))
cos x sin y =
1
2
(sin(x + y) −sin(x −y))
cos x cos y =
1
2
(cos(x −y) + cos(x + y))
sin x sin y =
1
2
(cos(x −y) −cos(x + y))
sin(π ± θ) = ∓sin θ
cos(π ± θ) = −cos θ
tan(π ± θ) = ±tan θ
cot(π ± θ) = ±cot θ
sec(π ± θ) = −sec θ
csc(π ± θ) = ∓csc θ
In applications of calculus to engineering problems, the graphs of y =
A sin(bx + c) and y = A cos(bx + c) play a significant role. The first problem
has to do with converting expressions of the form A sin bx + B cos bx to one
of the above forms. Let us begin first with an example.
Example 1.2.1 Express y = 3 sin(2x)−4 cos(2x) in the form y = A sin(2x±
θ) or y = A cos(2x ± θ).
First of all, we make a right triangle with sides of length 3 and 4 and
compute the length of the hypotenuse, which is 5. We label one of the acute
angles as θ and compute sin θ, cos θ and tan θ. In our case,
sin θ =
3
5
, cos θ =
4
5
, and, tan θ =
3
4
.
graph
16 CHAPTER 1. FUNCTIONS
Then,
y = 3 sin 2x −4 cos 2x
= 5
(sin(2x))
3
5
− (cos(2x))
4
5
= 5[sin(2x) sin θ −cos(2x) cos θ]
= −5[cos(2x) cos θ −sin(2x) sin θ]
= −5[cos(2x + θ)]
Thus, the problem is reduced to sketching a cosine function, ???
y = −5 cos(2x + θ).
We can compute the radian measure of θ from any of the equations
sin θ =
3
5
, cos θ =
4
5
or tan θ =
3
4
.
Example 1.2.2 Sketch the graph of y = 5 cos(2x + 1).
In order to sketch the graph, we first compute all of the zeros, relative
maxima, and relative minima. We can see that the maximum values will be
5 and minimum values are −5. For this reason the number 5 is called the
amplitude of the graph. We know that the cosine function has zeros at odd
integer multiples of π/2. Let
2x
n
+ 1 = (2n + 1)
π
2
, x
n
= (2n + 1)
π
4
−
1
2
, n = 0, ±1, ±2 . . . .
The max and min values of a cosine function occur halfway between the
consecutive zeros. With this information, we are able to sketch the graph of
the given function. The period is π, phase shift is
1
2
and frequency is
1
π
.
graph
For the functions of the form y = A sin(ωt ± d) or y = A cos(ωt ± d) we
make the following definitions:
1.2. TRIGONOMETRIC FUNCTIONS 17
period =
2π
ω
, frequency =
1
period
=
ω
2π
,
amplitude = |A|, and phase shift =
d
ω
.
The motion of a particle that follows the curves A sin(ωt±d) or A cos(ωt±d)
is called simple harmonic motion.
Exercises 1.2
1. Determine the amplitude, frequency, period and phase shift for each of
the following functions. Sketch their graphs.
(a) y = 2 sin(3t − 2) (b) y = −2 cos(2t −1)
(c) y = 3 sin 2t + 4 cos 2t (d) y = 4 sin 2t − 3 cos 2t
(e) y =
sin x
x
2. Sketch the graphs of each of the following:
(a) y = tan(3x) (b) y = cot(5x) (c) y = x sin x
(d) y = sin(1/x) (e) y = x sin(1/x)
3. Express the following products as the sum or difference of functions.
(a) sin(3x) cos(5x) (b) cos(2x) cos(4x) (c) cos(2x) sin(4x)
(d) sin(3x) sin(5x) (e) sin(4x) cos(4x)
4. Express each of the following as a product of functions:
(a) sin(x + h) −sin x (b) cos(x + h) −cos x (c) sin(5x) −sin(3x)
(d) cos(4x) −cos(2x) (e) sin(4x) + sin(2x) (f) cos(5x) + cos(3x)
5. Consider the graph of y = sin x,
−π
2
≤ x ≤
π
2
. Take the sample points
−
π
2
, −1
,
−
π
6
, −
π
2
, (0, 0),
π
6
,
1
2
,
π
2
, 1
.
18 CHAPTER 1. FUNCTIONS
Compute the fourth degree Lagrange Polynomial that approximates and
agrees with y = sin x at these data points. This polynomial has the form
P
5
(x) = y
1
(x −x
2
)(x −x
3
)(x −x
4
)(x −x
5
)
(x
1
− x
2
)(x
1
− x
3
)(x
1
− x
4
)(x
1
− x
5
)
+
y
2
(x −x
1
)(x −x
3
)(x −x
4
)(x −x
5
)
(x
2
− x
1
)(x
2
− x
3
)(x
2
− x
4
)(x
2
− x
5
)
+ ···
+ y
5
(x −x
1
)(x −x
2
)(x −x
3
)(x −x
4
)
(x
5
− x
1
)(x
5
− x
2
)(x
5
− x
3
)(x
5
− x
4
)
.
6. Sketch the graphs of the following functions and compute the amplitude,
period, frequency and phase shift, as applicable.
a) y = 3 sin t b) y = 4 cos t c) y = 2 sin(3t)
d) y = −4 cos(2t) e) y = −3 sin(4t) f) y = 2 sin
t +
π
6
g) y = −2 sin
t −
π
6
h) y = 3 cos(2t + π) i) y = −3 cos(2t − π)
j) y = 2 sin(4t + π) k) y = −2 cos(6t − π) l) y = 3 sin(6t + π)
7. Sketch the graphs of the following functions over two periods.
a) y = 2 sec x b) y = −3 tan x c) y = 2 cot x
d) y = 3 csc x e) y = tan(πx) f) y = tan
2x +
π
3
g) y = 2 cot
3x +
π
2
h) y = 3 sec
2x +
π
3
i) y = 2 sin
πx +
π
6
8. Prove each of the following identities:
a) cos 3t = 3 cos t + 4 cos
3
t b) sin(3t) = 3 sin x − 4 sin
3
x
c) sin
4
t −cos
4
t = −cos 2t d)
sin
3
t −cos
3
t
sin t − cos t
= 1 + sin 2t
e) cos 4t cos 7t − sin 7t sin 4t = cos 11t f)
sin(x + y)
sin(x −y)
=
tan x + tan y
tan x − tan y
1.3. INVERSE TRIGONOMETRIC FUNCTIONS 19
9. If f(x) = cos x, prove that
f(x + h) −f(x)
h
= cos x
cos h − 1
h
− sin x
sin h
h
.
10. If f(x) = sin x, prove that
f(x + h) −f(x)
h
= sin x
cos h − 1
h
+ cos x
sin h
h
.
11. If f(x) = cos x, prove that
f(x) −f(t)
x −t
= cos t
cos(x −t) −1
x −t
− sin t
sin(x −t)
x −t
.
12. If f(x) = sin x, prove that
f(x) −f(t)
x −t
= sin t
cos(x −t) −1
x −t
+ cos t
sin(x −t)
x −t
.
13. Prove that
cos(2t) =
1 −tan
2
t
1 + tan
2
t
.
14. Prove that if y = tan
x
2
, then
(a) cos x =
1 −u
2
1 + u
2
(b) sin x =
2u
1 + u
2
1.3 Inverse Trigonometric Functions
None of the trigonometric functions are one-to-one since they are periodic.
In order to define inverses, it is customary to restrict the domains in which
the functions are one-to-one as follows.
20 CHAPTER 1. FUNCTIONS
1. y = sin x, −
π
2
≤ x ≤
π
2
, is one-to-one and covers the range −1 ≤ y ≤ 1.
Its inverse function is denoted arcsin x, and we define y = arcsin x, −1 ≤
x ≤ 1, if and only if, x = sin y, −
π
2
≤ y ≤
π
2
.
graph
2. y = cos x, 0 ≤ x ≤ π, is one-to-one and covers the range −1 ≤ y ≤ 1. Its
inverse function is denoted arccos x, and we define y = arccos x, −1 ≤
x ≤ 1, if and only if, x = cos y, 0 ≤ y ≤ π.
graph
3. y = tan x,
−π
2
< x <
π
2
, is one-to-one and covers the range −∞ <
y < ∞ Its inverse function is denoted arctan x, and we define y =
arctan x, −∞ < x < ∞, if and only if, x = tan y,
−π
2
< y <
π
2
.
graph
4. y = cot x, 0, x < π, is one-to-one and covers the range −∞ < y < ∞. Its
inverse function is denoted arccot x, and we define y = arccot x, −∞ <
x < ∞, if and only if x = cot y, 0 < y < π.
graph
1.3. INVERSE TRIGONOMETRIC FUNCTIONS 21
5. y = sec x, 0 ≤ x ≤
π
2
or
π
2
< x ≤ π is one-to-one and covers the range
−∞ < y ≤ −1 or 1 ≤ y < ∞. Its inverse function is denoted arcsec x,
and we define y = arcsec x, −∞ < x ≤ −1 or 1 ≤ x < ∞, if and only
if, x = sec y, 0 ≤ y <
π
2
or
π
2
< y ≤ π.
graph
6. y = csc x,
−π
2
≤ x < 0 or 0 < x ≤
π
2
, is one-to-one and covers the
range −∞ < y ≤ −1 or 1 ≤ y < ∞. Its inverse is denoted arccsc x and
we define y = arccsc x, −∞ < x ≤ −1 or 1 ≤ x < ∞, if and only if,
x = csc y,
−π
2
≤ y < 0 or 0 < y ≤
π
2
.
Example 1.3.1 Show that each of the following equations is valid.
(a) arcsin x + arccos x =
π
2
(b) arctan x + arccot x =
π
2
(c) arcsec x + arccsc x =
π
2
To verify equation (a), we let arcsin x = θ.
graph
Then x = sin θ and cos
π
2
− θ
= x, as shown in the triangle. It follows
that
π
2
− θ = arccos x,
π
2
= θ + arccos x = arcsin x + arccos x.
The equations in parts (b) and (c) are verified in a similar way.
22 CHAPTER 1. FUNCTIONS
Example 1.3.2 If θ = arcsin x, then compute cos θ, tan θ, cot θ, sec θ and
csc θ.
If θ is −
π
2
, 0, or
π
2
, then computations are easy.
graph
Suppose that −
π
2
< x < 0 or 0 < x <
π
2
. Then, from the triangle, we get
cos θ =
√
1 −x
2
, tan θ =
x
√
1 −x
2
, cot θ =
√
1 −x
2
x
,
sec θ =
1
√
1 −x
2
and csc θ =
1
x
.
Example 1.3.3 Make the given substitutions to simplify the given radical
expression and compute all trigonometric functions of θ.
(a)
√
4 −x
2
, x = 2 sin θ (b)
√
x
2
− 9, x = 3 sec θ
(c) (4 + x
2
)
3/2
, x = 2 tan θ
(a) For part (a), sin θ =
x
2
and we use the given triangle:
graph
Then
cos θ =
√
4 −x
2
2
, tan θ =
x
√
4 −x
2
, cot θ =
√
4 −x
2
x
,
sec θ =
2
√
4 −x
2
, csc θ =
2
x
.
Furthermore,
√
4 −x
2
= 2 cos θ and the radical sign is eliminated.
1.3. INVERSE TRIGONOMETRIC FUNCTIONS 23
(b) For part (b), sec θ =
x
3
and we use the given triangle:
graph
Then,
sin θ =
√
x
2
− 4
x
, cos θ =
3
x
, tan θ =
√
x
2
− 4
3
cot θ =
3
√
x
2
− 9
, csc θ =
x
√
x
2
− 9
.
Furthermore,
√
x
2
− 9 = 3 tan θ and the radical sign is eliminated.
(c) For part (c), tan θ =
x
2
and we use the given triangle:
graph
Then,
sin θ =
x
√
x
2
+ 4
, cos θ =
2
√
x
2
+ 4
, cot θ =
2
x
,
sec θ =
√
x
2
+ 4
2
, csc θ =
√
x
2
+ 4
x
.
Furthermore,
√
x
2
+ 4 = 2 sec θ and hence
(4 + x)
3/2
= (2 sec θ)
3
= 8 sec
3
θ.