Identification of key sex-specific pathways and genes in the subcutaneous adipose tissue from pigs using WGCNA method
Bạn đang xem bản rút gọn của tài liệu. Xem và tải ngay bản đầy đủ của tài liệu tại đây (5.18 MB, 13 trang )
(2022) 23:35
Wang et al. BMC Genomic Data
/>
BMC Genomic Data
Open Access
RESEARCH
Identification of key sex‑specific pathways
and genes in the subcutaneous adipose tissue
from pigs using WGCNA method
Huiyu Wang1,2†, Xiaoyi Wang1†, Mingli Li1, Shuyan Wang1, Qiang Chen1* and Shaoxiong Lu1*
Abstract
Background: Adipose tissues (ATs), including visceral ATs (VATs) and subcutaneous ATs (SATs), are crucial for maintaining energy and metabolic homeostasis. SATs have been found to be closely related to obesity and obesityinduced metabolic disease. Some studies have shown a significant association between subcutaneous fat metabolism and sexes. However, the molecular mechanisms for this association are still unclear. Here, using the pig as a
model, we investigated the systematic association between the subcutaneous fat metabolism and sexes, and identified some key sex-specific pathways and genes in the SATs from pigs.
Results: The results revealed that 134 differentially expressed genes (DEGs) were identified in female and male pigs
from the obese group. A total of 17 coexpression modules were detected, of which six modules were significantly
correlated with the sexes (P < 0.01). Among the significant modules, the greenyellow module (cor = 0.68, P < 9e-06)
and green module (cor = 0.49, P < 0.003) were most significantly positively correlated with the male and female,
respectively. Functional analysis showed that one GO term and four KEGG pathways were significantly enriched in
the greenyellow module while six GO terms and six KEGG pathways were significantly enriched in the green module.
Furthermore, a total of five and two key sex-specific genes were identified in the two modules, respectively. Two key
sex-specific pathways (Ras-MAPK signaling pathway and type I interferon response) play an important role in the SATs
of males and females, respectively.
Conclusions: The present study identified some key sex-specific pathways and genes in the SATs from pigs, which
provided some new insights into the molecular mechanism of being involved in fat formation and immunoregulation
between pigs of different sexes. These findings may be beneficial to breeding in the pig industry and obesity treatment in medicine.
Keywords: Sex, Pigs, Subcutaneous fat tissue, WGCNA, Key pathways and genes
†
Huiyu Wang and Xiaoyi Wang are contributed equally to this work.
*Correspondence: ;
1
Faculty of Animal Science and Technology, Yunnan Agricultural University,
No. 95 of Jinhei Road, Kunming 650201, Yunnan, China
Full list of author information is available at the end of the article
Background
It is well known that adipose tissue (AT) is a kind of central metabolic tissue of complex and highly metabolically
activity, and participates in regulating systemic energy
homeostasis [1]. AT has key roles in the pathogenesis
of obesity and obesity-induced metabolic disease by
secreting hormones, cytokines and adipokines involving the regulation of metabolism [2, 3]. The ATs located
in the abdominal and thoracic cavities are called visceral
ATs (VATs), which have been considered anatomically,
© The Author(s) 2022. Open Access This article is licensed under a Creative Commons Attribution 4.0 International License, which
permits use, sharing, adaptation, distribution and reproduction in any medium or format, as long as you give appropriate credit to the
original author(s) and the source, provide a link to the Creative Commons licence, and indicate if changes were made. The images or
other third party material in this article are included in the article’s Creative Commons licence, unless indicated otherwise in a credit line
to the material. If material is not included in the article’s Creative Commons licence and your intended use is not permitted by statutory
regulation or exceeds the permitted use, you will need to obtain permission directly from the copyright holder. To view a copy of this
licence, visit http://creativecommons.org/licenses/by/4.0/. The Creative Commons Public Domain Dedication waiver (http://creativeco
mmons.org/publicdomain/zero/1.0/) applies to the data made available in this article, unless otherwise stated in a credit line to the data.
Wang et al. BMC Genomic Data
(2022) 23:35
functionally and metabolically significantly different
from compartmental subcutaneous ATs (SATs) [4]. It has
been found that SATs are closely related to obesity and
obesity-induced metabolic disease [5]. Pigs (Sus scrofa)
are important biomedical models for studying energy
metabolism and human diseases, such as obesity, type II
diabetes, and cardiovascular diseases because their body
size and physiological/anatomical features are similar to
those of humans [6]. And it offers the possibility of indepth study of the transcription levels of SATs, but this is
difficult in humans.
At present, most of the studies mainly focused on obesity study for SATs using pigs as a model and identified
some important pathways and genes related to obesity
[7–9]. Nevertheless, little attention was paid to the gender difference in obesity. In recent years, some studies
have shown a significant association between subcutaneous fat metabolism and sexes [10–12]. Despite some
progress, the molecular mechanisms of fat formation and
metabolism in SATs involved in gender are still unclear.
Especially, the coexpression relationship of sex-specific
genes in SATs remains unknown.
Weighted Gene Coexpression Network Analysis
(WGCNA) is a systematic biology method to describe
the correlation patterns among genes across samples
[13]. Compared with other methods, WGCNA focuses
on the relationship between coexpression modules and
phenotypes [14]. Using WGCNA can find the gene coexpression modules with higher reliability and biological
significance, and identify “driver” genes in the modules
[15]. Currently, WGCNA has become the most important
way to study the coexpression relationships among genes
and has been successfully applied in various research
fields, such as complex diseases, including hepatocellular carcinoma [16], uveal melanoma [17], hyperlipidemia
[18], and obesity [8, 19], and economic traits, including
meat quality [20], hypoxic adaptation [21] and skin color
[22], etc. Lim et al. identified functional modules and hub
genes, which were related to a marbling trait in Hanwoo
(Korean) cattle using WGCNA method. These hub genes
were mainly involved in biological processes, which were
correlated with fat or muscle formation [23]. Xing et al.
found that four coexpression modules were significantly
correlated with the backfat thickness in Songliao black
and Landrace with high and low backfat using WGCNA
method [24]. Besides, protein and protein interaction
(PPI) networks are also viable tools to construct a gene
coexpression network and understand cell functions
and disease machinery [25]. Zhao et al. identified ADIPOQ, PPARG, LIPE, CIDEC, PLIN1, CIDEA, and FABP4
as potential candidate genes affecting intramuscular fat
(IMF) content in 28 purebred Duroc pigs by integrating
the results from WGCNA and PPI methods [26].
Page 2 of 13
In the present study, RNA-Seq data of abdominal subcutaneous adipose tissue (ASAT) of males and females
(crossbred F2 of Duroc
×
Gưttingen minipig) were
retrieved from Gene Expression Omnibus (GEO) database and were systematically integrated and analyzed
using WGCNA and PPI network analysis methods, with
the aim to identify the significant modules closely related
to the sexes, and further identify key sex-specific pathways and genes in the SATs of pigs. These findings may
contribute to further understanding of the functions of
porcine ATs and the mechanisms of regulating fat metabolism in SATs from pigs of different sexes, and provide
some insights into the obesity treatment in medicine.
Moreover, the identified key sex-specific genes may serve
as potential biomarkers in pig breeding and potential targets in obesity treatment.
Results
Identification of differentially expressed genes (DEGs)
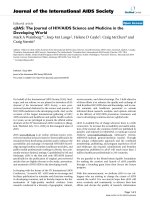
By analyzing the transcriptome sequencing data of SAT
of females and males in three groups (Lean, intermediate
and obese groups) using the limma package, 134 DEGs
(|log2FC|> 1, FDR < 0.1) were detected in the SAT of
females and males in the obese group, of which 47 genes
were significantly up-regulated and 87 genes were significantly down-regulated in females as compared with
males (Fig. 1A, Table S3). However, no DEGs were identified in the lean and intermediate groups. The expression
heatmap of all genes in the obese group was shown in
Fig. 1B.
WGCNA and the significant module identification
The expression matrix containing 5000 genes was used
to reconstruct the gene coexpression network by the
WGCNA method. A Pearson correlation matrix among
genes was converted into a strengthened adjacency
matrix by power β = 5 based on the scale-free topology
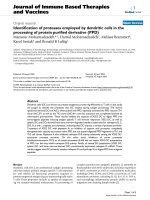
criterion with R2 = 0.9 (Fig. 2A). The topological overlap
measure (TOM) of each gene pair was calculated. Seventeen gene coexpression modules were identified by an
average linkage hierarchical clustering according to the
TOM-based dissimilarity (1-TOM) (Fig. 2B). There were
large differences in the number of genes among the modules. The lightcyan module with the minimum number
contained 137 transcripts, while the turquoise module
with the maximum number contained 855 transcripts
(Table S2).
Correlation analysis between module eigengene (ME)
and the sexes showed that six modules were significantly
correlated with the sexes (P < 0.01). The modules of significantly positively correlated with the male were the
greenyellow module (cor = 0.68 and P = 9e-06) and the
purple module (cor = 0.53 and P = 0.001). The modules
Wang et al. BMC Genomic Data
(2022) 23:35
Page 3 of 13
Fig. 1 Differentially expressed genes (DEGs) analysis. A Volcano plot of all genes in the obese group. X-axis represented log2(fold change). Y-axis
represented -log10(FDR). Blue spots represented down-regulated DEGs and red spots represented up-regulated DEGs. Black spots were not DEGs.
DEGs (females compared with males). B Heatmap of all DEGs (females compared with males) in the obese group. X-axis represented samples. Y-axis
represented genes. Blue represented down-regulated DEGs and red represented up-regulated DEGs. The color scale showed the expression values
of significantly positively correlated with the female
were the green module (cor = 0.49 and P = 0.003), the
pink module (cor = 0.45 and P = 0.008), the midnightblue module (cor = 0.42 and P = 0.01), and the turquoise
module (cor = 0.42 and P = 0.01) (Fig. 2C). The eigengene
adjacency heatmap depicting the cluster relation of the
identified modules and sexes was shown in Fig. 2D. It was
found that the greenyellow module and the green module clustered with the male group and the female group,
respectively. As above, the greenyellow module was most
significantly positively correlated with the male, while
the green module was most significantly positively correlated with the female. Furthermore, the correlation of
module membership (MM) and gene significance (GS)
in the greenyellow module (cor = 0.69 and P < 2.6e-30,
Fig. 2E) and the green module (cor = 0.64 and P < 3.9e-31,
Fig. 2F) indicated that the two modules possessed the top
two significant correlations across all modules. Thus, the
greenyellow module and the green module were selected
for further analyses.
Functional enrichment analysis and key genes
identification for the greenyellow and green modules
GO and KEGG enrichment analyses were performed
on all genes in the greenyellow and green modules
using the Database for Annotation, Visualization
and Integrated Discovery (DAVID). In the greenyellow module, GO enrichment results showed that one
biological process (Activation of MAPK activity) was
significantly enriched (P < 0.05). KEGG enrichment
analysis showed that four KEGG pathways were significantly enriched (P < 0.05), including Ras signaling
pathway, MAPK signaling pathway, Pathways in cancer
and Melanoma. The significant enrichment terms were
shown in Table 1. In the green module, GO enrichment results showed that four biological processes
(Immune response, Chemokine-mediated signaling
pathway, Lymphocyte chemotaxis and Cell chemotaxis) and two molecular functions (Chemokine activity
and Double-stranded RNA binding) were significantly
enriched (P < 0.05). KEGG enrichment analysis showed
that six KEGG pathways were significantly enriched
(P < 0.05), containing Cytosolic DNA-sensing pathway,
Herpes simplex infection, Cytokine-cytokine receptor
interaction, Chemokine signaling pathway, Measles
and Toll-like receptor signaling pathway. The significant enrichment terms were shown in Table 2.
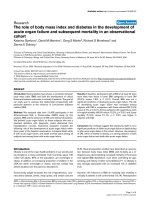
In this study, the key genes were identified according to the criterion that the gene was at least involved
in four KEGG/GO terms. So, four key genes (FGF10,
FGF1, EGFR and IGF1) in the greenyellow module were identified (Fig. 3A). Among the four genes,
FGF10 and IGF1 were significantly down-regulated
in the obese group, while FGF1 was significantly upregulated in the obese group (Table S3). In the green
module, eight genes (DDX58, OAS2, OAS1, CXCL9,
CXCL10, CXCL16, CCL4 and CCL5) were selected
as key genes (Fig. 3B). Among the genes, OAS1 and
CXCL10 were significantly up-regulated in the obese
group (Table S3).
Wang et al. BMC Genomic Data
(2022) 23:35
Page 4 of 13
Fig. 2 WGCNA. A Scale independence and mean connectivity of various soft-thresholding values (β). The left panel (A) displayed the influence
of soft-thresholding power (X-axis) on the scale-free fit index (Y-axis). The right panel (A) showed the influence of soft-thresholding power (X-axis)
on the mean connectivity (degree, Y-axis). B Cluster dendrogram of all filtered genes enriched based on the dissimilarity measure and the cluster
module colors. C Matrix with Module-Trait Relationships (MTRs) and corresponding P-values between the detected modules on the y-axis and
sexes (female and male) on the x-axis. D Heatmap of the adjacencies of modules. Red represented positive correlation and blue represented
negative correlation. The male group clustered with the greenyellow module, and the female group clustered with the green module. Association
between the module membership and gene significance within the greenyellow module (E) and the green module (F). WGCNA, weighted gene
co-expression network analysis
Wang et al. BMC Genomic Data
(2022) 23:35
Page 5 of 13
Table 1 The results of functional enrichment analysis for the greenyellow module using DAVID tool
ID
KEGG/GO terms
Gene symbols
P-value
Count
ssc04014
Ras signaling pathway
IGF1, FGF1, FGF10, EGFR, LOC100522721, PLA1A, FOXO4
0.009318916
7
ssc05200
Pathways in cancer
IGF1, FGF1, FGF10, EGFR, LOC100522721, PLCB4, MMP2, TCF7L2, FZD5
0.013129853
9
ssc04010
MAPK signaling pathway
FGF1, FGF10, LOC100522721, EGFR, CACNA1G, GADD45G, LOC100620270
0.014998697
7
ssc05218
Melanoma
IGF1, FGF1, FGF10, EGFR
0.018487192
4
Activation of MAPK activity
IGF1, FGF1, FGF10, C1QTNF2
0.004864629
4
KEGG
Biological process
GO:0,000,187
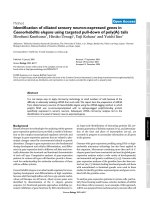
PPI network construction and hub genes identification
for the greenyellow and green modules
The interactive relationships of all genes in the key
module were analyzed by constructing PPI networks.
A PPI network, including 122 nodes and 238 edges
was constructed for the greenyellow module with a
combined score > 0.4 (Fig. 4A). The cytoHubba was
used to screen out hub genes in the whole PPI network. According to the Maximal Clique Centrality
(MCC) score, the top 10 genes (DCN, MMP2, COL1A2,
FKBP10, POSTN, COL1A1, PCOLCE, FMOD, ENSSSCG00000019885 and ENSSSCG00000018633) were
identified as hub genes, and the interactive sub-network, including the 10 hub genes was extracted and
established from the whole PPI network (Fig. 4B).
Function enrichment analysis showed that the eight
genes (except for ENSSSCG00000019885 and ENSSSCG00000018633) were mainly involved in some
KEGG pathways, including Proteoglycans in cancer,
TGF-beta signaling pathway, AGE-RAGE signaling
pathway in diabetic complications, Relaxin signaling
pathway, Diabetic cardiomyopathy, Bladder cancer and
ECM-receptor interaction (Fig. 4C). The significantly
enriched MF terms were Sulfur compound binding,
Glycosaminoglycan binding, Heparin binding and Collagen binding. The significantly enriched CC terms
were Extracellular matrix, and Collagen-containing
extracellular matrix, etc. (Fig. 4D). Three hub genes,
COL1A2, POSTN and FKBP10 were significantly downregulated in females compared with males in the obese
group (Table S3).
A PPI network, including 162 nodes and 914 edges was
constructed for the green module with a combined score
greater than 0.4 (Fig. 5A). According to the MCC score,
10 hub genes (MX1, MX2, IFIT1, IFIT3, ISG15, IRG6,
IFI44, IFI44L, USP18 and DDX60) were identified and the
interactive network was established (Fig. 5B). The 10 hub
genes were enriched in some KEGG pathways, including Hepatitis C, Coronavirus disease-COVID-19, Human
papillomavirus infection, RIG-I-like receptors signal
Table 2 The results of functional enrichment analysis for the green module using DAVID tool
ID
KEGG/GO terms
Gene symbols
P-value
Count
ssc04623
Cytosolic DNA-sensing pathway
CXCL10, CCL5, ZBP1, DDX58, CCL4
7.62E-04
5
ssc05168
Herpes simplex infection
CCL5, LOC100157336, DDX58, TAP2, OAS2, OAS1 IFIT1
0.001407528
7
ssc04060
Cytokine-cytokine receptor interaction
CX3CL1, CXCL10, CCL5, CXCL9, CCL4, CXCL16, IL2RB
0.002333772
7
ssc04062
Chemokine signaling pathway
CX3CL1, CXCL10, CCL5, CXCL9, CCL4, CXCL16
0.006306876
6
ssc05162
Measles
DDX58, OAS2, MX1, OAS1, IL2RB
0.012380535
5
ssc04620
Toll-like receptor signaling pathway
CXCL10, CCL5, CXCL9, CCL4
0.031557568
4
GO:0,006,955
Immune response
CXCL10, CD244, CCL5, LOC100513601, CTSW, OAS2,
OAS1, CXCL9, CCL4
1.41E-05
9
GO:0,070,098
Chemokine-mediated signaling pathway
CXCL10, CCL5, CXCL9, CCL4
0.001153545
4
GO:0,048,247
Lymphocyte chemotaxis
CCL5, CCL4, CXCL16
0.005016185
3
GO:0,060,326
Cell chemotaxis
CXCL10, CCL5, CCL4
0.035772607
3
GO:0,008,009
Chemokine activity
CXCL10, CCL5, CXCL9, CCL4, CXCL16
4.71E-05
5
GO:0,003,725
Double-stranded RNA binding
DDX58, DHX58, OAS2, OAS1
0.001718079
4
KEGG
Biological process
Molecular function
Wang et al. BMC Genomic Data
(2022) 23:35
Page 6 of 13
Fig. 3 Pathway-gene interactive networks for the greenyellow and green modules. A Four KEGG pathways, one GO term and 14 genes were used
to construct a pathway-gene interactive network for the greenyellow module. B Six KEGG pathways, six GO terms and 19 genes were used to
construct a pathway-gene interactive network for the green module. Blue triangles represented KEGG pathway terms. Blue diamonds represented
BP terms, and blue squares represented MF terms. Circles represented genes. Green circles represented key genes and red circles represented non
key genes
pathway, Measles, Influenza A and Epstein-Barr virus
infection (Fig. 5C). BP analysis showed that these genes
were mainly involved in Response to cytokine, Response
to virus, Defense response to symbiont, Defense response
to virus and Response to type I interferon (Fig. 5D). The
enriched MF terms were Nucleoside binding, Ribonucleoside binding, and GTP binding, etc. (Fig. 5D).
Discussion
Key sex‑specific pathways and genes in the greenyellow
module
In our study, a total of 17 coexpression modules were
detected using WGCNA method, of which six modules
were significantly related to the sexes (P < 0.01). Among
the significant modules, the greenyellow module was
most significantly positively correlated with the male
(cor = 0.68, P
<
9e-06). Functional enrichment analysis showed that the genes in the greenyellow module
were mainly involved in Ras signaling pathway, Mitogen-activated protein kinase (MAPK) signaling pathway, Pathways in cancer, Melanoma and Activation of
MAPK activity. It is well known that Ras is an important
upstream regulator of the MAPK, and the Ras-MAPK
signaling pathway can regulate cell proliferation, differentiation, and survival through the kinase cascade [27–
29]. Furthermore, four hub genes (FGF10, FGF1, EGFR
and IGF1) were identified in the greenyellow module
by functional enrichment analysis (Fig. 3A). The results
showed that FGF10, FGF1 and EGFR participated in the
Ras signaling pathway and MAPK signaling pathway, and
IGF1 participated in the Ras signaling pathway (Table 1).
Insulin-like growth factor (IGF1) can lead to the activation of both MAPK and phosphatidylinositol 3-kinase
(PI3K) pathways through Ras [30, 31]. IGF1 is known to
stimulate cell proliferation and inhibit apoptosis [32]. A
study shows that IGF1 action is inhibited in the castrated
animals, which affects adipocyte proliferation and differentiation [33]. Besides, some studies find that fibroblast
growth factor receptor (FGFR) and epidermal growth
factor receptor (EGFR) also participate in activating the
Ras-MAPK signaling pathway [34, 35]. FGF1 and FGF10
belong to the fibroblast growth factor family, which are
widely involved in the regulation of cell growth, proliferation, differentiation and regulation of metabolism
through FGFR [36, 37]. Some studies suggest that FGF10
stimulates preadipocyte proliferation and differentiation
through activating FGFR2 [38, 39]. As the above, IGF1,
FGF1, FGF10 and EGFR played an important role in activating the Ras-MAPK signaling pathway and promoting
adipocyte proliferation and differentiation. Currently, the
four genes were not reported in the SATs of pigs of different sexes. Among genes, FGF10 and IGF1 were significantly down-regulated in females compared with males
in the obese group, while FGF1 was significantly upregulated in the obese group. Thus, it could be inferred
that FGF10 and IGF1 might play key roles in promoting
Wang et al. BMC Genomic Data
(2022) 23:35
Page 7 of 13
Fig. 4 Protein protein interaction (PPI) network for the greenyellow module. A The whole PPI network. There were 122 nodes and 238 edges in
the network. These nodes (circles) represented genes, and bigger nodes represented genes with more links. Edges (gray lines) between nodes
indicated the interaction of genes in the network. Yellow circles represented non DEGs. Red circles represented up-regulated DEGs. Blue circles
represented down-regulated DEGs. DEGs (females compared with males). B The PPI sub-network. There were 10 nodes and 34 edges in the
network. Color represented Maximal Clique Centrality (MCC) score, and the darker the color, the higher MCC score of the node. Diamond nodes
represented down-regulated DEGs. DEGs (females compared with males). Functional enrichment analysis for eight hub genes, including KEGG
enrichment analysis (C) and GO enrichment analysis (D). Top 10 terms and top 5 terms ordered by P.adjust for the KEGG and GO enrichment
analysis, respectively. P.adjust indicated the degree of enrichment, with smaller P.adjust indicating terms that were more likely to play significantly
functional roles
adipocyte proliferation and differentiation in the SATs of
boars through the Ras-MAPK signaling pathway.
Besides, eight hub genes, including COL1A2, COL1A1,
DCN, MMP2, POSTN, FMOD, FKBP10 and PCOLCE
were identified by the PPI network analysis (Fig. 4B).
Functional enrichment analysis showed that these genes
were significantly enriched in Proteoglycans in cancer,
AGE-RAGE signaling pathway in diabetic complications,
Relaxin signaling pathway, Extracellular matrix (ECM),
ECM-receptor interaction, Collagen binding, and Collagen-containing extracellular matrix, etc. (Fig. 4C, D). The
result was very similar to that from the study of Poklukar
et al. [33], and their findings showed that the upregulated
genes in entire males as compared with immunocastrated
males and surgical castrates were significantly enriched
in extracellular region/matrix cellular components, ECM
receptor interaction and focal adhesion pathways. Some
genes responsible for the differences in backfat deposition among the three male sex categories were identified including COL1A2, COL6A3, POSTN, P4HA3, DCN,
FMOD, MMP2 and MMP27 [33]. In the ECM remodeling, COL1A2 and COL1A1 genes involve the synthesis
of collagen, which is the major component of ECM [40].
DCN (Decorin) gene encodes the ECM protein (DCN),
which belongs to the small leucine-rich proteoglycan
family. DCN protein can regulate the bioactivities of cell
Wang et al. BMC Genomic Data
(2022) 23:35
Page 8 of 13
Fig. 5 Protein protein interaction (PPI) network for the green module. A The whole PPI network. There were 162 nodes and 914 edges in the
network. These nodes (circles) represented genes, and bigger nodes represented genes with more links. Edges (gray lines) between nodes indicated
the interaction of genes in the network. Yellow circles represented non DEGs. Red circles represented up-regulated DEGs. DEGs (females compared
with males). B The PPI sub-network. There were 10 nodes and 45 edges in the network. Color represented MCC score, and the darker the color,
the higher MCC score of the node. Functional enrichment analysis for 10 hub genes, including KEGG enrichment analysis (C) and GO enrichment
analysis (D). Top 10 terms and top 5 terms ordered by P.adjust for the KEGG and GO enrichment analysis, respectively
growth factors and participate in ECM assembly [41].
Matrix metalloproteinase 2 (MMP2) gene involves ECM
degradation [42]. POSTN gene is crucial for collagen
cross-linking and ECM maintenance [43, 44]. Similarly,
FMOD gene is required for proper collagen folding and
ECM stabilization [45]. FKBP10 gene is responsible for
regulating ECM protein crosslinking and secretion [46].
PCOLCE gene can regulate the production of a secreted
glycoprotein called procollagen C-proteinase enhancer
protein that enhances the activity of procollagen C-proteinases to participate in ECM reconstruction [47, 48]. As
above, eight hub genes (COL1A2, COL1A1, DCN, MMP2,
POSTN, FMOD, FKBP10 and PCOLCE) played an important role in the ECM remodeling in the SATs of pigs.
Some studies show that ECM remodeling plays many
vital roles in ATs. Firstly, it is necessary during the early
stage of angiogenesis in ATs [49]. Secondly, it is also
associated with the modulation of adipogenesis during adipose tissue expansion [49]. Adipocyte differentiation is regulated by the deposition of collagen (the
major component of ECM) [50]. Besides, excess deposition of collagen in obesity can cause AT fibrosis, which
leads to AT inflammation by triggering the infiltration of immune cells such as macrophages [51, 52]. A
study finds that ECM also participates in activating the
Ras-MAPK signaling pathway [53]. Thus, ECM remodeling played an indispensable role in angiogenesis, adipogenesis and adipocyte differentiation of ATs. In this
study, three ECM-related genes (COL1A2, POSTN and
Wang et al. BMC Genomic Data
(2022) 23:35
FKBP10) were significantly down-regulated in females
compared with males in the obese group. Jeong et al.
measured the expression levels of ECM-related genes in
different adipose tissues from bulls, cows and steers of
Korean cattle (Hanwoo), and found that the expressions
of ECM-related genes in the omental adipose tissue of
cows and steers are decreased, and expression levels of
most ECM-related genes were generally similar between
cows and steers [54]. Poklukar et al. found that castration of male pigs resulted in the downregulation of genes
involved in ECM dynamics [33]. The results of these
studies were similar to those of this study. As above, it
could be speculated that COL1A2, POSTN and FKBP10
might play more key roles in promoting angiogenesis and
adipogenesis of boars through ECM remodeling in SATs.
In summary, two key male-specific pathways (Ras-MAPK
signaling pathway and ECM remodeling) and five key
male-specific genes (IGF1, FGF10, COL1A2, POSTN and
FKBP10) might play key roles in angiogenesis and adipogenesis in the SATs of male pigs.
Key sex‑specific pathways and genes in the green module
In the current study, the green module was most significantly positively correlated with the female among
the significant modules (cor = 0.49, P < 0.003). The genes
in the green module were mainly enriched in Immune
response, Chemokine-mediated signaling pathway,
Chemokine activity, Chemokine signaling pathway,
Cytokine-cytokine receptor interaction, Cytosolic DNAsensing pathway, Herpes simplex infection, Measles,
and Toll-like receptor signaling pathway, etc. (Table 2).
These pathways are closely related to innate immunity
and inflammatory response [55–58]. It is well known
that Toll-like receptors play an essential role in the
innate immune system and inflammatory response [59].
Inflammation is a central component of innate immunity. The inflammatory response involves an increase in
the synthesis and secretion of several mediators, including chemokines and cytokines. Chronic inflammation in
obesity is directly involved in the etiology of cardiovascular diseases and certain cancer types [60].
Furthermore, eight hub genes, DDX58, OAS1, OAS2,
CXCL9, CXCL10, CXCL16, CCL4 and CCL5 in the
green module were identified by the functional enrichment analysis (Fig. 3B). And 10 hub genes, MX1, MX2,
IFIT1, IFIT3, ISG15, IRG6, IFI44, IFI44L, USP18 and
DDX60 were identified by the PPI analysis (Fig. 5B).
Functional enrichment analysis showed that the 10 hub
genes (MX1, MX2, etc.) were enriched in RIG-I-like
receptors (RLRs) signal pathway, Hepatitis C, Immune
effector process, Response to virus, Response to type I
interferon, and Response to cytokine, etc. (Fig. 5C, D).
A study shows that the RLRs play essential roles in the
Page 9 of 13
production of type I interferons (IFNs) and proinflammatory cytokines in cell type-specific manners [61]. It
has been reported that the DDX60 gene can promote
RLRs receptor signaling [62]. DDX58 gene belongs to
one of the crucial members of the RLRs family, which
can promote the production of type I IFN [63, 64].
And then, type I IFN activates kinase-driven signaling
to drive the expression of more than 2000 IFN-stimulated genes (ISGs) [65, 66]. As is known to all, Type I
IFN plays indispensable roles in immunity and proinflammation via induction of the production of ISGs
through activating Janus kinase (JAK)-signal transducer
and activator of transcription (STAT) signaling pathway [67]. In this study, the hub genes, including CXCL9,
CXCL10, CXCL16, CCL4 and CCL5 belong to IFNinduced chemokines [68–70], which participate in the
Toll-like receptor signaling pathway. These IFN-induced
chemokines might play a vital role in the inflammatory
response of SATs from pigs. Some studies show that the
11 hub genes (OAS1, OAS2, IFIT1, IFIT3, ISG15, IRG6,
IFI44, IFI44L, USP18, MX1 and MX2 were identified
in the study) belong to the Type I ISGs, which participate in mediating autoimmune diseases and chronic
inflammatory diseases through activating inflammatory
responses and innate immunity responses [61, 67, 71].
Currently, the 18 hub genes were not reported in the
immunity and inflammation in the SATs of pigs of different sexes. Among 18 genes, OAS1 and chemokines
CXCL10 were significantly up-regulated in females compared with males in the obese group. The two DEGs
might play more key roles in autoimmunity and proinflammation in SATs of the obese female pigs. In summary,
some key female-specific pathways and biological processes (Chemokine signaling pathway, Cytokine-cytokine
receptor interaction, Toll-like receptor signaling pathway,
RLRs signal pathway, Immune response, and Response to
type I interferon, etc.) and two key female-specific genes
(CXCL10 and OAS1) participating in type I interferon
response might play vital roles in innate immunity and
proinflammation in the SATs of female pigs.
However, some limitations must be noted in this study.
First, the small sample size limited the statistical power
to identify the hub genes. Second, molecular biological
experiments were required to validate the function of
these hub genes in the SATs.
Conclusions
The systematic associations between SATs and sexes were
found, and sex-specific pathways and genes in the SATs
of pigs were identified. Males have more abilities in angiogenesis and adipogenesis through activating the RasMAPK signaling pathway and ECM remodeling in SATs
compared with females. Females have stronger abilities
Wang et al. BMC Genomic Data
(2022) 23:35
in autoimmunity and proinflammatory via induction
of the production of ISGs through activating type I
interferon response in SATs compared with males. The
identified key sex-specific pathways and genes in SATs
from pigs provided some new insights into the molecular mechanism of being involved in fat metabolism and
immunoregulation between pigs of different sexes. These
findings may be helpful for breeding in the pig industry
and obesity treatment in medicine.
Methods
Data collection and processing
The transcriptome datasets (GSE61271_normalizeddata.csv.gz) and the phenotypic datasets (GSE61271_
series_matrix.txt.gz) were downloaded from the public
NCBI GEO database (https://www.ncbi.nlm.nih.gov/
geo/query/acc.cgi?acc=GSE61271). The raw sequencing data (100 bp pair-ended fragments, about 30 M reads
per sample) were obtained using the Illumina platform.
The sequencing samples were collected from the SATs
of crossbred F2 pigs (Duroc × Gưttingen minipig). Gưttingen minipig is genetically susceptible to obesity and
shares a variety of metabolic diseases with humans [72].
According to the descriptions of the original paper [8],
the 36 F2 pigs (17 females and 19 males) were produced
at the research farm, the University of Copenhagen
Tåstrup, Denmark. Basing on the selection index theory,
Kogelman et al. created the Obesity Index (OI) to represent the degree of obesity in each pig. According to OI, 36
pigs were categorized into three groups: 12 low OI (Lean,
L), 12 intermediate OI (Intermediate, I), and 12 high OI
(Obese, O). Among the selected pigs, there was a large
difference in age at slaughter (L: 309 days, I: 234 days,
O: 218 days), as they were slaughtered at approximately
100 kg.
In order to balance the sample number of male and
female pigs, two samples of males (GSM1501206 and
GSM1501208) in the lean group were randomly eliminated. A total of 34 samples (17 females and 17 males)
were selected for this study. The samples with different
obesity levels in the three groups were evenly distributed
in the two sex groups. Details about samples were shown
in Table 3 and Table S1.
Page 10 of 13
ggplot2, while as a heatmap plot using the R function
pheatmap.
WGCNA
WGCNA was used to construct the gene coexpression
network, and identify the coexpression gene modules.
The WGCNA package (version 1.13) based on R was
used to perform WGCNA [15]. First, the expression
matrix was converted into an adjacency matrix, and an
unsupervised coexpression relationship was constructed
based on the adjacency matrix using Pearson correlation coefficients for gene pairs. The correlation adjacency
matrix was strengthened by power β (soft threshold), and
the power parameter was selected based on the scale-free
topology criterion.
Second, the adjacency matrix was transformed into a
topology matrix. TOM was used to measure the correlation of gene pairs. According to 1-TOM, average linkage
hierarchical clustering was performed to classify genes
with coherent expression profiles into gene modules.
The dynamic cutting algorithm was used to identify gene
modules from the system cluster tree. Module eigengene
(ME) was defined as the first principal component and
was the representative of module genes. Module membership (MM) was defined as the correlation between ME
and gene module. Gene significance (GS) was indexed by
log10 transformation of the P-value of the T-test. GS of
0 indicates that the gene was not significant with regard
to the biological question of interest. The GS could take
on positive or negative values. Module significance (MS)
was defined as the average of GS for all the genes in the
module. A more detailed description of WGCNA was
presented in an original article [13].
Finally, the statistical significance of the relationship
between modules and sexes was analyzed by calculating the Pearson correlation coefficient. For studying the
genes in the module correlating with sexes, modules with
p values < 0.01 were selected as significant modules in this
study. And then, the module with the significant positive
correlation (cor > 0) with males and females among all the
significant modules was selected as the key module for
further analysis, respectively.
Differential expression genes analysis
The transcriptome datasets, including 5000 genes were
used to construct the expression matrix. Differential
expression analysis of the females and males in three
groups (Lean, Intermediate and Obese groups) was performed separately using the limma package [73]. In the
study, genes with |log2FC|> 1 and FDR < 0.1 were referred
to as the differentially expressed genes (DEGs). The DEGs
were visualized as a volcano plot using the R package
Table 3 The sample information of 34 pigs
Sex
Total
Lean
Intermediate
Obese
Females
17
5
6
6
Males
17
5
6
6
According to Obesity Index (OI), 34 pigs (17 females and 17 males) were divided
into three groups: the Lean, Intermediate and Obese groups, which represented
different obesity levels of pigs in each group
Wang et al. BMC Genomic Data
(2022) 23:35
PPI network construction and analysis
The interactive relationships among genes encoding proteins in the key gene coexpression module were analyzed
by constructing a PPI network. The interactive information among genes encoding proteins was retrieved from
the Search Tool for the Retrieval of Interacting Genes
(STRING) database (version 11.5, https://string-db.org/).
The gene pairs with a combined score ≥ the medium confidence of 0.4 were used to construct the PPI network.
The Cytoscape (v3.8.0) software was used to construct
and visualize the interactive relationships among genes in
the whole PPI network [74].
Functional enrichment analysis
GO and KEGG pathway terms of all genes in the key
module were analyzed using the online DAVID database
(version 6.80, https://david.ncifcrf.gov/) [75]. The cutoff criterion was set at P-value < 0.05. Cytoscape (v3.8.0)
software was used to construct and visualize the interactive relationships between genes and functional enrichment terms in the whole network. Functional enrichment
analysis for hub genes in the PPI sub-network was implemented using the R-package clusterProfiler [75, 76]. The
cut-off criterion of KEGG was set at P-value < 0.1, and
the cut-off criterion of GO was set at P-value < 0.01 and
q-value < 0.05. GO annotation result includes three main
bodies: biological process (BP), molecular function (MF)
and cellular component (CC).
Hub genes identification
Hub genes in the whole PPI network from the key modules were identified by the cytoHubba algorithm in the
Cytoscape software, and the criterion for selecting hub
genes was that the top 10 nodes ranked by Maximal
Clique Centrality (MCC) [77]. Key genes in key modules
were identified using the functional enrichment network
analysis. The selection criterion of key genes in the module was that the gene was at least involved in four KEGG/
GO terms.
Abbreviations
AT: Adipose tissue; VAT: Visceral AT; SAT: Subcutaneous AT; ASAT: Abdominal
SAT; GEO: Gene Expression Omnibus; DEGs: Differential expression genes;
WGCNA: Weighted gene coexpression network analysis; TOM: Topological
overlap measure; 1-TOM: TOM-based dissimilarity; ME: Module eigengene; GS:
Gene significance; MM: Module membership; MS: Module significance; DAVID:
Database for Annotation, Visualization and Integrated Discovery; STRING:
Search Tool for the Retrieval of Interacting Genes; PPI: Protein and protein
interaction; MCC: Maximal clique centrality; ECM: Extracellular matrix; MAPK:
Mitogen-activated protein kinase; JAK-STAT: Janus kinase-signal transducer
and activator of transcription; IFN: Interferon; ISG: IFN-stimulated gene; RLR:
RIG-I-like receptor; BP: Biological process; MF: Molecular function; CC: Cellular
component.
Page 11 of 13
Supplementary Information
The online version contains supplementary material available at https://doi.
org/10.1186/s12863-022-01054-w.
Additional file 1: Table S1.Grouping information of 34 samples.
Additional file 2: Table S2.The number of genes in each of the 17
modules.
Additional file 3: Table S3. The results of differentially expressed genes
(DEGs) analysis for the obese group.
Acknowledgements
Not applicable.
Authors’ contributions
HYW, XYW, SXL and QC processed and analyzed the data. MLL and SYW
assisted with the processing of data. HYW and XYW wrote the manuscript that
was subsequently revised by SXL and QC. All authors have read and approved
the final manuscript.
Funding
This study was supported by the Yunnan Swine Industry Technology System
Program (2019KJTX0013) and Yunnan Province Important National Science
& Technology Specific Projects (202102AE090039). These funding agencies
played no role in the design of the study, data collection, analysis and interpretation, or in writing the manuscript.
Availability of data and materials
The transcriptome datasets (GSE61271_normalizeddata.csv.gz) and the phenotypic datasets (GSE61271_series_matrix.txt.gz) analyzed during the current
study are available in the public NCBI GEO database (https://www.ncbi.nlm.
nih.gov/geo/query/acc.cgi?acc=GSE61271) [8].
Declarations
Ethics approval and consent to participate
Not applicable.
Consent for publication
Not applicable.
Competing interests
The authors declare that they have no conflict of interest.
Author details
1
Faculty of Animal Science and Technology, Yunnan Agricultural University, No.
95 of Jinhei Road, Kunming 650201, Yunnan, China. 2 Faculty of Animal Science,
Xichang University, Xichang 615000, Sichuang, China.
Received: 12 October 2021 Accepted: 4 May 2022
References
1. Galic S, Oakhill JS, Steinberg GR. Adipose tissue as an endocrine organ.
Mol Cell Endocrinol. 2010;316(2):129–39. https://doi.org/10.1016/j.mce.
2009.08.018.
2. MacDougald OA, Burant CF. The rapidly expanding family of adipokines.
Cell Metab. 2007;6(3):159–61. https://doi.org/10.1016/j.cmet.2007.08.010.
3. Rosen ED, Spiegelman BM. Adipocytes as regulators of energy balance
and glucose homeostasis. Nature. 2006;444:847–53. https://doi.org/10.
1038/nature05483.
4. Ibrahim MM. Subcutaneous and visceral adipose tissue: structural and
functional differences. Obes Rev. 2010;11(1):11–8. https://doi.org/10.
1111/j.1467-789X.2009.00623.x.
Wang et al. BMC Genomic Data
(2022) 23:35
5. Tran TT, Yamamoto Y, Gesta S, Kahn CR. Beneficial effects of subcutaneous
fat transplantation on metabolism. Cell Metab. 2008;7(5):410–20. https://
doi.org/10.1016/j.cmet.2008.04.004.
6. Robich MP, Osipov RM, Nezafat R, Feng J, Clements RT, Bianchi C,
et al. Resveratrol improves myocardial perfusion in a swine model of
hypercholesterolemia and chronic myocardial ischemia. Circulation.
2010;122(11_suppl_1):S142–9. https://doi.org/10.1161/CIRCULATIO
NAHA.109.920132.
7. Li MZ, Wu HL, Luo ZG, Xia YD, Guan JQ, Wang T. An atlas of DNA methylomes in porcine adipose and muscle tissues. Nat Commun. 2012;3:850.
https://doi.org/10.1038/ncomms1854.
8. Kogelman LJA, Cirera S, Zhernakova DV, Fredholm M, Franke L, Kadarmideen HN. Identification of co-expression gene networks, regulatory
genes and pathways for obesity based on adipose tissue RNA sequencing in a porcine model. BMC Med Genomics. 2014;7:57. https://doi.org/
10.1186/1755-8794-7-57.
9. Kogelman LJA, Zhernakova DV, Westra HJ, Cirera S, Fredholm M, Franke
L, et al. An integrative systems genetics approach reveals potential
causal genes and pathways related to obesity. Genome Med. 2015;7:105.
https://doi.org/10.1186/s13073-015-0229-0.
10. Dunshea F, D’souza D. A review: fat deposition and metabolism in the pig.
Manipulating Pig Production IX. 2003;127–50.
11. Zhou S, Li M, Li Q, Guan J, Li X. Differential expression analysis of porcine
MDH1, MDH2 and ME1 genes in adipose tissues. Genet Mol Res.
2012;11(2):1254–9. https://doi.org/10.4238/2012.May.9.4.
12. Mentzel CMJ, Anthon C, Jacobsen MJ, Karlskov-Mortensen P, Bruun CS,
Jørgensen CB, et al. Gender and obesity specific microRNA expression in
adipose tissue from lean and obese pigs. PLoS One. 2015;10(7):e0131650.
https://doi.org/10.1371/journal.pone.0131650.
13. Zhang B, Horvath S. A general framework for weighted gene co-expression network analysis. Stat Appl Genet Mol Biol. 2005;4(1):17. https://doi.
org/10.2202/1544-6115.1128.
14. Chou W, Cheng A, Brotto M, Chuang C. Visual gene-network analysis
reveals the cancer gene co-expression in human endometrial cancer.
BMC Genomics. 2014;15:300. https://doi.org/10.1186/1471-2164-15-300.
15. Langfelder P, Horvath S. WGCNA: an R package for weighted correlation
network analysis. BMC Bioinformatics. 2008;9:559. https://doi.org/10.
1186/1471-2105-9-559.
16. Yin L, Cai Z, Zhu B, Xu C. Identification of key pathways and genes in the
dynamic progression of HCC based on WGCNA. Genes. 2018;9(2):92.
https://doi.org/10.3390/genes9020092.
17 Wan Q, Tang J, Han Y, Wang D. Co-expression modules construction by
WGCNA and identify potential prognostic markers of uveal melanoma.
Exp Eye Res. 2018;166:13–20. https://doi.org/10.1016/j.exer.2017.10.007.
18 Liao FJ, Zheng PF, Guan YZ, Pan HW, Li W. Weighted gene co-expression
network analysis to identify key modules and hub genes related to
hyperlipidaemia. Nutr Metab. 2021;18(1):24. https://doi.org/10.1186/
s12986-021-00555-2.
19. Han Y, Wang W, Jia J, Sun X, Kuang D, Tong P, et al. WGCNA analysis of the
subcutaneous fat transcriptome in a novel tree shrew model. Exp Biol
Med. 2020;245(11):945–55. https://doi.org/10.1177/1535370220915180.
20. Kogelman LJ, Byrne K, Vuocolo T, Watson-Haigh NS, Kadarmideen
HN, Kijas JW, et al. Genetic architecture of gene expression in ovine
skeletal muscle. BMC Genom. 2011;12(1):607. https://doi.org/10.1186/
1471-2164-12-607.
21. Bao Q, Zhang X, Bao P, Liang C, Guo X, Chu M, et al. Using weighted gene
co-expression network analysis (WGCNA) to identify the hub genes
related to hypoxic adaptation in yak (Bos grunniens). Genes Genomics.
2021;43:1231–46. https://doi.org/10.1007/s13258-021-01137-5.
22. Wang L, Liu H, Hu B, Hu J, Li L. Transcriptome reveals genes involving in
black skin color formation of ducks. Genes Genomics. 2021;43(2):173.
https://doi.org/10.1007/s13258-020-01026-3.
23. Lim D, Lee S, Kim N, Cho Y, Chai H, Seong H, et al. Gene co-expression
analysis to characterize genes related to marbling trait in Hanwoo
(Korean) cattle. Asian Australas J Anim Sci. 2013;26(1):19–29. https://doi.
org/10.5713/ajas.2012.12375.
24. Xing K, Liu H, Zhang F, Liu Y, Shi Y, Ding X, et al. Identification of key genes
affecting porcine fat deposition based on co-expression network analysis
of weighted genes. J Anim Sci Biotechnol. 2021;12:100. https://doi.org/
10.1186/s40104-021-00616-9.
Page 12 of 13
25. Vella D, Marini S, Vitali F, Di Silvestre D, Mauri G, Bellazzi R. MTGO: PPI
network analysis via topological and functional module identification. Sci
Rep. 2018;8:5499. https://doi.org/10.1038/s41598-018-23672-0.
26. Zhao X, Hu H, Lin H, Wang C, Wang Y, Wang J. Muscle transcriptome
analysis reveals potential candidate genes and pathways affecting intramuscular fat content in pigs. Front Genet. 2020;11:877. https://doi.org/10.
3389/fgene.2020.00877.
27. Mitin N, Rossman KL, Der CJ. Signaling interplay in Ras superfamily function. Curr Biol. 2005;15:R563–74. https://doi.org/10.1016/j.cub.2005.07.
010.
28. Ory S, Morrison DK. Signal transduction: implications for Ras-dependent
ERK signaling. Curr Biol. 2004;14:R277–8. https://doi.org/10.1016/j.cub.
2004.03.023.
29. Zhang W, Liu H. MAPK signal pathways in the regulation of cell proliferation in mammalian cells. Cell Res. 2002;12:9–18. https://doi.org/10.1038/
sj.cr.7290105.
30 Benito M, Valverde AM, Lorenzo M. IGF-I: a mitogen also involved in
differentiation processes in mammalian cells. Int J Biochem Cell Biol.
1996;28(5):499–510. https://doi.org/10.1016/1357-2725(95)00168-9.
31. Xie L, Jiang Y, Yang P, Chen J, Doan H, Herndon B. Effects of dietary calorie
restriction or exercise on the PI3K and Ras signaling pathways in the skin
of mice. J Biol Chem. 2007;282(38):28025–35. https://doi.org/10.1074/jbc.
M604857200.
32. Werner H, Le Roith D. New concepts in regulation and function of the
insulin-like growth factors: implications for understanding normal growth
and neoplasia. Cell Mol Life Sci. 2000;57:932–42. https://doi.org/10.1007/
PL0000073.
33. Poklukar K, Čandek-Potokar M, Vrecl M, Batorek-Lukač N, Fazarinc G,
Kress K, et al. Adipose tissue gene expression of entire male, immunocastrated and surgically castrated pigs. Int J Mol Sci. 2021;22(4):1768.
https://doi.org/10.3390/ijms22041768.
34. Schlessinger J. Common and distinct elements in cellular signaling via
EGF and FGF receptors. Science. 2004;306(5701):1506–7. https://doi.
org/10.1126/science.1105396.
35. Cooper JF, Guasp RJ, Arnold ML, Grant BD, Driscoll M. Stress increases
in exopher-mediated neuronal extrusion require lipid biosynthesis,
FGF, and EGF RAS/MAPK signaling. PNAS. 2021;118(36):e2101410118.
https://doi.org/10.1073/pnas.2101410118.
36. Fernandes-Freitas I, Owen BM. Metabolic roles of endocrine fibroblast
growth factors. Curr Opin Pharmacol. 2015;25:30–5. https://doi.org/10.
1016/j.coph.2015.09.014.
37. Itoh N, Ornitz DM. Fibroblast growth factors: from molecular evolution to roles in development, metabolism and disease. J Biochem.
2010;149(2):121–30. https://doi.org/10.1093/jb/mvq121.
38. Fischer C, Seki T, Lim S, Nakamura M, Andersson P, Yang Y. A miR-327FGF10-FGFR2-mediated autocrine signaling mechanism controls white
fat browning. Nat Commun. 2017;8(1):2079. https://doi.org/10.1038/
s41467-017-02158-z.
39. Ohta H, Konishi M, Itoh N. FGF10 and FGF21 as regulators in adipocyte
development and metabolism. Endocr Metab Immune Disord Drug
Targets. 2011;11(4):302–9. https://doi.org/10.2174/187153011797881
166.
40 Ruiz-Ojeda FJ, Méndez A, Aguilera CM, Plaza-Díaz J. Extracellular matrix
remodeling of adipose tissue in obesity and metabolic diseases. Int J
Mol Sci. 2019;20(19):4888. https://doi.org/10.3390/ijms20194888.
41. Zhang W, Ge Y, Cheng Q, Zhang Q, Fang L, Zheng J. Decorin is a pivotal
effector in the extracellular matrix and tumour microenvironment.
Oncotarget. 2018;9(4):5480–91. https://doi.org/10.18632/oncotarget.
23869.
42. Bonnans C, Chou J, Werb Z. Remodelling the extracellular matrix in development and disease. Nat Rev Mol Cell Biol. 2014;15:786–801. https://doi.
org/10.1038/nrm3904.
43. Fumiko N, Masataka N, Takahiro H, Hitoo N, Yasuhiro N, Osamu B,
et al. Loss of periostin ameliorates adipose tissue inflammation and
fibrosis in vivo. Sci Rep. 2018;8(1):8553. https://doi.org/10.1038/
s41598-018-27009-9.
44. Schwanekamp JA, Lorts A, Vagnozzi RJ, Vanhoutte D, Molkentin JD.
Deletion of periostin protects against atherosclerosis in mice by altering
inflammation and extracellular matrix remodeling. Arterioscler Thromb
Vasc Biol. 2016;36(1):60–8. https://doi.org/10.1161/ATVBAHA.115.306397.
Wang et al. BMC Genomic Data
(2022) 23:35
45. Font B, Eichenberger D, Rosenberg LM, Rest MVD. Characterization of the
interactions of type XII collagen with two small proteoglycans from fetal
bovine tendon, decorin and fibromodulin. Matrix Biol. 1996;15(5):341–8.
https://doi.org/10.1016/S0945-053X(96)90137-7.
46. Liang X, Chai B, Duan R, Zhou Y, Huang X, Li Q. Inhibition of FKBP10 attenuates hypertrophic scarring through suppressing fibroblast activity and
extracellular matrix deposition. J Investig Dermatol. 2017;137(11):2326–
35. https://doi.org/10.1016/j.jid.2017.06.029.
47. Vadon-Le Goff S, Kronenberg D, Bourhis JM, Bijakowski C, Raynal N, Ruggiero F, et al. Procollagen C-proteinase enhancer stimulates procollagen
processing by binding to the C-propeptide region only. J Biol Chem.
2011;286:38932–8. https://doi.org/10.1074/jbc.M111.274944.
48. Pulido D, Sharma U, Vadon-Le Goff S, Hussain SA, Cordes S, Mariano N,
et al. Structural basis for the acceleration of procollagen processing by
procollagen C-proteinase enhancer-1. Structure. 2018;26(1384–92):e3.
https://doi.org/10.1016/j.str.2018.06.011.
49. Choe SS, Huh JY, Hwang IJ, Kim JI, Kim JB. Adipose tissue remodeling: its
role in energy metabolism and metabolic disorders. Front Endocrinol.
2016;7:30. https://doi.org/10.3389/fendo.2016.00030.
50. Chun TH, Hotary KB, Sabeh F, Saltiel AR, Allen ED, Weiss SJ. A pericellular
collagenase directs the 3-dimensional development of white adipose
tissue. Cell. 2006;125:577–91. https://doi.org/10.1016/j.cell.2006.02.050.
51. Khan T, Muise ES, Iyengar P, Wang ZV, Chandalia M, Abate N, et al. Metabolic dysregulation and adipose tissue fibrosis: role of collagen VI. Mol
Cell Biol. 2009;29:1575–91. https://doi.org/10.1128/MCB.01300-08.
52. Pasarica M, Gowronska-Kozak B, Burk D, Remedios I, Hymel D, Gimble
J, et al. Adipose tissue collagen VI in obesity. J Clin Endocrinol Metab.
2009;94:5155–62. https://doi.org/10.1210/jc.2009-0947.
53. Schindeler A, Little DG. Ras-MAPK signaling in osteogenic differentiation:
friend or foe? J Bone Miner Res. 2006;21(9):1331–8. https://doi.org/10.
1359/jbmr.060603.
54. Jeong JY, Ibrahim M, Kim MJ, So K, Jeong YD, Park S, et al. Comparisons
of extracellular matrix-related gene expression levels in different adipose
tissues from Korean cattle. Livest Sci. 2017;198:138–46. https://doi.org/10.
1016/j.livsci.2017.02.020.
55. Barber GN. STING-dependent cytosolic DNA sensing pathways. Trends
Immunol. 2014;35(2):88–93. https://doi.org/10.1016/j.it.2013.10.010.
56. Wang J, Knau H. Chemokine signaling in development and disease.
Development. 2014;141(22):4199–205. https://doi.org/10.1242/dev.
101071.
57. Ye M, Bao H, Meng Y, Guan L, Stothard P, Plastow G. Comparative
transcriptomic analysis of porcine peripheral blood reveals differentially
expressed genes from the cytokine-cytokine receptor interaction pathway related to health status. Genome. 2017;60(12):1–36. https://doi.org/
10.1139/gen-2017-0074.
58 Kawasaki T, Kawai T. Toll-like receptor signaling pathway. Front Immunol.
2014;5:461. https://doi.org/10.3389/fimmu.2014.00461.
59. Carvalho FA, Aitken JD, Vijay-Kumar M, Gewirtz AT. Toll-like receptorgut microbiota interactions: perturb at your own risk! Annu Rev
Physiol. 2012;74(1):177–98. https://doi.org/10.1146/annurev-physi
ol-020911-153330.
60. Rogero MM, Calder PC. Obesity, inflammation, toll-like receptor 4 and
fatty acids. Nutrients. 2018;10:432. https://doi.org/10.3390/nu10040432.
61. Takeuchi O, Akira S. Innate immunity to virus infection. Immunol Rev.
2010;227(1):75–86. https://doi.org/10.1111/j.1600-065X.2008.00737.x.
62. Schoggins JW, Rice CM. Interferon-stimulated genes and their antiviral
effector functions. Curr Opin Virol. 2011;1(6):519–25. https://doi.org/10.
1016/j.coviro.2011.10.008.
63. Chiang JJ, Davis ME, Gack MU. Regulation of RIG-I-like receptor signaling
by host and viral proteins. Cytokine Growth Factor Rev. 2014;25(5):491–
505. https://doi.org/10.1016/j.cytogfr.2014.06.005.
64. Eisenächer K, Krug A. Regulation of RLR-mediated innate immune signaling-it is all about keeping the balance. Eur J Cell Biol. 2012;91(1):36–47.
https://doi.org/10.1016/j.ejcb.2011.01.011.
65. Borden EC, Sen GC, Uze G, Silverman RH, Ransohoff RM, Foster GR, et al.
Interferons at age 50: past, current and future impact on biomedicine.
Nat Rev Drug Discov. 2007;6(12):975–90. https://doi.org/10.1038/nrd24
22.
66. González-Navajas JM, Lee J, David M, Raz E. Immunomodulatory functions of type I interferons. Nat Rev Immunol. 2012;12(2):125–35. https://
doi.org/10.1038/nri3133.
Page 13 of 13
67 Chen K, Liu J, Cao X. Regulation of type I interferon signaling in immunity
and inflammation: a comprehensive review. J Autoimmun. 2017;83:1–11.
https://doi.org/10.1016/j.jaut.2017.03.008.
68. Hyrcza MD, Kovacs C, Loutfy M, Halpenny R, Heisler L, Yang S, et al.
Distinct transcriptional profiles in Ex vivo CD4+ and CD8+ T cells are
established early in human immunodeficiency virus type 1 infection and
are characterized by a chronic interferon response as well as extensive
transcriptional changes in CD8+ T cells. J Virol. 2007;81(7):3477–86.
https://doi.org/10.1128/JVI.01552-06.
69. Brownell J, Bruckner J, Wagoner J, Thomas E, Loo YM, Gale JM, et al. Direct,
interferon-independent activation of the CXCL10 promoter by NF-κB and
interferon regulatory factor 3 during hepatitis C virus infection. J Virol.
2014;88(3):1582–90. https://doi.org/10.1128/JVI.02007-13.
70. Marshall A, Celentano A, Cirillo N, Mccullough M, Porter S. Tissue-specific
regulation of CXCL9/10/11 chemokines in keratinocytes: Implications for
oral inflammatory disease. PLoS One. 2017;12(3):e0172821. https://doi.
org/10.1371/journal.pone.0172821.
71. Cheon H, Borden EC, Stark GR. Interferons and their stimulated genes in
the tumor microenvironment. Semin Oncol. 2014;41(2):156–73. https://
doi.org/10.1053/j.seminoncol.2014.02.002.
72. Johansen T, Hansen HS, Richelsen B, Malmlöf K. The obese Gottingen
minipig as a model of the metabolic syndrome: dietary effects on
obesity, insulin sensitivity, and growth hormone profile. Comp Med.
2001;51(2):150–5.
73. Ritchie ME, Phipson B, Wu D, Hu Y, Law CW, Shi W, et al. Limma powers
differential expression analyses for RNA-sequencing and microarray studies. Nucleic Acids Res. 2015;43(7):e47. https://doi.org/10.1093/nar/gkv007.
74. Kohl M, Wiese S, Warscheid B. Cytoscape: software for visualization and
analysis of biological networks. Methods Mol Biol. 2011;696:291–303.
https://doi.org/10.1007/978-1-60761-987-1_18.
75. Ogata H, Goto S, Sato K, Fujibuchi W, Bono H, Kanehisa M. KEGG: Kyoto
Encyclopedia of Genes and Genomes. Nucleic Acids Res. 1999;27(1):29–
34. https://doi.org/10.1093/nar/27.1.29.
76 Yu G, Wang L, Han Y, He Q. ClusterProfiler: an R package for comparing biological themes among gene clusters. OMICS. 2012;16(5):284–7.
https://doi.org/10.1089/omi.2011.0118.
77. Chin CH, Chen SH, Wu HH, Ho CW, Ko M, Lin CY. CytoHubba: identifying
hub objects and sub-networks from complex interactome. BMC Syst Biol.
2014;8(Suppl 4):S11. https://doi.org/10.1186/1752-0509-8-S4-S11.
Publisher’s Note
Springer Nature remains neutral with regard to jurisdictional claims in published maps and institutional affiliations.
Ready to submit your research ? Choose BMC and benefit from:
• fast, convenient online submission
• thorough peer review by experienced researchers in your field
• rapid publication on acceptance
• support for research data, including large and complex data types
• gold Open Access which fosters wider collaboration and increased citations
• maximum visibility for your research: over 100M website views per year
At BMC, research is always in progress.
Learn more biomedcentral.com/submissions