Morphological and microsatellite DNA diversity of Djallonké sheep in GuineaBissau
Bạn đang xem bản rút gọn của tài liệu. Xem và tải ngay bản đầy đủ của tài liệu tại đây (1.97 MB, 17 trang )
Dayo et al. BMC Genomic Data
(2022) 23:3
/>
BMC Genomic Data
RESEARCH
Open Access
Morphological and microsatellite DNA
diversity of Djallonké sheep in GuineaBissau
Guiguigbaza-Kossigan Dayo1,2*, Isidore Houaga1,3†, Martin Bienvenu Somda1,4†, Awa Linguelegue1, Mamadou Ira1,
Maurice Konkobo1, Bacar Djassi5, Joao Gomes5, Mamadou Sangare1, Bernardo Cassama5 and
Chia Valentine Yapi-Gnaore1
Abstract
Background: The present study aimed at characterizing the Djallonké Sheep (DS), the only local sheep breed raised
in Guinea-Bissau. A total of 200 animals were sampled from four regions (Bafatá, Gabú, Oio and Cacheu) and
described using 7 visual criteria and 8 measurements. These parameters have been studied by principal
components analysis. The genetic diversity and population structure of 92 unrelated animals were studied using 12
microsatellite markers.
Results: The values of quantitative characters in the Bafatá region were significantly higher than those obtained in
the other three regions. A phenotypic diversity of the DS population was observed and three genetic types
distinguished: animals with “large traits” in the region of Bafatá, animals with “intermediate traits” in the regions of
Gabú and Oio and animals with “small traits” in the Cacheu region. The hair coat colors are dominated by the
white color, the shape of the facial head profile is mainly convex and the ears “erected horizontally”. Most of the
morphobiometric characteristics were significantly influenced by the “region” and “sex of animals”.
The average Polymorphism Information Content (PIC) of 0.65 ± 0.11 supports the use of markers in genetic
characterization. Gabú subpopulation had the highest genetic diversity measures (He = 0.716 ± 0.089) while Cacheu
DS subpopulation presented the smallest (He = 0.651 ± 0.157). Only Gabú and Bafatá subpopulations presented
significant heterozygote deficiency across all loci indicating possible significant inbreeding. Mean values for FIT, FST,
FIS and GST statistics across all loci were 0.09, 0.029, 0.063 and 0.043 respectively. The overall genetic differentiation
observed between the four DS subpopulations studied was low. Bafatá and Gabú are the most closely related
subpopulations (DS = 0.04, genetic identity = 0.96) while Bafatá and Cacheu were the most genetically distant
subpopulations (DS = 0.14, genetic identity = 0.87). Using Bayesian approach, the number of K groups that best fit
the data is detected between 2 and 3, which is consistent with the morphological analysis and the factorial analysis
of correspondence.
* Correspondence:
†
Isidore Houaga and Martin Bienvenu Somda contributed equally to this
work.
1
Centre International de Recherche-Développement sur l’Elevage en zone
Subhumide (CIRDES), Bobo-Dioulasso 01 BP 454, Burkina Faso
2
Institut du Sahel (INSAH/CILSS), BP 1530 Bamako, Mali
Full list of author information is available at the end of the article
© The Author(s). 2021 Open Access This article is licensed under a Creative Commons Attribution 4.0 International License,
which permits use, sharing, adaptation, distribution and reproduction in any medium or format, as long as you give
appropriate credit to the original author(s) and the source, provide a link to the Creative Commons licence, and indicate if
changes were made. The images or other third party material in this article are included in the article's Creative Commons
licence, unless indicated otherwise in a credit line to the material. If material is not included in the article's Creative Commons
licence and your intended use is not permitted by statutory regulation or exceeds the permitted use, you will need to obtain
permission directly from the copyright holder. To view a copy of this licence, visit />The Creative Commons Public Domain Dedication waiver ( applies to the
data made available in this article, unless otherwise stated in a credit line to the data.
Dayo et al. BMC Genomic Data
(2022) 23:3
Page 2 of 17
Conclusions: The molecular results on DS population of Guinea-Bissau confirmed the ones obtained with
morphological analysis. The three genetic types observed phenotypically might be due to a combination of the
agro-ecological differences and the management of breeding rather than genetic factors.
Keywords: Sheep, Morphological diversity, Population structure, Microsatellite DNA, Guinea-Bissau
Background
Livestock is an important source of income, livelihoods,
nutrition and food security, as well as resilience in subSaharan Africa [1]. In the Republic of Guinea-Bissau,
like other West African countries, the economy is dominated by the primary sector (agricultural production)
with a contribution of approximately 62% to the Gross
Domestic Product (GDP) and agriculture contributes to
creating around 95% of jobs [2]. Livestock sector represents the second economic activity after agricultural
crops and contributes to 17% of national GDP and 32%
of agricultural GDP [3]. In its various forms, livestock
occupies 72% of the rural population through multiple
functions (economic, social, reserve and savings capital,
labor power and improving soil fertility) [4].
The livestock population in Guinea-Bissau is relatively
large, very diverse and includes cattle, goats, sheep, pigs,
poultry and other animal species [5]. The farming system practiced is of extensive agro-pastoral type with certain specificities depending on the region.
Despite the socio-economic importance of livestock
sector in Guinea-Bissau, the animal genetic resources
are under-exploited and less valued. In recent years, the
contribution of the livestock sub-sector to GDP decreased to 3.5% of national GDP and 7.8% of agricultural
GDP [4]. The authors explain this decline by an absence
of effective and sustainable strategies for the management of animal genetic resources despite the great potential and assets available to the country. The
development of an efficient management strategy of domestic animal genetic resources in Guinea-Bissau requires the characterization and inventory of these
genetic resources in order to guide decision-making [6,
7].
In Guinea-Bissau, small ruminants are important in
animal husbandry and play a social and nutritional role.
Indeed, they are commonly used as a source of protein
during social and religious ceremonies (birthday celebrations, baptisms, funerals, weddings) and constitute a savings strategy [8]. They are among the most dominant
domestic animal species in the east and north of the
country. Djallonké sheep (DS) represents the main local
sheep breed of Guinea-Bissau. Despite their appreciation
(hardiness, resistance, trypanotolerance, prolificacy and
sexual precocity), information on the phenotypic characteristics is very little documented while the molecular
characterization has never been done. The goal of the
present study was to improve the knowledge on the local
sheep genetic resources of Guinea-Bissau in order to develop sustainable strategies for their development. The
specific objectives of this study were to determine the
morphobiometric characteristics and to evaluate the
genetic diversity of the local DS population in four regions in Guinea-Bissau.
Results
Morphological characterization
Quantitative characters
Basic statistics of quantitative traits in DS subpopulations in the four regions are presented in Table 1.
The values of the Chest Girth (CG), Chest Depth
(CD), Height at withers (HW), Ear Length (EL) and Tail
Length (TL) in Bafatá subpopulation were significantly
higher (KW test, P < 0.001) than those of Cacheu, Gabú
and Oio regions. In addition, the animals from the
Bafatá region had significantly higher Body Length (BL)
(ANOVA, P < 0.001) than those from other regions. The
“region” or “location” had a significant effect on the
most of the quantitative body characters of the DS in
Guinea-Bissau as presented in Table 1, excepted the following traits: “Horn Length” and “ Interval Length between the roots of the two horns”. Three genetic types
of DS were distinguished in the four regions: the type
with “large traits” for animals in the Bafatá region, the
type with “small traits” for animals in Cacheu region and
the type with “intermediate traits” for animals in the
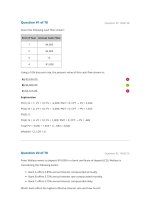
Gabú and Oio regions. The three genetic types were revealed by the Principal Components Analysis (PCA).
The Fig. 1 shows the individuals of Bafatá (black), the individuals of Cacheu (red) and a more heterogeneous
population in Gabú (green) and Oio (blue).
In the studied population, 81.5% of animals sampled
were females against 18.5% of males and all were 2 to 4
years. A sexual dimorphism was observed for some body
parameters. Female animals had higher BL, CG and CD
than their male counterparts (Table 1). Contrariwise,
male animals had higher Horn Length and Interval
Length between the roots of the two horns than the
females.
Qualitative characters by region
Values of the qualitative characters of the DS by region
are presented in Table 2. In the Gabú, Cacheu and Oio
regions, the uniform white body coat color was
Dayo et al. BMC Genomic Data
(2022) 23:3
Page 3 of 17
Table 1 Descriptive statistics of the morphological traits of the four Djallonké Sheep subpopulations studied
Characters
Chest Girth (cm)
Chest Depth (cm)
Height at withers
(cm)
Body Length (cm)
Ear Length (cm)
Tail Length (cm)
Horn Length (cm)
Interval Length between the roots of the two
horns (cm)
Bafatá
Cacheu
Gabú
Oio
est (Pvalue)
All
subpopulations
min- max
60–82
56–89
56–93
59–80
56–93
Means ±
SD
72.80 ±
4.68a
67.40 ±
6.14b
67.22 ±
6.58b
69.35 ±
4.83b
KW
S
(P < 0.001)
min- max
32–43
29–39
27–45
23–51
23–51
Means ±
SD
38.05 ±
2.41a
33.84 ±
2.34b
33.97 ±
3.67b
35.15 ±
4.42b
KW
S
(P < 0.001)
min- max
48.4–74.4
46.4–58.4
46.4–62.4
46.4–62.4
Means ±
SD
55.65 ±
4.16a
53.4
±2.85b
53.23 ±
3.77b
54.67 ±
3.44ab
min- max
49–70
45–63
50–72
52–64
Means ±
SD
60.75 ±
4.51a
53.16 ±
4.13b
57.50 ±
4.41c
57.80 ±
2.88c
min- max
8–13
7–9
8–13
9–13
Means ±
SD
10.23 ±
0.95a
8.16 ±
0.62b
10.15 ± 1.02
ac
9.73 ± 0.78c
min- max
25–45
19–29
19–33
20–31
Means ±
SD
32.00 ±
3.29a
23.88 ±
2.89b
26.73 ±
2.79c
25.28 ±
2.77bc
min -max
6–19
15–23
9–26
2–22
Means ±
SD
13.81 ±
3.85
18.33 ±
4.16
14.07 ± 5.11 10.89 ± 6.9
min- max
7–13
4–6
5–10
4–8
Means ±
SD
10.47 ±
3.56
4.67 ± 1.15
7.33 ± 1.45
6.22 ± 1.48
69.76 ± 6.02
35.72 ± 3.76
KW
46.4–74.4
S (P < 0.01)
54.46 ± 3.89
ANOVA
S
(P < 0.001)
45–72
58.23 ± 4.78
KW
S (p <
0.001)
7–13
KW
(P < 0.001)
19–45
KW
(NS)
KW (NS)
9.85 ± 1.12
28.06 ± 4.36
2–26
13.60 ± 5.21
4–13
8.24 ± 2.52
SD Standard Deviation, min Minimum, max Maximum, S Significant, NS Non significant, KW Kruskal-Wallis test, ANOVA Analysis of variance
predominant with 81.67, 76.00 and 50.00% respectively. In Bafatá, the eumelanin-black color with tan
belly (49.33%) and the uniform white (37.33%) and
then the pheomelanin-brown and tan belly (13.33%)
were mainly found. The uniform red/fawn was not
observed in this study. The type of melanin observed
had a significant link with the region (Chi2-test,
P < 0.001). For the coat color patterns, the uniform
white pattern characterized the DS in Gabú, Cacheu
and Oio regions, while in Bafatá region the patchy
(white-black or white-red/fawn) and the spotted
(white color with some black or red/fawn spots without regular distribution) patterns were mostly observed in the proportions of 37.33 and 33.33%,
respectively. The patchy pattern with badger face,
plain black/brown, black/brown and tan white belly
patterns were observed in the Bafatá and Oio regions.
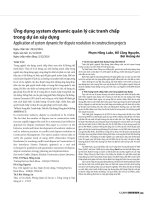
Figure 2 illustrates the coat color patterns of black/
brown and tan, spotted pattern, patchy (white-black/
white-fawn) and uniform white color.
In Cacheu, Gabú and Oio regions, all the animals carried horizontally erected ears, while 2.67% of the animals
in Bafatá region had semi-pendulous ears. The facial
(chamfer) profile of animals was predominantly convex.
The straight shape was also observed in Bafatá (10.67%),
Cacheu (4.00%) and Oio (17.50%).
The different horn shapes and orientations observed in
the DS are presented in Table 3. No significant difference was observed between the regions (P = 0.056).
The sexual dimorphism was observed for the horn
presence and the chamfer profile (Table 3). Indeed, all
males were horned against only 6.75% of horned females
among which 45.45% were in the form of stumps.
Molecular genetic diversity
The number of alleles (Na), the allelic richness (AR), the
expected (He) and observed (Ho) heterozygosities per
locus and per DS subpopulation (region) are presented
in Table 4. The 12 microsatellite loci used were polymorphic and a total of 89 alleles were detected. The allelic diversity was characterized by the number of alleles
ranging from 3 (MAF214) to 10 (MAF10), with an average of 7.42 ± 2.19. The allelic richness estimated using
rarefaction method ranged from 2.57 (SRCRSP1) to 4.49
(ILSTS5), with an average of 3.59 ± 0.67. Subpopulations
from Bafatá and Gabú had higher genetic diversity with
He values of 0.716 ± 0.089 and 0.697 ± 0.094, respectively
compared to those from Oio (0.655 ± 0.143) and Cacheu
Dayo et al. BMC Genomic Data
(2022) 23:3
Page 4 of 17
Fig. 1 Principal components analysis to study the population structure
(0.651 ± 0.157) regions. Cacheu Djallonké subpopulation
presented the smallest diversity index. In Bafatá, Gabú
and Cacheu regions, the average observed heterozygosities were lower than the expected heterozygosities
under Hardy-Weinberg Equilibrium (HWE).
Table 4 Number of alleles (Na), allelic richness (AR),
expected (He) and observed (Ho) heterozygosities per
loci in the four subpopulations of Djallonké sheep.
The effective Ae, the Polymorphic Information Content
(PIC) and the F-Statistics (FIT, FST, FIS) according to Weir
and Cockerham (1984) for all the microsatellite markers
analyzed over the four DS subpopulations are presented in
Table 5. The effective Ae varied from 2 (SRCRSP1) to 5.24
(ILSTS5) with an average of 3.52 ± 1.04. SRCRSP1 locus
was the lowest informative with a PIC of 0.45 while ILST
S5 locus presented the highest value of PIC (0.78) and the
average value was 0.65 ± 0.11.
The mean values of FIT, FST, FIS were 0.09, 0.029 and
0.063, respectively. Values of GST ranged from 0.015 for
MAF65 to 0.152 for OarJMP58, with a mean of 0.043
showing that the gene variation among subpopulations
is still low. The FST value (0.029) showed that most of
the total genetic variation corresponds to differences
among individuals within subpopulation (97.10%) and
only
2.90%
result
from
differences
among
subpopulations.
The overall estimate of FIS was 0.063 ± 0.029. The
subpopulation-wise FIS estimates were significantly
(P < 0.01) greater than zero in Bafatá and Gabú subpopulations, suggesting a deviation from HWE (Table 6).
The exact tests also showed a significant deviation from
HWE for some markers in the different subpopulations.
The overall differentiation level of the subpopulations
was very low (FST = 0.029 ± 0.016). Among the four subpopulations, the lowest genetic distance was observed
between Bafatá and Gabú subpopulations (0.0406) and
the highest between Bafatá and Cacheu subpopulations
(0.1412). The genetic distances and the genetic identity
according to Nei (1978) are summarized in Table 7.
From the unrooted neighbor-joining tree constructed
using the genetic distances (Fig. 3), the subpopulation
from Cacheu region relatively differed from the three
other subpopulations.
Genetic structure of subpopulations by factorial
correspondence analysis
The factorial correspondence analysis (Fig. 4) clustered
the studied population in three groups: group 1 with
Dayo et al. BMC Genomic Data
(2022) 23:3
Page 5 of 17
Table 2 Distribution of the qualitative traits of Djallonké Sheep
Qualitative traits
Bafatá
Cacheu
Gabú
Oio
Coat color patterns (%)
Patchy (white-black/white-fawn)
13.33
4.00
3.33
20.00
Patchy with badger face
9.33
4.00
1.67
0.00
Uniform white
37.33
76.00
81.67
50.00
Uniform black/brown
1.33
0.00
0.00
5.00
Black/brown with tan belly
5.33
0.00
0.00
2.50
Spotted of white and black / red/fawn
33.33
16.00
13.33
22.50
Absence of pigment (Uniform white)
37.33
76.00
81.67
50.00
Pheomelanin
13.33
8.00
3.33
7.50
Eumelanin
49.33
16.00
15.00
42.50
Presence
28
12
25
22.5
Absence
72
88
75
77.5
42.86
33.33
80.00
55.56
Chi2-test
S (P < 0.001)
Types of melanin pigments (%)
S (P < 0.001)
Horn presence (%)
NS (P > 0.05)
Horn shape and orientation (%)
Lateral and straight horns
Prismatic or corkscrew
0.00
0.00
0.00
11.11
Backward spiral horns
23.81
0.00
6.67
0.00
Spiral horns facing forward
9.52
66.67
13.33
33.33
Stumps
23.81
0.00
0.00
0.00
Erect horizontally
97.33
100.00
100.00
100.00
Semi-pendulous
2.67
0.00
0.00
0.00
Convex
89.33
96
100
82.5
Straight
10.67
4
0
17.5
P = 0.056
Ear orientation (%)
NS (P > 0.05)
Facial (chamfer) profile (%)
S (P < 0.01)
S Significant, NS Non significant
Bafatá and Gabú subpopulations, group 2 with predominantly Oio subpopulation and group 3 with the Cacheu
subpopulation. Although the FST-pairwise values were
very low, the FCA allowed to represent the different subpopulations. The factorial axis 1 (43.93%) separates
Bafatá and Gabú subpopulations from those of Oio and
Cacheu while the factorial axis 2 (36.81%) isolated Oio
subpopulation from Cacheu subpopulation.
Using Bayesian approach implemented in Structure
Software and Evanno method [9], the number of K
groups that best fit the data is detected between 2 and 3
(Fig. 5).
Assuming K = 2, Cacheu and Oio clustered in the group
1 with 54.8 and 56.1% respectively while Bafatá and Gabù
clustered in group 2 with 52.9 and 52.8% respectively. At
K = 3, Bafatá and Gabù subpopulations with 47.5 and
49.8% respectively remained in the cluster 1, Cacheu
(50.9%) and Oio (50.6%) in the Cluster 2 and the four subpopulations were in the cluster 3 with 13.8% for Bafatá,
6.4% for Cacheu, 6.5% for Gabù and 6.4% for Oio (Fig. 6).
Discussion
Morphological diversity
Quantitative characters
DS in Guinea-Bissau can be classified into three “genetic
types” associated to three the “large animals” in the
Bafatá region, “intermediate traits” for sheep in the Gabù
and Oio regions and “small animals” in the Cacheu region. Indeed, the average values of the quantitative characters (CG, CD, HW, BL, EL and TL) of the Bafatá DS
subpopulation were significantly higher than those obtained in the Gabú, Oio and Cacheu regions. This gradient in the size of the morphological traits could be
explained by the differences in the agro-ecological conditions, the farming practices and genetic background.
In fact, the agro-ecological area of the North-East, which
includes the Bafatá, Gabú and Oio regions, is characterized by savannah trees and clear forests, which offer rich
natural pastures to pastoralists who are Fulani and
Mandingos. Moreover, the livestock is dominated by
ruminant species. Contrariwise, in the North-West
Dayo et al. BMC Genomic Data
(2022) 23:3
Page 6 of 17
Fig. 2 a Uniform black with tan belly; b Spotted/pied; c Patchy white-black with badger face; d Uniform white (PROGEVAL, 2017)
agro-ecological zone including the Cacheu region, ruminant species (sheep, goat and cattle) are mainly
raised for ritual ceremonies by breeders who are rather animistic [10]. In addition, this zone is covered
with wooded savannahs and dense forests hardly accessible by animals, hence the predominance of the
sedentary system in the Cacheu region. At the cultural level, Bafatá region is mainly populated by Fulaspeaking people, practicing the Muslim religion and
traditionally attached to animal husbandry compared
to the other regions (Cacheu and Oio) where the
populations are strongly Christianized and more
attached to pig farming. The Bafatá region is also a
large area of ruminant species concentration during
the transhumance period and hosts the most important livestock market in the country. This region generally receives animals from Gabú and both Gabú and
Bafatá regions have more than 70% of the country’s
ruminant livestock [4]. During the dry season (November to May), ruminants from the Gabú region migrate to the Bafatá and Oio regions [11].
Sheep from the Cacheu region had the smallest size in
the study area. In fact, Cacheu is one of the regions of
the North-West agro-ecological zone with high humidity
Table 3 Effects of sex on significant morphological characters
Chi2-test
Characters
Attributes
Females
Males
Facial (chamfer) profile (%)
Convex
90.18
100
Straight
9.82
0
Horn presence (%)
Presence
6.75
100
Absence
93.25
0
S (P < 0.001)
Horn shape and orientation (%)
Lateral and straight horns
45.45
59.46
NS
Prismatic or corkscrew
0
2.70
NS
Backward spiral horns
9.09
13.51
NS
Spiral horns facing forward
0
24.32
NS
Stumps
45.45
0
S (P < 0.001)
S Significant, NS Not significant
S (P < 0.01)
Dayo et al. BMC Genomic Data
(2022) 23:3
Page 7 of 17
Table 4 Number of alleles (Na), allelic richness (AR), expected (He) and observed (Ho) heterozygosities per loci in the four
subpopulations of Djallonké sheep
Loci
ILSTS5
OarCB226
OarFCB193
OarFCB304
ILSTS11
MCM140
OarJMP58
SRCRSP1
MAF214
MAF65
MAF70
Bafatá
Cacheu
Gabú
Oio
All populations
Na
6
5
8
6
8
AR
4.18
4.15
4.85
4.16
4.49
He
0.794
0.804
0.845
0.788
Ho
0.692
0.714
0.895
0.938
Na
7
5
6
6
8
AR
3.23
3.52
3.39
3.24
3.37
He
0.591
0.706
0.643
0.598
Ho
0.591
0.800
0.556
0.625
Na
7
5
7
6
9
AR
4.11
3.49
4.05
4.22
4.03
He
0.774
0.701
0.760
0.791
Ho
0.500
0.800
0.800
0.652
Na
7
5
6
6
9
AR
4.04
3.43
3.97
2.46
3.68
He
0.780
0.664
0.777
0.369
Ho
0.654
0.333
0.704
0.333
Na
3
3
4
5
6
AR
2.40
2.69
2.83
2.76
2.76
He
0.574
0.549
0.627
0.590
Ho
0.200
0.533
0.316
0.458
Na
7
6
7
6
9
AR
4.49
4.25
4.40
3.80
4.29
He
0.817
0.802
0.809
0.715
Ho
0.842
0.933
0.815
0.708
Na
4
4
3
5
8
AR
4.00
2.70
3.00
3.20
3.49
He
0.750
0.487
0.733
0.693
Ho
0.750
0.467
0.400
0.783
Na
4
3
3
3
4
AR
2.76
2.09
2.62
2.63
2.57
He
0.535
0.301
0.553
0.531
Ho
0.300
0.200
0.630
0.583
Na
3
3
3
3
3
AR
2.82
2.65
2.79
2.52
2.70
He
0.634
0.545
0.614
0.479
Ho
0.500
0.667
0.482
0.609
Na
5
4
4
4
6
AR
3.27
3.26
3.16
3.26
3.25
He
0.690
0.692
0.698
0.699
Ho
0.808
0.667
0.667
0.652
Na
8
7
10
8
10
AR
3.51
4.98
4.25
4.43
4.35
He
0.696
0.860
0.750
0.788
Dayo et al. BMC Genomic Data
(2022) 23:3
Page 8 of 17
Table 4 Number of alleles (Na), allelic richness (AR), expected (He) and observed (Ho) heterozygosities per loci in the four
subpopulations of Djallonké sheep (Continued)
Loci
OarCP34
Bafatá
Cacheu
Gabú
Oio
All populations
Ho
0.560
0.800
0.769
0.652
Na
7
4
5
7
9
AR
4.01
3.41
4.04
4.49
4.10
He
0.736
0.699
0.783
0.824
Ho
0.600
0.733
0.692
0.913
Mean ± SD
Na
5.67 ± 1.78
4.50 ± 1.24
5.50 ± 2.24
5.42 ± 1.51
7.42 ± 2.19
Mean ± SD
AR
3.57 ± 0.67
3.39 ± 0.80
3.61 ± 0.73
3.43 ± 0.76
3.59 ± 0.67
Mean ± SD
He
0.697 ± 0.094
0.651 ± 0.157
0.716 ± 0.089
0.655 ± 0.143
0.680 ± 0.032
Mean ± SD
Ho
0.583 ± 0.192
0.637 ± 0.215
0.644 ± 0.176
0.659 ± 0.169
0.631 ± 0.033
SD Standard Deviation
favorable to parasitism and vectors of pathogens such as
tsetse flies which transmit the trypanosomes causing African animal trypanosomosis.
DS subpopulations of the Gabú and Oio regions were
highly heterogeneous with an “intermediate genetic
type”, probably due to the introduction of improving
rams in these regions in the past [12]. This heterogeneity
is observed not only between regions but also within region (Fig. 1). The effect of the agro-ecological zone on
the morphological types of ruminants, especially sheep,
has been previously reported in Côte d’Ivoire in DS [13],
in Senegal with Peul-peul (Fulani) sheep [14] and in
Togo in Vogan Sheep and DS [15]. A recent morphobiometric characterization of DS in the sudano-guinean
zone of Cameroon revealed three genetic types [16] as
observed in the present study in Guinea-Bissau. In Burkina Faso, Traoré et al. [17] described a sheep
population named “Mossi sheep” which is a savannah
DS found in an agro-ecological zone between the
sudano-sahelian zone and the sudano-guinean zone with
an “intermediate type” between DS and sahelian sheep.
The average values of HW obtained (55.67 ± 4.16 cm
for the Bafatá region, 54.67 ± 3.44 cm for the Oio region,
53.44 ± 2.85 cm for the Cacheu region and 53.23 ± 3.77
cm for Gabú region) are closed to those reported by
Dayo et al. [15] in DS in Togo (HW = 54.63 ± 8.23 cm;
BL = 58.47 ± 6.30 cm and CG = 74.72 ± 8.28 cm) and Sangaré [18] in DS in West Africa and Gueye [19] in
Senegal. Similar results have also been reported in other
populations of DS in Ghana (HW = 57.06 ± 0.28 cm;
BL = 54.87 ± 0.35 cm and CG = 69.19 ± 0.41 cm) by Birteeb et al. [20] and Asamoah-Boaheng and Sam [21] and
in Côte d’Ivoire (HW = 59.60 ± 5.40 cm; BL = 57.80 ±
5.40 cm and CG = 70.80 ± 6.50 cm) by N’Goran et al.
Table 5 Effective number of alleles (Ae), Polymorphism Information Content (PIC) and the F-Statistics (FIT, FST, FIS) according to Weir
and Cockerham (1984) for 12 microsatellite markers analyzed in four Djallonké sheep subpopulations
Loci
Ae
PIC
FIT
FST
FIS
ST
ILSTS5
5.24
0.7823
−0.006
0.009
−0.015
0.031
OarCB226
2.66
0.5888
0.005
−0.000
0.005
0.019
OarFCB193
4.11
0.72
0.086
−0.001
0.087*
0.021
OarFCB304
3.33
0.6622
0.262
0.091
0.188*
0.085
ILSTS11
2.44
0.5142
0.335
0.003
0.333**
0.036
MCM140
4.69
0.758
−0.022
0.016
−0.038
0.029
OarJMP58
3.46
0.6581
0.165
0.169
−0.005
0.152
SRCRSP1
2.00
0.4491
0.075
0.006
0.070
0.028
MAF214
2.34
0.5098
0.047
0.003
0.045
0.020
MAF65
3.22
0.6301
−0.015
− 0.002
− 0.012
0.015
MAF70
4.38
0.7441
0.122
0.020
0.104*
0.036
OarCP34
4.37
0.7384
0.062
0.015
0.048
0.031
Means ± SD
3.52 ± 1.04
0.65 ± 0.11
0.090 ± 0.031
0.029 ± 0.016
0.063 ± 0.029
0.043
SD Standard Deviation
Dayo et al. BMC Genomic Data
(2022) 23:3
Page 9 of 17
Table 6 FIS values in the four Djallonké Sheep subpopulations
Loci
Bafatá
Cacheu
Gabú
Oio
ILSTS5
0.133
0.116
−0.061
− 0.197
OarCB226
0.000
−0.139
0.138
−0.047
OarFCB193
0.362*
−0.147
−0.054
0.179**
OarFCB304
0.164
0.507*
0.096
0.098
ILSTS11
0.664*
0.030
0.503**
0.226
MCM140
−0.032
−0.170
−0.007
0.009
OarJMP58
0.000
0.044
0.484
−0.133
SRCRSP1
0.445**
0.344
−0.142
−0.101
MAF214
0.215*
−0.233
0.219
−0.278
MAF65
−0.174
0.038
0.046
0.068
MAF70
0.199
0.072
−0.027
0.176*
OarCP34
0.187
−0.051
0.118
−0.111
All loci
0.169***
0.022
0.107**
−0.006
*P < 0.05, ** P < 0.01, ***P < 0.001
[13]. However, the values of the present study were
higher than those previously reported by Hadzi [22] in
DS in Togo and in Guinea-Bissau [8]. These results
could be explained by the differences of climatic conditions of the agro-ecological zones in which these studied
populations are bred, the study periods of the year (season effect), the farming systems or the genetic variability
that could be observed between DS populations across
the countries. It has been reported the existence of two
sub-categories of DS [23, 24] and DS of savannah are
larger than those of forest zones [25], demonstrating
once more the effect of the agro-ecological zone on the
morphological type of this sheep breed.
The tail of the DS is thin and relatively long. The average TL (28.06 ± 4.36 cm) is similar to those reported by
N’Goran et al. [13] in DS in Côte d’Ivoire (24.70 ± 3.40
cm) and in Togo (27.47 ± 8.05 cm) [15]. This TL is longer than those reported in the DS (West African Dwarf)
by Gbangboche et al. [25] in Benin (17 cm), in Nigeria
(19.42 ± 0.63 cm) [26] but shorter than those of the Sahelian sheep (48.20 ± 5.37 cm) and Vogan sheep from
Togo (45.24 ± 6.23 cm) [15].
Concerning the ear length, the value obtained (9.85 ±
1.12 cm) is similar to value reported by Gbangboche
et al. [25] in West-Africa, who found that DS has small
ears, about 10 cm. However, the value in the present
Table 7 Genetic distance (below the diagonal) and genetic
identity (above the diagonal) according to Nei (1978)
Bafatá
Cacheu
Gabú
Oio
Bafatá
–
0.8683
0.9603
0.9107
Cacheu
0.1412
–
0.9097
0.8940
Gabú
0.0406
0.0946
–
0.9440
Oio
0.0936
0.1121
0.0576
–
study is lower than those reported in DS in West Africa:
13.03 ± 0.39 cm in Nigeria [26], 11.61 ± 2.61 cm in Togo
[15]) and in the Peul-peul (Fulani) sheep (13.30 ± 1.20
cm) in Senegal [14]; and significantly shorter than those
recorded in Vogan sheep (18.45 ± 2.08 cm) and Sahelian
sheep (21.63 ± 2.48 cm) [15]. No sexual dimorphism was
observed for this trait contrary to Gueye [19] who
showed that male sheep and goats had slightly longer
ears than females in Senegal.
Qualitative characters
The coat color pattern in DS in Guinea-Bissau is dominated by the uniform white pattern and the spotted
white and brown / fawn pattern in all regions. In the
Bafatá region, the frequency of the spotted pattern is
higher than in the other three regions. Indeed, for the
Muslim populations in Bafatá and Gabú regions, the
rams are preferentially slaughtered while the uniform
white or spotted ewes are kept for the reproduction in
order to have the offspring with white coat color. This
explained the presence of only few rams in most of
herds. The higher proportion of animals with uniform
white color pattern could also be due to a strong selection of animals expressing the white coat color to meet
the livestock market demands (higher price than other
coat colors) and the cultural preference in the country
(religious sacrifices or gifts during baptism celebrations
and the “Eid El-Kebir” (Tabaski) celebration or for the
dowry). The preferences for the coat color of animals
differ from one society to another. For example, in
southern Ethiopia, red coat color for ewes is the most
suitable for market demands [27]. In Côte d’Ivoire, the
DS had at 55.00% patchy white-black coat color compared to 24.00% uniform white coat [13], and only 5.88%
of the DS were white in southern Togo [15]. This diversity for coat color in DS in West Africa is linked to the
choices made by the societies in which these animals are
raised. In Ferlo zone in Senegal, the dominant coat color
of the Peul-peul sheep has evolved from patchy (whiteblack or white-red/fawn) [19] to spotted of white and
black / red/fawn [28].
The ears of DS in Guinea-Bissau are mostly erected
horizontally and only 2.67% of animals in the Bafatá region had slightly drooping ears. These results agree with
those of Dayo et al. [15] in DS from Togo (86.27%) and
N’Goran et al. [13] in Côte d’Ivoire (87.00%). Drooping
ears in DS are considered to be the result of Sahelian
sheep genes introgression [13, 15]. Thus, the presence of
animals with slightly drooping ears in the Bafatá region
(2.67%) could be explained by crosses occurred with Sahelian sheep from neighboring countries, especially from
Senegal.
Sexual dimorphism has been observed for the presence
of horns with only 6.75% females horned in our study.
Dayo et al. BMC Genomic Data
(2022) 23:3
This proportion is higher than the 2.30% often reported
for ewes wearing horns (most are stumps); but lower
than the 14.60% of Mossi ewes carrying horns in Burkina
Faso [17]. The horns are developed for rams and absent
or in stumps in ewes. In the current study, the most of
horned ewes were from the regions of Bafatá and Oio
where small ruminants and cattle move during the
transhumance in the dry season [11]. Horned ewes are
thought to have come from crossing with transhumant
animals. It is important to highlight that in half of these
ewes, the horns are in stumps.
The horn shapes were significantly different according
to the zone: horns laterally straight were the most observed in Bafatá, Gabú and Oio regions while spiral
horns facing forward predominated in the forest and
humid Cacheu region similarly to the one reported by
Dayo et al. [15] in the south of Togo.
Molecular genetic diversity
The current study provides the first information on molecular genetic characterization of DS in Guinea-Bissau
and is complementary to the morphological
characterization of this breed. This study presents a
comprehensive genetic analysis of DS, the assumed only
sheep breed of Guinea-Bissau, from four administrative
regions covering two agro-ecological zones. The genetic
diversity of subpopulations was influenced by the sociocultural practices and agro-ecological zones. Similar observations were reported by prior studies in West African DS [29]. Indeed, these authors had reported that
Malian, Gambian and eastern Guinean DS populations
had higher genetic diversity than those from Senegal and
southern and western Guinean using expected heterozygosity (He) and the mean number of alleles (Na). Based
on the He, Cacheu and Oio DS subpopulations would be
closer to Senegalese, Gambian southern and western
Guinean populations while Bafatá and Gabú DS presented similar expected heterozygosities to Malian and
eastern Guinean DS. The Na in the current study
Page 10 of 17
(7.42 ± 2.19) was similar to those obtained by Wafula
et al. [29] in Guinean and Malian DS and Agaviezor
et al. [26] in West African Dwarf sheep in Nigeria. However, the allelic richness (adjusted mean number of alleles) values were lower than those reported by Wafula
et al. [29] and Agaviezor et al. [26] and probably due to
the small sample size used for genotyping in our study.
Genetic structure of the population
Using different population differentiation parameters
(FST, GST, genetic distance, genetic identity) and representation (NJ Tree and FCA), our results showed that
the population differentiation over the 4 subpopulations
is very low since the multi-locus FST and GST values indicated that only 2.9 and 4.3% respectively of the total
genetic variation were due to the subpopulation differences. The remaining 97.1 for FST and 95.7 for GST corresponded to differences between individuals within the
subpopulations. These values were lower than those
(8.8% for FST and 12% for GST) reported by Agaviezor
et al. [26] in four sheep populations in Nigeria (Udah,
Balami, Yankasa and West African Dwarf sheep also
known as DS). Even though the genetic differentiation
observed between the four DS subpopulations in
Guinea-Bissau was low, the current study pointed that
the subpopulation from Cacheu region slightly differs
from those in Gabú, Bafatá et Oio regions. Indeed, these
three subpopulations are genetically close even though
they come from geographically different locations. This
similarity is shown by: i) the high genetic identity (from
0.9603 to 0.9017) of the three subpopulations while this
value decreased to 0.8683 between Bafatá and Cacheu
subpopulations, ii) the low genetic distances between the
three subpopulations. The closest Nei’s [30] unbiased
measures between Bafatá and Gabú, and the farthest between Bafatá and Cacheu may be due not only to their
geographical locations but also to the breeding systems,
the presence of the livestock market in Bafatá and the
cultural behavior of the breeders in the different regions.
Fig. 3 Unrooted neighbor-joining tree depicting the relationship of four subpopulations of Djallonké Sheep of Guinea-Bissau using Nei’s (1978)
genetic distances
Dayo et al. BMC Genomic Data
(2022) 23:3
Page 11 of 17
Fig. 4 Factorial correspondence analysis. Yellow: Bafatá; Blue: Cacheu; White: Gabu; Grey: Oio. Axis 1 isolated Gabú – Bafatá and Oio from Cacheu
while Axis 2 delimited Oio and Cacheu
Fig. 5 Plots for detecting the number of K groups that best fit the data (Assumption: No Admixture Model and Independent Alleles frequencies)
Dayo et al. BMC Genomic Data
(2022) 23:3
Page 12 of 17
Fig. 6 Population structure assessed by Structure software. Each individual is represented by a vertical bar, often partitioned into colored
segments with the length of each segment representing the proportion of the individual’s genome from K = 2 to 3 ancestral populations
(Animals for which more than 2 loci were not amplified were removed from this analysis)
Ira et al. [5] reported that Bafatá, Gabú and Oio regions
had 95.88% of the sheep population of Guinea-Bissau
and breeders practice transhumance breeding system,
mixing cattle and sheep while in Cacheu region the
breeding system is rather sedentary in association with
agriculture (production of mangrove rice, sorghum, millet, beans, peanuts and cashew). The Bayesian approach
implemented in STRUCTURE program detected the
number of K that best fit the data between 2 and 3, suggesting an introgression of the Djallonké sheep of
Guinea Bissau by an exotic sheep or the existence of
“ecotypes”. The two subpopulations from the eastern regions (Gabù and Bafatà) were separated from the western subpopulations (Cacheu and Oio) at K = 2. The
heterogeneity of the DS in Guinea-Bissau is shown with
K = 3. The molecular study on DS population of GuineaBissau confirmed the results obtained from phenotypic
study.
Further investigations extended to other regions of
Guinea-Bissau and other sheep breeds are required to
determine the origin of the admixture and the existence
of ecotypes of Djallonké sheep in this country.
Conclusions
In this primary phenotypic characterization of the DS
in Guinea-Bissau, three genetic types of animals were
distinguished, namely the largest animals in Bafatá,
the smallest animals in Cacheu and the type with
intermediate traits of animals in Gabú and Ohio. The
values of the quantitative characters of the sheep of
the region of Bafatá were significantly higher than
those of the other regions. The molecular study confirmed the existence of three genetic groups in the
DS population in Guinea-Bissau that could be related
more to breeding system than a genetic differentiation
which was very low. The current study provides sufficient data that could be used to develop strategies for
the sustainable and efficient management of animal
genetic resources in general and specifically of sheep
genetic resources in Guinea-Bissau. To complete the
morphological and molecular characterization reported in the current study, it would be necessary to
collect and analyze the demographic parameters and
the zootechnical data of the DS population in
Guinea-Bissau.
Dayo et al. BMC Genomic Data
(2022) 23:3
Methods
Study area and population
The study was conducted in four administrative regions
which are the largest agro-pastoral areas in GuineaBissau: Bafatá, Gabú, Cacheu and Oio. These four regions cover two agro-ecological zones [31]:
- the North-East area comprising the regions of Gabú,
Bafatá and Oio: characterized by a Sudanese climate
with two distinct seasons: a dry season between November and May, and a rainy season from June to October.
The annual rainfall ranges from 1200 to 1500 mm over
an average of 107 days. The rate of evapotranspiration is
2507 mm and the annual average temperature is 27.4 °C.
Most of the soil is tropical iron and iron. However, hydromorphic soils derived from marine alluvium are
found in the shallows, basins of rivers and rivers. The
vegetation consists of wooded savannahs and clear forests dotted with grasses that provide excellent natural
grazing for animals. Livestock is dominated by ruminants and associated with the cultivation of maize, plains
rice, sorghum, millet, cotton, groundnuts and cashew
nuts. DS is the only sheep breed used in these regions.
Animal breeding is practiced by ethnic Peulh populations and Mandingoes with Muslim religious dominance
(5);
- the North-West area comprising the regions of
Cacheu, Bissau and Biombo: moderately wet and warm
Guinean maritime climate with 1500 1877 mm of average rainfall over 112 days. The average annual
temperature is 26.6 °C and the evapotranspiration is 137
mm [31]. This area offers good opportunities for diversified agricultural production. The soils are sandy-clay and
hydromorphic. The vegetation is made up of wooded savannahs and dense forests. Livestock is dominated by
pigs and poultry. The reduced size herds of ruminants
are also met. Ruminants and poultry are much more
used for traditional rituals than for sale at the market.
This system is practiced by animist populations such as
Pepels, Balantes, Manjaques, Diolas, Mancanhes and
Bijagós. The husbandry is associated with the cultivation
of low-lying rice, sorghum, millet, groundnuts, sweet potatoes, cassava and cashew nuts.
Animals belonging to Djallonké Sheep breed, both
adult males and females were included in the study. Data
collection was carried out between April and October
2017.
Morphobiometric data (qualitative and quantitative
traits) were collected through single visits (primary
characterization) in the different herds. A total of 200
animals were chosen in the four administrative regions: 75 animals in the Bafatá region, 25 in the
Cacheu region, 60 in the Gabú region and 40 in the
Oio region. The herds were chosen after sensitization
of the breeders and their agreement. In each herd,
Page 13 of 17
the least related adult animals were chosen. Locations
of the animal sampling have been included in Supplementary Fig. S1.
Description of animal morphological characters and body
measurements
Body measurements (quantitative variables) concerned:
(i) the Height at the Withers (HW), the Chest Depth
(CD) and the Body Length (BL) using a sliding ruler; (ii)
the Chest Girth (CG), Ear Length (EL), the Horn Length
(HL), the Interval Length between the roots of the two
Horns in males (ILH) measured between the roots of the
two horns and the Tail Length (TL) were determined
using a measurement tape. Body parameters measurements were taken early in the morning to avoid changing the animal’s conformation after consuming water
and food.
The morphological characteristics (qualitative variables) related to the sex of the animal (male / female), the type of melanin (eumelanin, phaeomelanin,
absence of pigment), the coat color pattern, the coat
color, the ear orientation, the facial (chamfer) profile,
the presence or absence of horns and the shape of
the horns were described using visual criteria by simple observation of the interviewers following the elements of the guidelines developed for the study using
the guidelines of the Food and Agriculture
Organization for the phenotypic characterization of
Animal Genetic Resources [7].
DNA extraction, polymerase chain reaction and fragment
analysis
Blood samples were collected on 92 unrelated animals: 26 animals in the Bafatá region, 15 in the
Cacheu region, 27 in the Gabú region and 24 in the
Oio region. Farmers were interviewed in detail to ensure unrelatedness among the sampled individuals.
About 5 ml of whole blood samples were collected
after jugular venipuncture in EDTA coated vacutainer
tubes. Genomic DNA was extracted using Commercial PROMEGA Wizard purification kit. A total of 12
microsatellite markers chosen among those recommended by the FAO-ISAG consortium [32] were used
to genotype all the individuals (Table 8). The forward
primer for each locus was labelled with one of the
four fluorescent dyes FAM, VIC, NED and PET (Applied Biosystems, USA). Multiplexed polymerase chain
reaction was performed with a total reaction volume
of 12 μl containing 5 μl of mix primers of multiplex,
5 μl of mix of other reagents (Buffer, MgCl2, Taq
polymerase) and 2 μl of DNA. The following thermal
conditions, 94 °C for 15 min, followed by 40 cycles of
94 °C for 30 s, specific annealing temperature (58 °C
and 60 °C according to the multiplex) for 1 min 45 s
Dayo et al. BMC Genomic Data
(2022) 23:3
Page 14 of 17
Table 8 Characteristics of the sheep microsatellite markers
Microsatellite Primers Sequences of primers
Nucleotide
pattern
Number of
chromosome
Hybridization
temperature (°C)
Multiplex Theoretical
size
OarJMP58
Di
OAR 26
58
1
145–169
Di
OAR 16
58
2
174–282
Di
OAR 7
55
3
174–218
Di
OAR15
60
2
123–127
Di
OAR 11
54
3
174–218
Forward CCCTAGGAGCTTTCAATAAAGA Di
ATCGG
OAR 19
56
3
150–188
Di
OAR 9
55
1
256–294
Di
OAR 6
60
1
167–193
Di
OAR 13
54
1
116–148
Di
OAR 3
50
4
112–130
Di
OAR 2
60
3
119–153
Di
OAR 4
60
4
124–166
Forward GAAGTCATTGAGGGGTCG
CTAACC
Reverse CTTCATGTTCACAGGACTTTCT
CTG
MAF214
Forward GGGTGATCTTAGGGAGGTTT
TTGGAGG
Reverse AATGCAGGAGATCTGAGG
CAGGGACG
ILSTS5
Forward GGAAGCAATGAAATCTATAG
CC
MAF65
Forward AAAGGCCAGAGTATGCAA
TTAGGAG
Reverse TGTTCTGTGAGTTTGTAAGC
Reverse CCACTCCTCCTGAGAATATAAC
ATG
OarFCB193
Forward TTCATCTCAGACTGGGATTCAG
AAAGGC
Reverse GCTTGGAAATAACCCTCCTGCA
TCCC
OarFCB304
Reverse CGCTGCTGTCAACTGGGT
CAGGG
ILSTS11
Forward GCTTGCTACATGGAAAGTGC
Reverse CTAAAATGCAGAGCCCTACC
MCM140
Forward GTTCGTACTTCTGGGTACTGGT
CTC
Reverse GTCCATGGATTTGCAGAGTCAG
SRCRSP1
Forward TGCAAGAAGTTTTTCCAGAGC
OarCP34
Forward GCTGAACAATGTGATATGTT
CAGG
Reverse ACCCTGGTTTCACAAAAGG
Reverse GGGACAATACTGTCTTAGATGC
TGC
OarCB226
Forward CTATATGTTGCCTTTCCCTTCC
TGC
Reverse GTGAGTCCCATAGAGCATAA
GCTC
MAF70
Forward CACGGAGTCACAAAGAGT
CAGACC
Reverse GCAGGACTCTACGGGGCCTT
TGC
and 72 °C for 1 min 30 s and a final extension at
72 °C for 15 min was used for sample amplification by
PCR. The amplified PCR products containing different
dyes were then electrophoresed in four multiplexes
(Table 8) in an automated DNA sequencer along with
LIZ600 (Applied Biosystems, USA) as an internal lane
control. The allele size data for each sample was generated using GENEMAPPER software version 5.
Data analysis
Morphological data analysis
The statistical analysis of the qualitative and quantitative
data was done using R 3.5.1 software [33].
For qualitative data, frequencies and proportions were
analyzed by region and sex using the Chi-square test.
Means, standard deviations and extreme values (minimum, maximum) were computed for all studied traits.
Dayo et al. BMC Genomic Data
(2022) 23:3
For the quantitative variables following the normal distribution, the comparisons of the means between regions
or sexes were computed using parametric tests, in particular the one-way analysis of variance (ANOVA) while
for those which did not follow the normal distribution,
these means were compared using non-parametric tests
(Kruskal-Wallis test, KW). Multivariate analysis (principal components analysis, PCA) was used to investigate
morphological structure and quantify differences among
subpopulations of DS from the four regions using the
FactoMiner Package implemented in R software [34].
Genotypic data analysis
Allele numbers, allelic richness, the unbiased estimator
of Wright’s inbreeding coefficient FIS, FIT, FST calculated
according to Weir and Cockerham [35] for each locus
were determined using FSTAT software version 2.9.4
[36]. The rarefaction approach for the allelic richness estimation uses the frequency distribution of alleles at a
locus to estimate the number of alleles that would occur
in smaller samples of individuals. It is used to
standardize  to the smallest N in a comparison [37].
Additionally, observed and unbiased expected heterozygosities per locus as well as the factorial correspondence
analysis (FCA) were estimated using GENETIX 4.03
(). Departures from
Hardy–Weinberg equilibrium over all loci were evaluated using Fisher’s method implemented in Genepop
v.4.7.2 [38]. The same software was used to perform the
score test for Hardy-Weinberg equilibrium [39] per
locus using a Markov chain algorithm with 10,000
dememorizations, 200 batches and 5000 iterations per
batch. The Hardy-Weinberg equilibrium test measures
the difference between the observed numbers of population genotypes and the theoretical genotypic numbers
obtained with the Hardy-Weinberg relationship. The effective number of alleles (Ae) and the polymorphic information content (PIC) for each locus were analyzed by
using Molkin v. 3.0 software [40]. The genetic identity
and genetic distances were calculated using Popgene
version 1.31 [41]. The unrooted neighbor-joining tree
based on Nei’s (1978) genetic distances was constructed
using PHYLIP version 3.698 [42].
To assign individuals to K populations and estimate
the posterior distribution of each individual’s admixture
coefficient, we used STRUCTURE software 2.3.4 [43]
which is a model-based clustering method that utilizes a
Monte Carlo Markov Chain. Because genotyping information for the putative parental populations was not
available, we hypothesized k parental unknown populations (k varying from 1 to 8 with 10 replicated runs for
each K). Analysis was performed with a burn in length
of 50,000 followed by 100,000 Markov chain Monte
Carlo iterations for each of K using uncorrelated allelic
Page 15 of 17
frequencies between the parental populations and an admixture model.
The optimal ‘K’ was identified based on ΔK, the second order rate of change in LnP(D) following the likelihood procedure of Evanno et al. [9] using Structure
Harvester (available at />structureHarvester/). Structure Harvester [44] is a webbased program for collating results generated by the
STRUCTURE program to identify the best value of K.
The program provides a fast way to assess and visualize
likelihood values across multiple values of K and hundreds of iterations for easier detection of the number of
genetic groups that best fit the data.
Abbreviations
Ae: Effective Allele Number; ANOVA: Analysis of variance; AR: Allelic Richness;
BL: Body Length; CD: Chest Depth; CG: Chest Girth; DNA: Deoxyribonucleic
acid; DS: Djallonké Sheep; EL: Ear Length; FCA: Factorial Correspondence
Analysis; FIS, FIT, FST: F-Statistics indices; Ho: Observed heterozygosity;
He: Expected heterozygosity; HL: Horn Length; HW: Height at the Withers;
HWE: Hardy-Weinberg equilibrium; ILH: Interval Length between the roots of
the two Horns in males; PCA: Principal components analysis;
PIC: Polymorphism Information Content; TL: Tail Length
Supplementary Information
The online version contains supplementary material available at https://doi.
org/10.1186/s12863-021-01009-7.
Additional file 1: Figure S1. Map (study area) of the origins of
Djallonké sheep sub-populations.
Acknowledgements
We thank the entire PROGEVAL National Coordination team, all the Technical
officers of the veterinary services and all the sheep breeders of Guinea-Bissau
for their help, their agreement and their participation in this study.
We also acknowledge Ms. KARAMBIRI Medina, Lecturer at the Centre
Universitaire de Ziniaré/Université Joseph KI-ZERBO for her help to develop
the Locations Map of the animal sampling.
Authors’ contributions
DGK was in charge of the overall study including its design, sample
collection, statistical analysis of morphological and molecular data,
manuscript writing and coordinating the author contributions. HI and SMB
had significant and equal contribution both to statistical analyses, the
molecular analysis and manuscript writing. LA has contributed in
morphological study design, data analysis and results interpretation. KM did
the genotyping of animals. IM, DB, GJ have collaborated in the study design
and sampling, SM, CB, YGCV have collaborated in study design and the
review of the final draft of the paper. In addition, YGCV was involved in the
coordination of the authors contribution. All authors read and approved the
final manuscript.
Funding
This study was conducted as part of the Project titled “Projet de Valorisation
des ressources génétiques animales et aquacoles locales dans l’espace
UEMOA / Valorization project of local animal and aquatic genetic resources
in the West African Economic and Monetary Union (PROGEVAL)” funded by
the CORAF - UEMOA Agreement. Mr. Mamadou IRA and Ms. Awa
LINGUELEGUE, co-authors of the article, were PhD and engineering graduate
students on the Project. We extend our sincere thanks to these technical
and financial partners. The funders had no role in study design, data collection and analysis, decision to publish, or preparation of the manuscript.
Dayo et al. BMC Genomic Data
(2022) 23:3
Availability of data and materials
The datasets used and analyzed during the present study are available from
the corresponding author on reasonable request. All data used have also
been published on. Preview of Morphological and SSR_Genetic data_
Djallonke_Sheep - Mendeley Data ( />z3z3sxdg/draft?preview=1).
DOI: />
Page 16 of 17
9.
10.
11.
Declarations
Ethics approval and consent to participate
The research protocol was approved by the Institutional Ethics Committee
under Number 003–2017/CE-CIRDES (Centre International de RechercheDéveloppement sur l’Elevage en zone Subhumide). All sheep owners were
aware of the planned research and gave their consent for phenotypic data
and blood samples collection from their sheep.
“We confirm that all methods were performed in accordance with the
relevant guidelines and regulations”.
In addition to this, informed consent was obtained from all farmers/subjects
involved in this study”.
12.
13.
14.
15.
Consent for publication
Not applicable.
16.
Competing interests
The authors declare that they have no competing interests.
Author details
1
Centre International de Recherche-Développement sur l’Elevage en zone
Subhumide (CIRDES), Bobo-Dioulasso 01 BP 454, Burkina Faso. 2Institut du
Sahel (INSAH/CILSS), BP 1530 Bamako, Mali. 3Current address: Centre for
Tropical Livestock Genetics and Health (CTLGH), Roslin Institute, University of
Edinburgh, Edinburgh, UK. 4Université Nazi BONI (UNB), Bobo-Dioulasso 01
BP 1091, Burkina Faso. 5Direction Générale de l’Elevage (DGE), BP 26 Bissau,
Guinée-Bissau.
Received: 25 February 2021 Accepted: 1 November 2021
17.
18.
19.
20.
References
1. Herrero M, Havlik P, Mcintire J, Palazzo A, Valin H. L’avenir de l’élevage
africain : Réaliser le potentiel de l’élevage pour la sécurité alimentaire, la
réduction de la pauvreté et la protection de l’environnement en Afrique
sub-saharienne. Genèse: Bureau du représentant spécial des Nations Unies
pour la sécurité alimentaire et nutritionnelle et du Coordonnateur du
système des Nations Unies contre la grippe (UNSIC); 2014. p. 118.
2. Akakpo K, Lero P, Mendes D, Silva BV. Guinée-Bissau : Résultats de l’enquête
approfondie sur la sécurité alimentaire et la vulnérabilité des ménages
ruraux (rapport final). Rome: Programme Alimentaire Mondial, Service de
l’Analyse de la Sécurité Alimentaire (VAM); 2011. p. 80. />sites/reliefweb.int/files/resources/Rapport_complet_77.pdf
3. DGE. Lettre de Politique de Développement de l’Elevage de la GuinéeBissau; 2010. p. 57.
4. Correia F. Revue des filières bétail/viande et lait et des politiques qui les
influencent en Guinée-Bissau. FAO. Editeurs : Niang M, Salla A, Bedane B.,
Rome : FAO et CEDEAO. 2016. 52. Disponible sur />67f.pdf
5. Ira M, Dayo G-K, Sangaré M, Djassi B, Gomes J, Cassama B, et al. Etat des
lieux de la caractérisation des ressources génétiques animales et aquacoles
en Guinée-Bissau et perspectives de valorisation. Int J Adv Res. 2018;6(12):
12–23. />6. FAO. Plan d’action mondial pour les ressources zoogénétiques et la
déclaration d’Interlaken. Rome: FAO; 2007. p. 52. />04f/a1404f00.pdf
7. FAO. Phenotypic characterization of animal genetic resources. Rome: FAO
Animal Production and Health Guidelines No. 11; 2012. p. 142.
8. DGE. Rapport national sur l’état des ressources génétiques de l’élevage.
Bissau: Ministère de 486 l’agriculture, des forêts, de la chasse et de l’élevage;
2002. p. 42.
21.
22.
23.
24.
25.
26.
27.
28.
29.
Evanno G, Regnaut S, Goudet J. Detecting the number of clusters of
individuals using the software STRUCTURE: a simulation study. Mol Ecol.
2005;14(8):2611–20. />OIE. Rapport d’évaluation PVS/OIE de la Guinée - Bissau, Version I; 2008. p.
124. />docs/pdf/Guinee-Bissau_OIE-PVS_300708.pdf
MADR. Guides sur les bonnes pratiques en matière de gestion de pâturages
et de corridors de transhumance en Guinée-Bissau (GSPCT), Guinée-Bissau,
vol. 16; 2013. Disponible sur />bissau/docs/environment/UNDP_GW_Bonnes_Pratiques_gestion_paturages.
DGE. Rapport de synthèse du recensement national de l’élevage en GuinéeBissau (rapport de synthèse). Guinée-Bissau; 2009. p. 30.
N’goran KE, Kouadja GS, Kouassi NC, Loukou NE, Eka JY, Dayo G-K, et al.
Primary morphological characterization of west African dwarf (Djallonké)
ewes from Côte d’Ivoire based on qualitative and quantitative traits. Int J
Genet Mol Biol. 2019;11(2):16–28. />Ndiaye B. Caractérisation phénotypique et génétique du mouton Peul-peul
du Sénégal, vol. 201947. Dakar: Thèse de Doctorat, Université Cheikh Anta
Diop de Dakar; 2020. p. 132.
Dayo G-K, Alfa E, Talaki E, Soedji K, Sylla S, Dao B. Caractérisation
phénotypique du mouton Vogan du Togo et relation avec le mouton
Djallonké et le mouton sahélien. Animal Genetic Resources. 2015;56:63–78.
/>Baenyi P, Meutchieye F, Ayagirwe BR, Bwihangane BA, Karume K,
Mushagalusa NG, et al. Biodiversity of indigenous Djallonké sheep (Ovis
aries) in Sudano Guinean region in Cameroon. Genet Biodiversity J. 2018;
2(2):1–10.
Traore A, Tamboura H, Kabore A, Yameogo N, Bayala B, Zare I.
Caractérisation morphologique des petits ruminants (ovins et caprins) de
race locale “Mossi” au Burkina Faso. AGRI. 2006;39:39–50. />017/S1014233900002121.
Sangaré M. Synthèse des résultats acquis sur l’élevage des petits ruminants
dans les systèmes de production animale d’Afrique de l’ouest. In: CIRDES
éditions. Document de synthèse du Programme concerté de recherchedéveloppement sur l’élevage en Afrique de l’ouest. Bobo-Dioulasso; 2005. p.
163.
Gueye A. Moutons et Chèvres du Sénégal : Caractérisation
morphobiométrique et typage sanguin. Thèse de docteur vétérinaire.
Sénégal: Université Cheikh Anta Diop de Dakar; 1997. p. 78.
Birteeb PT, Peters SO, Ozoje MO. Analysis of the body structure of Djallonké
sheep using a multideterminant approach. Animal Genet Resources. 2014;
54:65–72. />Asamoah-Boaheng M, Sam KE. Morphological characterization of breeds of
sheep: a discriminant analysis approach. SpringerPlus. 2016;5(1):69. https://
doi.org/10.1186/s40064-016-1669-8.
Hadzi YN. Les populations de bétail présentes au Togo. Animal Genetic
Resources. 1996;17:35–49. />Epstein H. The origin of the domestic animals of Africa, vol. 1. New York:
Africana Publishing Corporation; 1971.
Lebbie SHB, Ramsay K. A perspective on conservation and management
of small ruminant genetic resources in the sub-Saharan Africa. Small
Rumin Res. 1999;34(3):231–47. />88(99)00076-0.
Gbangboche A, Hornick J-L, Adamou-N’diaye M, Edorh AP, Farnir F, Abiola F,
et al. Caractérisation et mtrise des paramètres de la reproduction et de la
croissance des ovins Djallonké (Ovis aries). Ann Med Vet. 2005;149:148–60.
Agaviezor BO, Peters SO, Adefenwa MA, Yakubu A, Adebambo OA, Ozoje
MO, et al. Morphological and microsatellite DNA diversity of Nigerian
indigenous sheep. J Animal Sci Biotechnol. 2012;3(1):38. />0.1186/2049-1891-3-38.
Melesse A, Banerjee S, Lakew A, Mersha F, Hailemariam F, Tsegaye S, et al.
Morphological characterization of indigenous sheep in southern regional
state, Ethiopia. Animal Genet Resources. 2013;52:39–50. />017/s2078633612000513.
Ndiaye B, Diouf MN, Ciss M, Wane M, Diop M, Sembène M. Morphologie et
pratiques d’élevage du mouton Peul-peul du Sénégal. Int J Adv Res. 2018;
6(5):727–38. />Wafula PO, Jianlin H, Sangare N, Sowe JM, Coly R, Diallo B, et al. Genetic
characterization of west African Djallonké sheep using microsatellite
markers. Turin: The Role of Biotechnology, Villa Gualino; 2005.
Dayo et al. BMC Genomic Data
(2022) 23:3
30. Nei M. Estimation of average heterozygosity and genetic distance from a
small number of individuals. Genetics. 1978;89(3):583–90. />093/genetics/89.3.583.
31. FAO-AQUASTAT. Guinée-Bissau. In : L’irrigation en Afrique en chiffres,
enquêtes. Rome; 2005. p. 279–86. />32. FAO. Molecular genetic characterization of animal genetic resources. FAO
Animal Production and Health Guidelines. No. 9. Rome. 2011.
33. R Core Team. R: A language and environment for statistical computing.
Vienna: R Foundation for Statistical Computing; 2018. https://www.R-project.
org/
34. Husson F, Josse J, Le S, Mazet J. Facto-MineR multivariate exploratory data
analysis and data mining with R. R package version 1.26. 2014. http://fa
ctominer.free.fr/factomethods/index_fr.html
35. Weir BS, Cockerham C. 1984. Estimating F-statistics for the analysis of
population structure. Evolution. 1984;38(6):1358–70. />j.1558-5646.1984.tb05657.x.
36. Goudet J. FSTAT. A program to estimate and test gene diversities and
fixation indices (version 2.9.4). 2003. Available on: />popgen/softwares/fstat.htm.
37. Petit RJ, El Mousadik A, Pons O. Identifying populations for conservation on
the basis of genetic markers. Conserv Biol. 1998;12(4):844–55. https://doi.
org/10.1046/j.1523-1739.1998.96489.x.
38. Rousset F. Genepop'007: a complete reimplementation of the Genepop
software for windows and Linux. Mol Ecol Resources. 2008;8(1):103–6.
/>39. Raymond M, Rousset F. GENEPOP. Population genetics software and
ecumenicism, http:/wbiomed.curtin.edu.au/genepop/. J Hered. 1995;86(3):
248–9. />40. Gutiérrez JP, Royo LJ, Álvarez I, Goyache F. MolKin v2.0: a computer
program for genetic analysis of populations using molecular coancestry
information. J Hered. 2005;96(6):718–21. />8.
41. Yeh FC, Yang R-C, Boyle T. POPGENE Version 1.31. Microsoft windows-based
freeware for population genetics analysis. 1999. />Softlib/MSLFILES/HPGL.EXE.
42. Felsenstein J. PHYLIP (Phylogeny Inference Package) version 3.698. Seattle:
Department of Genome Sciences, University of Washington; 2009.
43. Pritchard JK, Stephens M, Donnelly P. Inference of population structure
using multilocus genotype data. Genetics. 2000;155(2):945–59. https://doi.
org/10.1093/genetics/155.2.945.
44. Earl DA, Vonholdt BM. STRUCTURE HARVESTER: a program for visualizing
STRUCTURE output and implementing the Evanno method. Conserv Genet
Resour. 2012;4(2):359–61. />
Publisher’s Note
Springer Nature remains neutral with regard to jurisdictional claims in
published maps and institutional affiliations.
Page 17 of 17