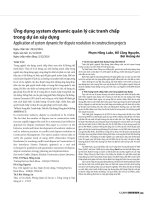
Characterization and comparative analysis of transcriptional profiles of porcine colostrum and mature milk at different parities
Bạn đang xem bản rút gọn của tài liệu. Xem và tải ngay bản đầy đủ của tài liệu tại đây (3.13 MB, 20 trang )
Keel et al. BMC Genomic Data
(2021) 22:25
/>
BMC Genomic Data
RESEARCH ARTICLE
Open Access
Characterization and comparative analysis
of transcriptional profiles of porcine
colostrum and mature milk at different
parities
Brittney N. Keel* , Amanda K. Lindholm-Perry, William T. Oliver, James E. Wells, Shuna A. Jones and Lea A. Rempel
Abstract
Background: Porcine milk is a complex fluid, containing a myriad of immunological, biochemical, and cellular
components, made to satisfy the nutritional requirements of the neonate. Whole milk contains many different cell
types, including mammary epithelial cells, neutrophils, macrophages, and lymphocytes, as well nanoparticles, such
as milk exosomes. To-date, only a limited number of livestock transcriptomic studies have reported sequencing of
milk. Moreover, those studies focused only on sequencing somatic cells as a proxy for the mammary gland with the
goal of investigating differences in the lactation process. Recent studies have indicated that RNA originating from
multiple cell types present in milk can withstand harsh environments, such as the digestive system, and transmit
regulatory molecules from maternal to neonate. Transcriptomic profiling of porcine whole milk, which is reflective
of the combined cell populations, could help elucidate these mechanisms. To this end, total RNA from colostrum
and mature milk samples were sequenced from 65 sows at differing parities. A stringent bioinformatic pipeline was
used to identify and characterize 70,841 transcripts.
Results: The 70,841 identified transcripts included 42,733 previously annotated transcripts and 28,108 novel
transcripts. Differential gene expression analysis was conducted using a generalized linear model coupled with the
Lancaster method for P-value aggregation across transcripts. In total, 1667 differentially expressed genes (DEG) were
identified for the milk type main effect, and 33 DEG were identified for the milk type x parity interaction. Several
gene ontology (GO) terms related to immune response were significant for the milk type main effect, supporting
the well-known fact that immunoglobulins and immune cells are transferred to the neonate via colostrum.
Conclusions: This is the first study to perform global transcriptome analysis from whole milk samples in sows from
different parities. Our results provide important information and insight into synthesis of milk proteins and innate
immunity and potential targets for future improvement of swine lactation and piglet development.
Keywords: RNA-Seq, Transcriptome, Milk, Colostrum, Total RNA, Gene expression, Long non-coding RNA, Lancaster
method
* Correspondence:
Mention of a trade name, proprietary product, or specified equipment does
not constitute a guarantee or warranty by the USDA and does not imply
approval to the exclusion of other products that may be suitable.
The USDA is an equal opportunity provider and employer.
USDA-ARS Roman L Hruska US Meat Animal Research Center, Clay Center,
NE 68933, USA
© The Author(s). 2021 Open Access This article is licensed under a Creative Commons Attribution 4.0 International License,
which permits use, sharing, adaptation, distribution and reproduction in any medium or format, as long as you give
appropriate credit to the original author(s) and the source, provide a link to the Creative Commons licence, and indicate if
changes were made. The images or other third party material in this article are included in the article's Creative Commons
licence, unless indicated otherwise in a credit line to the material. If material is not included in the article's Creative Commons
licence and your intended use is not permitted by statutory regulation or exceeds the permitted use, you will need to obtain
permission directly from the copyright holder. To view a copy of this licence, visit />The Creative Commons Public Domain Dedication waiver ( applies to the
data made available in this article, unless otherwise stated in a credit line to the data.
Keel et al. BMC Genomic Data
(2021) 22:25
Background
Colostrum and milk play a key role in survival and
growth of the neonate, providing essential nutrients and
antibodies [1]. Langer et al. [2] investigated differences
in composition of colostrum and mature milk in several
eutherian species and found that in some species colostrum contains higher concentrations of proteins than
mature milk, and in other species the fluids have similar
composition. These differences are likely due to speciesspecific strategies for immunoglobulin transfer, i.e. prenatal transfer via placenta or yolk sac versus postnatal
transfer via colostrum [2]. The critical importance of
colostrum and milk for the newborn piglet has been
well-documented [1, 3].
Piglet growth and survival are critical to the swine industry. Progeny born to primiparous sows (gilts) are
born lighter, grow slower, and have higher mortality
rates than those born to multiparous sows [4, 5]. It has
been hypothesized that differences in lifetime performance between gilt progeny and sow progeny may be due
to differences in lactation performance, specifically lower
levels of immunoglobulin G (IgG) and other energetic
components in the colostrum and milk of gilts. However, data from Craig et al. [6] showed no parity differences in total IgG, fat, protein, lactose, and net energy
concentrations. These results suggest that the poorer
performance of gilt progeny is unlikely due to insufficient nutrient levels and is more likely due to differences
in colostrum and milk intake and their ability to digest
and absorb each component [5].
The presence of many different ribonucleic acid
(RNA) types, including messenger RNA (mRNA), micro
RNA (miRNA), long non-coding RNA (lncRNA), and
circular RNA (circRNA) has been documented in milk
from several mammalian species [7–12]. In fact, the total
RNA concentration in human breast milk was higher
than in other body fluids [8]. Whole milk contains many
different cell types, including mammary epithelial cells
(MEC), neutrophils, macrophages, and lymphocytes [7,
13], as well nanoparticles, such as milk exosomes [14].
Products from exosomes can withstand harsh environments such as the digestive system and allow for transmission of regulatory molecules (e.g., miRNA) from
maternal to neonate [15–17]. Additionally, mRNA that
are resistant to acidic conditions and RNase treatments
have been identified in bovine milk [15, 18].
A limited number of livestock transcriptomic studies
have reported sequencing of milk, including two in
swine [19, 20], three in cattle [21–23], one in goat [24],
one in sheep [25], and one in buffalo [26]. The emphasis
of these studies was gene expression related to the lactation process, and as such, milk somatic cells were sequenced as a proxy for the mammary gland tissue.
Additionally, the RNA repertoire derived from milk
Page 2 of 20
exosomes has been reported in cattle [11, 27] and swine
[12, 28]. To our knowledge, there have been no studies
that have reported direct sequencing of porcine whole
milk samples.
As the only nutritional source for newborn piglets,
porcine colostrum and milk contain critical nutritional
and immunological components, including carbohydrates, lipids, and immunoglobulins, as well as exosomes, oligosaccharides, and bacteria, which possibly
act as biological signals and modulate the intestinal environment and immune status later in life [29]. As part
of an effort to explore the transcriptomic profile of the
piglet’s neonatal diet, we performed total RNAsequencing (total RNA-Seq) on porcine whole milk
samples (colostrum and mature milk) from dams in
parities one through four to characterize and compare
the two transcriptomes. We identified novel mRNA
and lncRNA transcripts and quantified expression of
both known and novel porcine transcripts. Expression
profiles were compared to identify differentially
expressed genes (DEG) between colostrum and mature
milk between parities.
Results
High-throughput sequencing
RNA-Seq libraries were sequenced generating over 6 billion 75 base pair (bp) paired-end reads, with an average
of 46.2 million reads per library (Table S1). The number
of reads in the colostrum libraries ranged from 22.6 to
81.8 million reads with an average of 44.4 million reads,
while the number of reads in the mature milk libraries
ranged from 24.2 to 97.8 million reads with an average
of 48.0 million reads. After adapter removal and read
trimming, the resulting high-quality reads were mapped
to the Sscrofa 11.1 genome assembly with an average
99.6% read mapping rate per library. The number of
reads aligning to known mRNA, miscellaneous RNA
(miscRNA; short non-coding RNA), non-coding RNA
(ncRNA), and pseudogenes in the swine genome are presented in Table S2. It was observed that ~ 50% of reads
mapped to known mRNA, while 50.5% of colostrum
reads and 44.5% of milk reads were mapped outside of
annotated loci, potentially harboring novel transcripts
(Fig. 1).
Transcript identification and characterization
Transcripts, assembled individually for each library, were
merged into a single set of 460,853 putative transcripts.
This set was subjected to several filtering steps to remove transcriptional noise and classify transcripts
(Fig. 2). Transcripts identified in only one library and
lowly expressed transcripts were removed, as these were
considered transcriptional noise. The remaining set of
transcripts was filtered to include only those with class
Keel et al. BMC Genomic Data
(2021) 22:25
Page 3 of 20
Fig. 1 Distribution of reads aligning to the S. scrofa 11.1 genome. RNA classifications are based on the S. scrofa reference genome annotation
(NCBI Release 106)
codes ‘=’, ‘u’, ‘x’, ‘j’, and ‘i’ (Figure S1). The transcripts
with class codes ‘u’, ‘x’, ‘j’, and ‘i’ were further filtered by
length, and number of exons. This set of 38,164 putative
novel transcripts were then subjected to classification by
open reading frame (ORF) length and protein coding potential score to complete transcript characterization. In
total, 70,841 transcripts were identified in the porcine
milk transcriptome, including 42,733 previously annotated transcripts as well as 28,108 novel transcripts.
Genomic coordinates of the identified novel transcripts are given in Tables S3 and S4. Among the novel
lncRNA transcripts, 256 and 175 were intergenic long
non-coding RNA (lincRNA) and intronic long noncoding RNA (ilncRNA), respectively, while 305 lncRNA
flanked a protein-coding gene in a divergent orientation
(long non-coding natural antisense transcripts; lncNAT)
and 566 were novel isoform long non-coding RNA (isolncRNA) (Fig. 3A). Using the BLAST algorithm, a total
of 578 lncRNA exhibited homology with transcripts in
the porcine NONCODE database, 146 lncRNA exhibited
homology with non-coding transcripts in other species,
and 225 lncRNA were homologous to noncoding transcripts in both swine and other species (Fig. 3B; Table
S5). A similar analysis identified that 26,582 of the novel
mRNA transcripts were homologous to known transcripts in swine and other species (Fig. 4).
Basic sequence features of the novel transcripts, including length, exon number, expression, and ORF
length, are shown in Fig. 5 and Table 1. Novel lncRNA
were significantly shorter and expressed at lower levels
than novel mRNA and known transcripts (Fig. 5A, B).
The exon number of the novel lncRNA and coding
transcripts were notably smaller than that of known
transcripts (Fig. 5C). The ORF length of novel lncRNA
was significantly shorter than ORF length in known and
novel coding transcripts, while the ORF length of novel
coding transcripts was significantly shorter than that of
known transcripts (Fig. 5D).
Transcripts corresponded to 17,910 unique gene loci,
of which 17,296 genes were previously annotated in the
S. scrofa reference genome. Previously annotated transcripts corresponded to 16,992 known gene loci, while
unannotated protein-coding and non-coding transcripts
corresponded to 8384 (7933 known) and 1059 (843
known) loci, respectively. In general, gene expression
values were widely distributed (Fig. 6), with the distributions of gene expression values being approximately
equal for colostrum and mature milk. There was a large
overlap (19 out of 25) in the top twenty-five most abundantly expressed genes in colostrum and mature milk
(Table 2; Fig. 7).
Expression of cell-specific markers
Whole milk is a complex fluid containing a heterogenous
mixture of cells [30, 31]. Analysis of gene expression of
cell-specific markers, the same markers utilized in [32],
was used to estimate the proportion of various cell types
present in colostrum and mature milk samples (Table 3;
Fig. 8). Epithelial cells were the most abundant cells in all
samples, with higher abundance in mature milk samples.
Stromal cells represented ~ 1% of the cell population in all
samples. Immune cells and stromal cells were both more
abundant in colostrum samples.
Keel et al. BMC Genomic Data
(2021) 22:25
Page 4 of 20
Fig. 2 Computational pipeline used to determine novel transcripts from RNA-Seq data
PCA and differential expression analysis
The principal component analysis (PCA) plot (Fig. 9)
showed that colostrum and mature milk transcript expression profiles seem to fall into distinct clusters, while
there was no clear clustering of samples by parity. After
multiple testing correction, we identified 169 differentially expressed transcripts (DET) for the milk type x
parity interaction, 4783 DET for the milk type main effect, and 9639 DET for the parity main effect (Tables S6,
S7 and S8). Table 4 shows the classifications of DET.
The DET set for the milk type main effect was comprised of 2479 known transcripts, 2132 novel coding
transcripts, and 172 novel lncRNA, while the interaction
DET set included 85 known transcripts and 80 and 4
novel coding transcripts and lncRNA, respectively. The
25 most significant DET for milk type and interaction
are given in Tables 5 and 6, respectively. P-values of
transcripts were aggregated for each gene loci to obtain
DEG. A total of 1667 DEG were identified for the milk
type main effect, and 33 DEG were identified for the
milk type x parity interaction (Tables S9 and S10).
Gene ontology and pathway analysis
Gene ontology (GO) analysis of the DEG indicated that
genes associated with the milk type main effect were
predominantly involved in binding (37.5%), catalytic activity (30.5%), molecular function regulation (15.8%), and
transporter activity (8.2%). A total of 250 biological
process, 25 molecular function, and 54 cellular component GO terms were significantly enriched in this gene
set (Table S11). Additionally, 3 KEGG pathways were
significantly enriched.
Like the milk type main effect genes, DEG for the milk
type x parity interaction were involved in binding (45.5%),
Keel et al. BMC Genomic Data
(2021) 22:25
Page 5 of 20
Fig. 3 Classification of novel lncRNA In (A) lincRNA denotes intergenic long-noncoding RNA, ilncRNA denotes intronic long-noncoding RNA,
lncNAT denotes long non-coding antisense transcripts, and isolncRNA denotes novel isoform long non-coding RNA
catalytic activity (27.3%), molecular adapter activity (9.1%),
molecular function regulation (9.1%), and transporter activity (9.1%). No GO terms or pathways were significantly
enriched in this DEG set.
Discussion
Milk production, milk composition, milk intake, and
milk digestibility are all major limiting factors in the
growth and survival of a sow’s litter. Knowledge of porcine milk composition, as well as understanding genetic
factors underlying its variation, is a matter of ongoing
interest. In this study, we performed the first exhaustive
characterization of the porcine milk transcriptome derived from whole milk samples. The goal was to
characterize and compare transcriptomic profiles of
samples collected during early and mid-lactation from
dams across different parities. This study was the first in
a series of studies aimed at exploring the molecular profile of the piglet’s neonatal diet.
Total RNA was isolated from 130 fresh whole milk
samples (65 colostrum and 65 mature milk) from dams
across four parities. In most milk transcriptome studies,
Keel et al. BMC Genomic Data
(2021) 22:25
Page 6 of 20
Fig. 4 Overlap of novel protein-coding transcripts with RefSeq database
milk is fractionated, and RNA is extracted from somatic
cells, milk fat, or whey. Total RNA concentrations tend
to be higher in the milk fat and somatic cells than in the
whey fraction, while RNA integrity of somatic cells is
higher than those of milk fat and whey [33, 34]. Low
RIN values in this study (average RIN = 4.0) are likely
due to the presence of small amounts of cytoplasmic
material in milk fat globules [35], bacteria and small
RNA (miRNA) in the fat fraction [36], and degraded
and/or free RNA. Each milk fraction has its own place in
research settings. The advantages and disadvantages of
each RNA source has previously been summarized [32].
In this study, we chose to utilize whole milk samples in
order to capture the broader transcriptomic signatures
Fig. 5 Basic features of transcripts. A Expression level of transcripts. B Length distribution of transcripts. C Number of exons for transcripts. D ORF
length distribution of transcripts
Keel et al. BMC Genomic Data
(2021) 22:25
Page 7 of 20
Table 1 Median characteristics of expressed transcripts
Novel lncRNA
Novel Coding
Known Transcripts
Expressiona
0.06d, f
0.09e
0.09
Lengthb
13.37e, f
34.51
29.25
e, f
Number Exons
2
ORF Lengthc
109e, f
e
8
10
332e
481
a
Measured in log10(FPKM+ 1)
Measured in kbp
Measured in bp
e
Left-tailed Wilcoxon rank-sum P-value < 0.05 compared to known transcripts
f
Left-tailed Wilcoxon rank-sum P-value < 0.05 compared to novel coding
b
c
of porcine colostrum and milk. We were able to process
the samples much more quickly than had we fractionated the milk, and our sample represents the entirety of
what is being ingested by the growing piglet.
Libraries were sequenced to an average depth of 46
million reads per library. A depth of 40 million reads is
considered sufficient for reliable detection of major
splice isoforms for abundant and moderately abundant
transcripts [37]. When generating our sequence data, we
targeted a depth of 50 million reads per library. However, there was considerable variation in sequence depth
across libraries. Some of this variation can be attributed
to technical aspects of next-generation sequencing
(NGS) technology, such as the stochasticity of sequencing, RNA quality, and library preparation.
A total of 70,841 transcripts were identified in this
study, of which approximately 60% are annotated in the
current swine genome build. Transcripts corresponded
to 17,910 unique gene loci, including 17,296 known porcine genes. The number of expressed genes is comparable to those reported in similar studies in sheep [25]
and goat [24]. A smaller number of expressed genes (~
13,500) was reported in the buffalo milk transcriptome
[26]. This discrepancy is likely to due to the swine,
sheep, and goat reference genomes being more complete
and of higher quality.
As expected, cells in our whole milk samples appeared
to be a heterogeneous population of immune, epithelial,
stromal, and stem cells (Table 3; Fig. 8). Epithelial cells
represented the largest subset of the cell population in all
samples, on average 85% of the cell population per sample.
This is consistent with findings in bovine milk [31]. Immune cells were the second most abundant cell type, comprising an average of 14 and 9% the colostrum and mature
milk cell populations, respectively. In general, stromal cells
were more highly expressed in colostrum. In particular,
adipocytes (characterized by the FABP4 marker)
accounted for nearly 2% of colostrum cell populations.
Adipocytes release the hormone leptin in the presence of
insulin, which is present in colostrum and mature milk.
Previous studies have shown a decrease in leptin concentration in milk across lactation stages in swine [38], human [39], and cattle [40]. Hemopoietic stem cells
accounted for approximately 1% of the cell population in
both colostrum and mature milk, differing from findings
in human where hemopoietic stem cells were significantly
higher in mature milk compared to colostrum [41].
Previous milk transcriptome studies in livestock have
used sequencing of milk somatic cells as a proxy for the
mammary gland to study the lactation process. Recent
studies have indicated that RNA originating from multiple cell types present in milk can withstand harsh environments, such as the digestive system, and transmit
regulatory molecules from maternal to neonate [15–17].
Hence, transcriptome profiling of whole milk samples,
which is reflective of the combined cell populations, is
needed to understand these mechanisms. Most of the
stable, bioactive RNA in milk reported in the literature
has been miRNA [17]. However, stable mRNA, alpha
S2-casein (CSN1S2), beta-casein (CSN2), and beta-
Fig. 6 Plot of gene expression distribution for colostrum and mature milk samples. Values are averaged across samples in each group
Keel et al. BMC Genomic Data
(2021) 22:25
Page 8 of 20
Table 2 Top expressed genes in porcine colostrum and mature milk
Description
Colostruma
Mature Milka
LOC110258600
Basic salivary proline-rich protein 2-like
28.49 (1)
8.33 (7)
MIR9816
Uncharacterized ncRNA
18.39 (2)
5.30 (8)
PAEP
Progestagen associated endometrial protein
10.85 (3)
15.01 (3)
LOC102158335
Uncharacterized ncRNA
7.77 (4)
1.77 (15)
LOC110258215
Progesterone receptor-like
6.10 (5)
1.87 (12)
LOC110258214
Basic salivary proline-rich protein 4-like
5.83 (6)
0.712 (29)
CYTB
Cytochrome b
5.46 (7)
1.05 (22)
MSTRG.27426
Novel mRNA
4.06 (8)
9.49 (6)
NEMF
Nuclear export mediator factor
3.74 (9)
9.81 (5)
CSN3
Casein kappa
3.65 (10)
29.90 (2)
DIABLO
Diablo IAP-binding mitochondrial protein
3.38 (11)
1.10 (21)
LOC100737553
Peptidyl-prolyl cis-trans isomerase A pseudogene
3.20 (12)
44.80 (1)
EEF1A1
Eukaryotic translation elongation factor 1 alpha 1
2.98 (13)
1.83 (14)
CSN1S1
Casein alpha s1
2.54 (14)
12.12 (4)
Gene Symbol
LOC102163473
Uncharacterized ncRNA
1.96 (15)
0.58 (??)
XDH
Xanthine dehydrogenase
1.35 (16)
1.86 (13)
TPT1
Tumor protein, translationally-controlled 1
1.34 (17)
1.12 (20)
PDE4D
Phosphodiesterase 4D
1.19 (18)
0.25 (49)
FASN
Fatty acid synthase
1.05 (19)
1.27 (18)
FABP3
Fatty acid binding protein 3
0.94 (20)
1.35 (16)
ICK
Ciliogenesis associated kinase 1
0.87 (21)
1.25 (19)
CSN2
Casein beta
0.82 (22)
2.13 (11)
RPLP0
Ribosomal protein lateral stalk subunit P0
0.82 (23)
0.36 (41)
EEF2
Eukaryotic translation elongation factor 2
0.78 (24)
0.42 (38)
RPL4
Ribosomal protein L4
0.63 (25)
0.30 (42)
LALBA
Lactalbumin alpha
0.36 (49)
4.54 (9)
SAA3
Serum amyloid A-3 protein
0.25 (76)
2.30 (10)
POLE2
DNA polymerase epsilon 2, accessory subunit
0.57 (27)
1.35 (17)
PIGR
Polymeric immunoglobulin receptor
0.11 (148)
1.00 (23)
PLIN2
Perilipin 2
0.06 (257)
0.89 (24)
ACSL3
Acyl-CoA synthetase long chain family member 3
0.13 (132)
0.87 (25)
a
Average normalized gene expression value (× 105) across samples. Number in parenthesis is ranking in expressed genes
lactoglobin (BLG), have been reported in cattle [16].
These three mRNA were also found to be expressed in
both colostrum and mature milk samples in this study.
Additional studies are needed to confirm whether these
mRNA can function in the piglet gastrointestinal tract.
Among the top expressed genes were CSN3, CSN2,
CSN1S1, LALBA, FASN, EEF1A1, PAEP, TPT1, FABP3,
XDH, PIGR, and SAA3 (Table 2; Fig. 7), which have been
previously identified among the top expressed genes in
milk samples from other species [10, 24–26, 42]. As expected, many of the top expressed genes were related to
biosynthesis of milk proteins. Expression levels of CSN2,
CSN3, CSN1S1, LALBA, and PAEP, which encode for
the synthesis of the main milk proteins casein and whey,
increased from early to mid-lactation stages. A similar
gene expression pattern has been identified in a previous
swine study [43], as well as in goat [24], cattle [42], and
sheep [25]. High expression of the EEF1A1 gene is also
related to high levels of milk protein synthesis, as
EEF1A1 is one of the most abundant protein synthesis
factors [24]. Consistent with results in buffalo [26], ribosomal protein RPLP0 was among the top expressed
genes in colostrum and exhibited a slight decrease in expression during mid-lactation.
In addition to milk protein synthesis genes, genes associated with milk fat were among the top expressed
Keel et al. BMC Genomic Data
(2021) 22:25
Page 9 of 20
Fig. 7 Relative gene abundances of highest expressed genes in A colostrum and B mature milk samples
genes, and their expression increased from early to midlactation. Milk fat composition is known to influence
piglet growth and development [44]. The FABP3 gene,
which is involved in the uptake and transport of fatty
acids, has been linked to milk fat synthesis in cattle [45].
FASN is directly involved in most of the short and
medium-chain fatty acids in milk [46], and PLIN2 is involved in the formation of the lipid droplet in milk [47].
DET were determined for the milk type by parity
interaction, as well as both the milk type and parity main
Keel et al. BMC Genomic Data
(2021) 22:25
Page 10 of 20
Table 3 Average proportion of cell types in colostrum and mature milk samples
Cell Typea
P1
Col.
P2
Col.
P3
Col.
P4
Col.
P1
Milk
P2
Milk
P3
Milk
P4
Milk
Pan- Immune (PTPRC)
0.100
0.136
0.088
0.112
0.087
0.134
0.037
0.056
Immune (CD8A)
0.001
0.007
0.002
0.011
0.001
0.000
0.001
0.000
Immune (NCAM1)
0.002
0.018
0.003
0.052
0.000
0.000
0.000
0.000
Immune (CD19)
0.000
0.000
0.000
0.000
0.000
0.000
0.000
0.000
Immune (CD4)
0.001
0.001
0.000
0.012
0.000
0.000
0.000
0.000
Immune (CD3E)
0.001
0.003
0.000
0.004
0.000
0.000
0.000
0.000
Immune (CD3D)
0.002
0.004
0.003
0.006
0.002
0.002
0.002
0.001
Immune (CD3G)
0.000
0.000
0.000
0.001
0.000
0.000
0.001
0.000
Stromal (FABP4)
0.029
0.025
0.023
0.026
0.006
0.008
0.003
0.003
Stromal (SL100A4)
0.003
0.002
0.002
0.002
0.000
0.000
0.000
0.000
Stromal (DLK1)
0.000
0.001
0.000
0.003
0.000
0.000
0.000
0.000
Epithelial (LAMP1)
0.333
0.296
0.295
0.261
0.177
0.168
0.172
0.160
Epithelial (EPCAM)
0.020
0.236
0.291
0.294
0.516
0.449
0.534
0.558
Epithelial (KRT8)
0.311
0.259
0.284
0.202
0.198
0.223
0.234
0.203
Stem (CD34)
0.010
0.012
0.009
0.015
0.010
0.013
0.014
0.016
a
Cell-specific marker shown in parentheses
effects. DET for the parity main effect are presented for
completeness (Table S8), but the discussion will be restricted to DET/DEG for the milk type main effect and
milk by parity interaction, as the objective of this study
was to investigate transcriptomic differences between
colostrum and milk.
Several of the most significant DET were associated
with genes involved in milk fat synthesis and immunity
(Tables 4 and 5). Transcripts rna42732 (THRSP gene)
and rna62377 (ANXA7 gene) are milk fat synthesis genes
among the most significant DET. THRSP, thyroid hormone responsive, is a crucial protein for cellular de novo
Fig. 8 Expression of cell-specific markers in colostrum and mature milk transcriptomes. Each box in the heatmap represents the relative proportion of
cell-specific marker in the sample, i.e. the number of reads mapped to the cell-specific marker divided by the sum of the reads mapped to cell-specific
markers. Samples are organized by milk type (colostrum and milk) and parity (P1-P4) as shown on the x-axis. Cell-specific markers are shown along the
y-axis, with font color indicating the cell marker type: Green = stem cell, Blue = epithelial cell, Gray = stromal cell, and Orange = immune cell
Keel et al. BMC Genomic Data
(2021) 22:25
Page 11 of 20
Fig. 9 PCA plot of colostrum (C) and mature milk (M) transcripts from dams in parities 1–4
lipogenesis and has been shown to play an important
role in lipogenesis in the mammary epithelial cell [48,
49]. Expression of milk fat synthesis transcripts was upregulated in mature milk samples compared to colostrum, which agreed with expression patterns observed
across bovine lactation stages [50]. Our results are consistent with the finding that the transition from swine
colostrum to mature milk is marked by a shift from high
protein contents to high fat and lactose contents [51].
Transcript rna70598, associated with the colostrum
trypsin inhibitor-like gene (LOC100513767), was found
to be significantly differentially expressed for the milk
type main effect. Moreover, its expression was over 7fold higher in colostrum than mature milk. Trypsin secreted by the small intestine can degrade colostral antibodies, and swine immunoglobulins, such as IgG and
IgA are susceptible to trypsin degradation [52]. Colostral
trypsin inhibitor helps protect these immunoglobulins
without preventing the digestion of other milk proteins.
In addition, DET associated with granzymes GZMB
(transcript rna37492) and GZMH (transcript rna37493)
were among the most significant DET. Granzymes are
Table 4 Classifications of DET for milk type main effect and milk
type x parity interaction
Milk Type
Milk Type x Parity
Known Transcripts
2479
85
Novel Coding Transcripts
2132
80
Novel lncRNA
172
4
Total
4783
169
serine proteases and six of the twelve members of the
granzyme family (A, B, H, K, and M) have been identified in the swine genome [53]. Presence of these proteins
in milk leukocytes would indicate the existence of activated or memory t-cells which are likely actively fighting
pathogenic cells which may be of importance for either
the infant or the protection of the mammary gland [54].
In this study, DEG were identified by aggregating Pvalues across transcripts associated with each gene via
the Lancaster method, rather than using gene read
counts directly. Using this approach not only maintains
both transcript and gene-level resolution, but also bypasses issues of different variances and directions of
change across constituent transcripts. This method outperforms other gene-level methods and provides a coherent analysis between transcripts and genes [55].
One of the major aims of this study was to evaluate
DEG between lactation stages across different parities.
Progeny born to multiparous sows generally exhibit superior growth performance compared to those born to
primiparous sows. However, colostrum and milk composition profiles (immunoglobulin, protein, fat, lactose,
and net energy) are highly similar across parities [6]. Results from this study support this finding, as very few
gene expression differences were identified in the milk
type by parity interaction. Only 33 DEG were identified
for the milk type by parity interaction and only a clear
separation in milk type was exhibited in the PCA analysis (Fig. 9).
Glucose transport is a major precursor to lactose synthesis, which is synthesized in the Golgi vesicle of
Keel et al. BMC Genomic Data
(2021) 22:25
Page 12 of 20
Table 5 Twenty-five most significant DET associated with milk type. Significance was ranked using FDR-adjusted P-value
Transcript
Gene
Gene Description
rna45537a
CCDC71L
Coiled-coil domain containing 71 like
rna5080a
ALDH1A1
Aldehyde dehydrogenase 1 family member A1
rna54008
KCNH8
Potassium voltage-gated channel subfamily H member 8
rna19955a
C4H8orf46
Vexin (VXN)
b
b
rna70598
LOC100513767
Colostrum trypsin inhibitor-like
rna37492a
GZMB
Granzyme B
rna42732a
THRSP
Thyroid hormone responsive
rna8225b
LRP4
LDL receptor related protein 4
a
MSTRG.255032.1
LOC110256328
Uncharacterized ncRNA
rna57086a
BCHE
Butyrylcholinesterase
rna4906a
SETDB2
SET domain bifurcated histone lysine methyltransferase 2
MSTRG.313167.1b
MSTRG.313167
Novel gene loci
rna48308
CALML5
Calmodulin like 5
MSTRG.211924.1b
KIF26B
Kinesin family member 26B
rna56663
LOC100739719
Tetraspanin-6
rna16073b
SOWAHC
Sosondowah ankyrin repeat domain family member C
rna75068
COL4A5
Collagen type IV alpha 5 chain
rna8510b
ABTB2
Ankyrin repeat and BTB domain containing 2
a
rna5531
STAB1
Stabilin 1
rna2697a
VPS33B
VPS33B late endosome and lysosome associated
b
a
b
b
rna29012
TRAPPC6A
Trafficking protein particle complex subunit 6A
rna44370b
FMO2
Flavin containing dimethylaniline monooxygenase 2
rna44593a
PIGR
Polymeric immunoglobulin receptor
rna8754a
SAA3
Serum amyloid A-3 protein
rna37493a
GZMH
Granzyme H
a
Indicates up-regulation in mature milk
b
Indicates down-regulation in mature milk
mammary secretory alveolar epithelial cells during lactation [56]. Glucose-6-phosphate transporter SLC37A2
and glucose transporter SLC2A5 were identified as
DEG for the milk type main effect. Glucose transport
across the plasma membrane of mammalian cells is carried out by two distinct processes one of which involves
glucose transporters from the GLUT gene family
(encoded by SLC2A genes) and the other which involves glucose transporters from the SGLT family
(encoded by SLC5A genes). Both the SLC2A5 and
SLC37A2 genes were up-regulated in colostrum. Crisá
et al. [24] identified significant up-regulation of members of the SLC2A gene family and polysaccharide and
glycosamino-glycan binding molecular function to be
enriched in goat colostrum samples compared to mature milk.
Members of the SLC35 gene family encode nucleotide sugar transporters localizing at the Golgi apparatus and/or the endoplasmic reticulum. These
transporters transport nucleotide sugars pooled in the
cytosol into the lumen of these organelles, where
most glycoconjugate synthesis occurs [57]. Currently,
the SLC35 gene family is comprised of 31 genes
which are divided into 7 subfamilies, SLC35A to
SLC35G [58]. GDP-fucose transporters SLC35C1 and
SLC35C2 were identified as DEG for the milk type
main effect, with SLC35C2 up-regulated in colostrum
and SLC35C1 down-regulated. Several other members
of the SLC35 family, SLC35B2, SLC35D1, SLC35E1,
SLC35E3, and SLC35G1, were statistically significant
but were filtered out based on our log-fold change
criteria. Crisà et al. [24] identified 3 DEG from the
SLC35 family that were up-regulated in goat colostrum compared to mature milk, as well as enrichment
of glycosaminoglycan binding molecular in colostrum.
Consistent with this result, we also identified the enrichment of glycosaminoglycan binding molecular
function, with 22 of the 118 annotated genes associated with the GO term being present in our milk
type DEG set.
Keel et al. BMC Genomic Data
(2021) 22:25
Page 13 of 20
Table 6 Twenty-five most significant DET associated with milk type x parity interaction. Significance was ranked using FDR-adjusted
P-value
Transcript
Gene
Gene Description
rna22238
AHCYL1
Adenosylhomocysteinase like 1
rna27866
LOC100621677
Dipeptidase 3 (DPEP3)
MSTRG.208683.14
GRB10
Growth factor receptor bound protein 10
rna14076
POR
P450 (cytochrome) oxidoreductase
rna62377
ANXA7
Annexin A7
rna69234
PCM1
Pericentriolar material 1
MSTRG.337836.10
EXOC4
Exocyst complex component 4
rna62750
ADIRF
Adipogenesis regulatory factor
rna69254
PCM1
Pericentriolar material 1
rna16978
EHBP1
EH domain binding protein 1
MSTRG.114444.62
LMNTD1
Lamin tail domain containing 1
rna31913
PTP4A2
Protein tyrosine phosphatase 4A2
MSTRG.329474.6
RRBP1
Ribosomal binding protein 1
MSTRG.86648.4
PUF60
Poly(U) binding splicing factor 60
rna56801
WWTR1
WW domain containing transcription regulator 1
MSTRG.253426.1
SELENOT
Selenoprotein T
MSTRG.40523.3
PDCL
Phosducin like
rna50113
GPS1
G protein pathway suppressor 1
MSTRG.341587.6
SCRN1
Secernin 1
rna77208
EIF5
Eukaryotic translation initiation factor 5
MSTRG.290003.24
GPAM
Glycerol-3-phosphate acyltransferase, mitochondrial
MSTRG.266678.8
NRIP1
Nuclear receptor interacting protein 1
MSTRG.118470.4
TXNRD1
Thioredoxin reductase 1
MSTRG.373117.37
LOC102158401
Collagen alpha-1(l) chain-like
MSTRG.221153.6
STARD13
StAR related lipid transfer domain containing 13
The JAK-STAT pathway regulates lactation [59]. The
main gene families in the pathway are Janus kinases (JAK)
and the signal transducers and activators of transcription
proteins (STAT). Members of the JAK family, JAK1, JAK2,
JAK3, and TYK2, have been linked to cytoplasmic domains of diverse cytokine receptors [60], while members
of the STAT family, STAT1–4, STAT5A, STAT5B, and
STAT6, are involved in cell growth, differentiation, apoptosis, and mammary gland development. Members of both
families have been associated with bovine milk production
[61]. JAK3 was significantly differentially expressed for the
milk type main effect, with increased expression in colostrum, while JAK2 was statistically significant but was filtered out of our DEG list due to thresholding on log-fold
change (log2 fold change = 1.3). A single nucleotide polymorphism (SNP) in the JAK2 gene has previously been associated with milk, protein, and fat yields in bovine milk
production [62].
Twenty-six genes from the PI3K-Akt pathway, which
lies within the JAK-STAT pathway, were found to be
differentially expressed. The PI3K-Akt pathway is important for the synthesis of lactose and lipids, as well as glucose transport [63]. Although not statistically significant
after FDR-correction, this pathway had a nominal P-value
of 0.029 in the enrichment analysis. The PI3K-Akt pathway is a key signaling node for lactogenic expansion and
differentiation of the luminal mammary epithelium, as numerous signaling pathways that regulate lactogenic development converge on PI3K-Akt, including the insulin-like
growth factor 1 receptor (IGF1R), RANKL and RANK,
integrins, and PRLR-to-JAK2-to-STAT5A pathways [64].
In general, expression of DEG in the PI3K-Akt pathway
was up-regulated in colostrum (Fig. 10). The PI3K-Akt
pathway was also identified as major pathway enriched in
human and bovine colostrum [65].
Several GO terms related to immune response, particularly leukocyte differentiation, leukocyte migration,
regulation of immune system process, and humoral immune system process, were significantly enriched in the
DEG for the milk type main effect (Tables S11 and S12).
Keel et al. BMC Genomic Data
(2021) 22:25
Page 14 of 20
Fig. 10 Log2 fold change (mature milk vs. colostrum) of milk type main effect DEG in the PI3K-AKT signaling pathway. Image was produced by
the iPathwayGuide software (Advaita Bio, />
Nearly all of the DEG associated with these GO terms
were up-regulated in colostrum. This finding is consistent with the immunoglobulins and immune cells being
transferred to the neonate via colostrum [66]. In pigs,
the epitheliochorial nature of the placenta prohibits
transfer of maternal immune cells and immunoglobulins
to the fetus, and thus, the piglet relies on the successful
absorption of colostral components to acquire maternal
immunity [67]. Proinflammatory cytokines play an important role in the development of the neonatal immune
system by mediating the early local and systemic responses to microbial challenges [68]. A total of 16 DEG
were associated with cytokine secretion, including interleukin 21 receptor (IL21R), interleukin 27 receptor A
(IL27RA), and tumor necrosis receptor superfamily
members 1B (TNFRSF1B). Several other genes in these
gene families were shown to be up-regulated in early
porcine lactation by Palombo et al. [20]. This was consistent was our findings as all cytokine secretion genes
except CD36, CIDEA, F2RL1, TLR6, and BTN1A1 were
up-regulated in colostrum (Table S12).
Antimicrobial proteins naturally present in colostrum
and milk can kill and inhibit a broad spectrum of bacteria [69]. Milk is also known to exert chemotactic activity on neutrophils [70], an important innate host defense
against microorganisms. The chemokine superfamily encodes secreted proteins involved in immunoregulatory
and inflammatory processes. The CXC chemokine ligand
14 (CXCL14), which encodes a chemokine antimicrobial
protein [71], was up-regulated in colostrum samples
(Fig. 11). Many of the other main chemokines (CXCL2,
CXCL8, CXCL9, CXCL10, CXCL11, CXCL13, CXC14,
and CXCL16) were expressed in our samples. Interleukin
8/CXC ligand (CXCL8) was the most highly expressed
chemokine across our samples. It has also been reported
to be highly expressed in human milk [72–74]. In human milk, the expression of CXCL8 was highest in the
immediate postpartum period and decreased over the
Fig. 11 Average gene expression values of genes in chemokine superfamily (CXC)
Keel et al. BMC Genomic Data
(2021) 22:25
first week of lactation [74]. A similar pattern was observed in our samples, with markedly higher expression
of CXCL8 in colostrum compared to mature milk across
all parities. The second highest expressed chemokine in
our samples was growth-related oncoprotein beta
(CXCL2). In parity 1 and parity 3 samples, expression of
CXCL2 was higher in mature milk samples (P = 0.0023
for P1 and P = 0.0160 for P3; paired T-test). Though not
statistically significant, the average expression values for
CXCL2 were also higher in mature milk in parities 2
and 4. Although expression of CXCL2 was found to be
high in human milk samples, it did not change with time
postpartum [74]. In bovine milk samples, it was reported
that compared to other chemokines, concentrations of
CXCL2 are generally low and decrease sharply after the
onset of lactation [70]. Palombo et al. [20] identified significant up-regulation of CXCL2 and CXCL10 in day 1
postpartum swine mammary gland samples compared to
mammary samples taken before parturition. We found
that both CXCL2 and CXCL10 increased in expression
with time postpartum. Our results differed from the results in [20] in that CXCL8 was the most abundantly
expressed chemokine in our colostrum and mature milk
samples, and CXCL3 was not expressed. One factor contributing to this discrepancy was the use of the improved
reference genome (Sscrofa 11.1), where many of the gaps
and misassemblies present in the Sscrofa 10.2 genome
build were resolved and the annotation was significantly
improved. These results suggest that chemokine ligands
may play an important role in the transition from colostrum to mature milk in swine, likely helping prompt recruitment of neutrophils.
Conclusions
Porcine milk and colostrum are complex biofluids that
nourish the neonate and protect it from pathogens and
disease. Recent research has shown that in addition to
the major nutrient components, such as carbohydrates,
lipids, and proteins, other bioactive components, including but not limited to exosomes, oligosaccharides, and
bacteria, are present in porcine milk. Understanding
both the nutritional and non-nutritional components of
porcine milk is essential for improved pig production.
Some vital questions that need to be addressed are: 1)
What is the sow’s genetic contribution to milk composition? 2) What bacteria are present in the mammary
gland, milk, and piglet gut, and what is the source of
these bacteria? 3) Do different milk oligosaccharide profiles contribute to the microbiome and immunity in the
piglet GI tract? This study is a subset of a larger study
aimed at addressing these questions. Our findings have
produced several highly specialized and functional candidate genes that may contribute to postnatal development
and growth of piglets, as well as lactation in the sow. A
Page 15 of 20
deeper understanding of these genes could provide a coherent approach to genetically regulate milk composition
in the future.
Methods
Population and sampling
A four-breed composite line (Maternal Landrace ×
High-lean Landrace × Duroc × Yorkshire) maintained at
the U.S. Meat Animal Research Center (USMARC) for
at least 18 generations was used for the collection of
data in this project and has been previously described
[75, 76]. Litter sizes were adjusted within 48 h of farrowing to ensure litters were approximately equal in size but
did not exceed the number of functional teats. Mammary excretion samples were collected on day of farrowing (d 0; colostrum) and again on day 10 post-farrowing
(d 10; mature milk) from a total of 65 dams, 16 first parity (P1), 25 s parity (P2), 15 third parity (P3), and 9
fourth parity (P4). The power calculation for this experiment was conducted using the online RNASeqSampleSize tool ([77]; />RnaSeqSampleSize/). The power of using 65 animals to
detect ~ 1000 DEG, with maximum dispersion 0.5 and
minimum fold change of 2.82, at FDR level 0.05 from
17,740 expressed genes was found to be 0.99. After sample collection, animals remained at USMARC and progressed through the breeding system according to
standard operating procedures.
In most cases, no external stimulant (i.e., oxytocin)
was needed to collect colostrum at time of farrowing, as
farrowing stimulates endogenous oxytocin production
and milk letdown activity. However, if enough colostrum
could not be collected within 10–30 min, an intramuscular injection of oxytocin (20 IU) was administered to
stimulate colostrum letdown. Teats were sprayed with
iodine (5%) and ethanol (70%) and wiped clean with a
chem-wipe, and then 10 mL of colostrum was collected
manually from the third and fourth teat on one side of
the sow. On d 10, piglets were separated from the sow
for approximately 1 h, and sows were given an intramuscular injection of 20 IU oxytocin to stimulate milk letdown. Teats were cleaned, and 10 mL of milk was
collected manually from the third and fourth teat on one
side of the sow. Fresh samples were transported to the
laboratory on ice. Samples (250 μL) were aliquoted into
individual lysis D matrix tubes (MP Biomedicals, LLC,
Solon, OH) with 1 mL TRIzol reagent (Invitrogen,
Thermo Fisher Scientific, Waltham, MA) and stored at
− 80 °C until RNA isolation.
RNA isolation and sequencing
RNA was isolated using the FastPrep-24 5G Instrument
(MP Biomedicals, LLC) with cryogenic lysis. Briefly,
RNA was isolated by high-speed cellular disruption
Keel et al. BMC Genomic Data
(2021) 22:25
using multi-directional, simultaneous bead beating of
sample material (i.e., colostrum or milk) with a cool
adapter for cryogenic lysis at 6.0 m/sec for 40 s. Lysed
samples were transferred into a clean tube, and completion of isolation occurred following manufacturer’s recommended protocol for TRIzol. The final RNA pellet
was dried at RT for 10 min and resuspended in 30 μL
water (Invitrogen UltraPure DNase/RNase-free, Thermo
Fisher Scientific). RNA was quantified using a NanoDrop
UV-Vis spectrophotometer (Thermo Fisher Scientific)
and RNA integrity was assessed using an Agilent Bioanalyzer System (Agilent, Santa Clara, CA).
Total RNA samples extracted from colostrum or milk
were prepared for RNA sequencing with the TruSeq
Stranded Total RNA with Ribo-Zero Gold sample preparation kit (Illumina, San Diego, CA) following the
guidelines of the manufacturer. Libraries were quantified
with RT-qPCR using the NEBNext Library Quant Kit
(New England Biolabs, Inc., Beverly, MA, USA) on a
CFX384 thermal cycler (Bio-Rad, Hercules, CA, USA),
and the size and quality of the library was evaluated with
an Agilent Bioanalyzer DNA 1000 kit (Santa Clara, CA,
USA). The libraries were diluted to 4 nM with Illumina
RSB. Libraries were paired-end sequenced with 150 cycle
high output sequencing kits on an Illumina NextSeq 500
instrument.
Processing RNA-Seq data
Alignment of RNA-Seq reads was carried out as follows.
First, quality of the raw paired-end sequence reads in individual fastq files was assessed using FastQC (Version
0.11.5; www.bioinformatics.babraham.ac.uk/projects/
fastqc), and reads were trimmed to remove adapter sequences and low-quality bases using the Trimmomatic
software (Version 0.35) [78]. The remaining reads were
mapped to the Sscrofa 11.1 genome assembly (NCBI accession AEMK00000000.2) using Hisat2 (Version 2.1.0)
[79] with default parameters.
Mapped transcripts were assembled for each library
using Stringtie (Version 1.3.3) [80]. The NCBI Sscrofa
11.1 reference annotation (Release 106) was used to
guide the assembly process. Transcripts from all samples
were merged using Stringtie merge mode to build a consensus set of transcripts.
Identification and characterization of novel transcripts
Transcript expression levels were quantified for each
library using fragments per kilobase of exon per
million mapped reads (FPKM) [81]. Transcripts
expressed in a single sample, and transcripts with
FPKM < 0.3 in all samples were removed. Gffcompare
(Version 0.11.2) [82] was used to compare the list of
assembled transcripts with the S. scrofa reference annotation (NCBI Release 106). Transcripts overlapping
Page 16 of 20
known transcript classes in the reference annotation
(gffcompare class code ‘=’) were assigned to the appropriate annotation class, while transcripts with
gffcompare class codes ‘x’ (exonic overlap on the opposite strand), ‘i’ (fully contained in reference intron),
‘j’ (multi-exon with at least one junction match), and
‘u’ (unknown, intergenic) were considered to be potential novel transcripts.
A modified version of the discovery pipeline described
in Cai et al. [83] was used to further filter transcripts
and classify novel transcripts (Fig. 2): (i) Filter out transcripts with short lengths (< 200 bp) and single exons;
(ii) ORF obtained using TransDecoder (Version 5.5.0;
/>Transcripts with no predicted ORF were filtered out,
and transcripts ORF length ≥ 120 amino acids were considered protein-coding. (iii) Protein coding potential
assessed using CPC2 (Version 2.0) [84], PLEK (Version
1.2) [85], and CNIT [86]; (iv) Transcripts were translated
to amino acid sequences using the Transeq utility from
EMBOSS ( />transeq/), and HMMER [87] was used to search for
known protein domains against the Pfam database (Release 33.1) [88]. Transcripts with significant Pfam hits
(E-value < 10.0) were classified as protein-coding. After
steps (iii) and (iv), transcripts with no significant Pfam
hits, CPC2 classification “coding”, PLEK score > 0, and
CNIT > 0 were classified as protein-coding, and transcripts with no significant Pfam hits, CPC2 classification
“noncoding”, PLEK score < 0, and CNIT score < 0 were
classified as non-coding. All other transcripts were discarded, as their coding potential was ambiguous.
The BLASTN algorithm from the BLAST+ package
[89] was used to identify homology between (1) novel
lncRNA and the NONCODE database (Version 5) and
(2) novel mRNA and the NCBI Non-redundant Nucleotide database (nt; Version 5, />blast/db/). BLASTN was run with default parameters,
and an E-value cutoff of 10.0 was used to define homologous sequences.
Differential expression and functional analyses
Raw read counts for the 70,841 transcripts and the
17,910 corresponding genes were normalized using
DESeq2 (Version 1.26) [90]. Gene expression distributions were computed for colostrum and mature milk
samples by averaging the normalized expression values
across samples. The PCA plot, using variance stabilizing
transform of normalized read counts, was generated
using the plotPCA function from the DESeq2 package.
Differential expression analysis of transcripts was performed using DESeq2 with the following generalized linear model:
Keel et al. BMC Genomic Data
(2021) 22:25
Y ẳ Type ỵ Parity ỵ Type x Parity:
Transcripts with FDR-adjusted P-value 0.01 were
considered DET for the type x parity interaction. Transcripts that were not DET for the interaction term with
FDR-adjusted P-value ≤0.01 were considered DET for
the parity main effect. Transcripts that were not DET
for the interaction term with |log2 fold change| ≥ 2 and
FDR-adjusted P-value ≤0.01 were considered DET for
the milk type main effect.
Transcript P-values were aggregated for each gene
using the Lancaster method [91] to generate gene-level
analysis. This approach has been described in detail by
Yi et al. [55]. Briefly, the Lancaster method is an extension of the Fisher method [92] for P-value aggregation,
where under the null hypothesis that all genes have zero
P
effect, the test statistic T ẳ Kiẳ1 1
w pi ị follows a chiPK i
squared distribution with df ¼ i¼1 wi . Here, K denotes
the number of transcripts associated with the gene, w1,
…, wK a set of weights for the transcript P-values p1, …
pK, and ϕ −1
wi the inverse CDF of the gamma distribution
with shape parameter αi ¼ w2i and scale parameter β = 2.
Here, the baseMean parameter from the DESeq2 output
was used as wi in the Lancaster method. Aggregated Pvalues were corrected using the Benjamini-Hochberg
method. Genes with FDR-adjusted P-value ≤0.01 were
considered DEG. DEG for the milk type x parity interaction were removed from the milk type main effect
DEG set. Log2-fold changes (log2FC; mature milk vs.
colostrum) were computed for each of the genes using
DESeq2, and genes with |log2FC| ≤ 1.5 were filtered out
of the milk type main effect DEG set.
Enrichment analysis of gene function and cellular
pathways was performed for DEG using the iPathwayGuide software (Version 2012; Advaita Bio, http://
advaitabio.com/ipathwayguide) with the default M. musculus data as background. For GO analysis, an overrepresentation test, based on a hypergeometric distribution, was used to compute the statistical significance of
observing more than the expected number of DEG. A
GO term was considered statistically significant at FDRcorrected P ≤ 0.05. Pathway over-representation analysis
was performed by comparing the number of affected
genes associated with a pathway between groups. Pathways were considered statistically significant at FDRcorrected P ≤ 0.05.
Abbreviations
IgG: Immunoglobin; RNA: Ribonucleic acid; NGS: Next-generation
sequencing; MEC: Milk epithelial cells; lncRNA: Long non-coding RNA;
bp: Base pairs; RNA-Seq: RNA-sequencing; DEG: Differentially expressed gene;
mRNA: Messenger RNA; miRNA: Micro RNA; miscRNA: Miscellaneous small
non-coding RNA; circRNA: Circular RNA; ncRNA: Non-coding RNA; ORF: Open
reading frame; lincRNA: Long intergenic non-coding RNA; ilncRNA: Identified
unknown long non-coding RNA; lncNAT: Long non-coding natural antisense
transcripts; isolncRNA: Novel isoform non-coding RNA; SNP: Single nucleotide
Page 17 of 20
polymorphism; PCA: Principal component analysis; DET: Differentially
expressed transcript; GO: Gene ontology; USMARC: U.S. Meat Animal
Research Center; NCBI: National Center for Biotechnology Information;
SRA: Sequence Read Archive; FPKM: Fragment per kilobase of exon per
million mapped reads
Supplementary Information
The online version contains supplementary material available at https://doi.
org/10.1186/s12863-021-00980-5.
Additional file 1: Table S1. Sequencing statistics. Number of raw
sequence reads, number of reads mapping to the S. scrofa 11.1 genome
assembly, and percentage of mapped reads for each of the sequenced
libraries.
Additional file 2: Table S2. Summary of reads mapping to RNA
regions of the swine genome. Number of raw sequence reads mapping
to annotated RNA regions in the S. scrofa 11.1 genome assembly. RNA
classifications are based on the NCBI S. scrofa annotation (Release 106).
Additional file 3: Table S3. Novel lncRNA annotation. Annotation is
given in GTF format. LincRNA denotes intergenic lncRNA, ilncRNA
denotes intronic RNA, lncNAT denotes natural antisense lncRNA, and
isolncRNA denotes novel isoform lncRNA.
Additional file 4: Table S4. Novel mRNA annotation. Annotation is
given in GTF format.
Additional file 5: Table S5. BLAST search results for novel lncRNA
against NONCODE databases. BLAST hits for novel lncRNA searched
against NONCODE databases for multiple species. Entries in the species
column indicate the top BLAST hit for the transcript in the given species.
Additional file 6: Table S6. Analysis of differentially expressed
transcripts (DET) for the milk type x parity interaction. DET are
highlighted in blue.
Additional file 7: Table S7. Analysis of differentially expressed
transcripts (DET) for the milk type main effect. DET are highlighted in
blue. Transcripts colored gray were filtered out for being significant for
the milk type x parity interaction or for having |log2 fold change| < 2.
Log2 fold change is for milk vs. colostrum comparison.
Additional file 8: Table S8. Analysis of differentially expressed
transcripts (DET) for the parity main effect. DET are highlighted in blue.
Transcripts colored gray were filtered out for being significant for the
milk type x parity interaction.
Additional file 9: Table S9. Analysis of differentially expressed genes
(DEG) for the milk type x parity interaction. DEG are highlighted in blue.
Additional file 10: Table S10. Analysis of differentially expressed genes
(DEG) for the milk type main effect. DEG are highlighted in blue. Genes
colored gray were filtered out for being significant for the milk type x
parity interaction or for having |log2 fold change| < 2. Log2 fold change
is for milk vs. colostrum comparison.
Additional file 11: Table S11. Gene ontology (GO) term and pathway
analysis for the milk type main effect. Biological process (BP), molecular
function (MF), cellular component (CC), and KEGG pathway results are
shown in separate tabs.
Additional file 12: Table S12. Milk type DEG associated with various
immune response GO terms. GO terms are given in separate tabs. DEG
associated with the GO term and their log2 fold changes (milk vs
colostrum) are shown.
Additional file 13: Figure S1. Number of transcripts falling into each
Gffcompare class code based on the NCBI S. scrofa 11.1 reference
annotation. For class code definitions see />stringtie/gffcompare.shtml
Acknowledgements
The authors wish to acknowledge Shanda Watts for her outstanding
technical and laboratory assistance; the USMARC Core Laboratory for
performing the sequencing; Heather Oeltjen-Bruns and Miguel Cervantes for
Keel et al. BMC Genomic Data
(2021) 22:25
their assistance with sample collection; Mike Judy for assistance with data
organization; and the USMARC Swine Operations crew.
Authors’ contributions
BNK, LAR, WTO, and JEW conceived of the study and participated in its
design and coordination. All authors were involved in the acquisition of data,
and BNK performed data analyses. BNK drafted the manuscript, and ALP,
WTO, SAJ, JEW, and LAR contributed to the writing and editing. All authors
read and approved the final manuscript.
Funding
Not applicable.
Availability of data and materials
Sequence data used in this study was submitted to the National Center for
Biotechnology Information Sequence Read Archive (NCBI SRA) with
Accession Number PRJNA640341.
Declarations
Ethics approval and consent to participate
The U.S. Meat Animal Research Center Animal Care and Use Committee
reviewed and approved all animal procedures (Experimental Outline #100.0).
The procedures for handling pigs complied with the Guide for the Care and
Use of Agricultural Animals in Agricultural Research and Teaching [93].
Consent for publication
Not applicable.
Competing interests
The authors declare that they have no competing interests.
Received: 19 July 2021 Accepted: 29 July 2021
References
1. Theil PK, Lauridsen C, Quesnel H. Neonatal piglet survival: impact of sow
nutrition around parturition on fetal glycogen deposition and production
and composition of colostrum and transient milk. Animal. 2014;8(7):1021–
30. />2. Langer P. Differences in the composition of colostrum and milk in
eutherians reflect differences in immunoglobulin transfer. J Mammal. 2009;
90(2):332–9. />3. Quesnel H, Farmer C, Theil PK. Colostrum and milk production. Chapter 8.
In: Farmer C, editor. The gestating and lactating sow. Wageningen:
Wageningen Academic Publishers; 2015.
4. Carney-Hinkle EE, Tran H, Bundy JW, Moreno R, Miller PS, Burkey TE. Effect of
dam parity on litter performance, transfer of passive immunity, and progeny
microbial ecology. J Anim Sci. 2013;91(6):2885–93. />s.2011-4874.
5. Craig JR, Collins CL, Bunter KL, Cottrell JJ, Dunshea FR, Pluske JR. Poorer lifetime
growth performance in gilt progeny compared with sow progeny is largely
due to weight differences at birth and reduced growth in the preweaning
period, and is not improved by progeny segregation after weaning. J Anim Sci.
2017;95(11):4904–16. />6. Craig JR, Dunshea FR, Cottrell JJ, Wijesiriwardana UA, Pluske JR. Primiparous
and multiparous sows have largely similar colostrum and milk composition
profiles throughout lactation. Animals (Basel). 2019;9(2):35.
7. Boutinard M, Jammes H. Potential uses of milk epithelial cells:a review.
Reprod Nutr Dev. 2002;42(2):133–47. />8. Weber JA, Baxter DH, Zhang S, Huang DY, Huang KH, Lee MJ, et al. The
MicroRNA spectrum in 12 body fluids. Clin Chem. 2010;56(11):1733–41.
/>9. Golan-Gerstl R, Shiff YE, Moshayoff V, Schecter D, Leshkowitz D, Reif S.
Characterization and biological function of milk-derived miRNAs. Mol Nutr
Food Res. 2017;61(10):1700009. />10. Lemay DG, Ballard OA, Hughes MA, Morrow AL, Horseman ND, NommsenRivers L. RNA sequencing of the human milk fat layer transcriptome reveals
distinct gene expression profiles at three stages of lactation. PLoS One.
2013a;8(7):e67531. />
Page 18 of 20
11. Zeng B, Chen T, Xie MY, Luo JY, He JJ, Xi QY, et al. Exploration of long
noncoding RNA in bovine milk exosomes and their stability during
digestion in vitro. J Dairy Sci. 2019;102(8):6726–37. />jds.2019-16257.
12. Zeng B, Chen T, Luo J, Xie M, Wei M, Xi Q, et al. Exploration of long
noncoding RNAs and circular RNAs in porcine milk exosomes. Front Genet.
2020;11:652. />13. Harmon B. Somatic cell counts: a primer. Annual Meeting-National Mastitis
Council Incorporated, National Mastitis Council, vol. 40; 2001.
14. de la Torre GC, Goreham RV, Bech Serra JJ, Nann T, Kussman M. “Exosomics”
– a review of biophysics, biology and biochemistry of exosomes with focus
on human breast milk. Front Genet. 2018;9:92.
15. Chen T, Xie M, Sun J, Ye R, Cheng X, Sun R, et al. Porcine milk-derived
exosomes promote proliferation of intestinal epithelial cells. Nat Sci Rep.
2016;6(1):33862. />16. Izumi H, Kosaka N, Shimizu T, Sekine K, Ochiya T, Takase M. Bovine milk
contains microRNA and messenger RNA that are stable under degradative
conditions. J Dairy Sci. 2012;95(9):4831–41. />17. Rani P, Yenuganti VR, Shandilya S, Onteru SK, Singh D. miRNAs: the hidden
bioactive component of milk. Trends food Sci. Technol. 2017;65:94–102.
18. Izumi H, Tsuda M, Sato Y, Kosaka N, Ochiya T, Iwamoto H, et al. Bovine milk
exosomes contain microRNA and mRNA and are taken up by human
macrophages. J Dairy Sci. 2015;98(5):2920–33. />014-9076.
19. Zhao W, Shahzad K, Jiang M, Graugnard DE, Rodriguez-Zas SL, Luo J, et al.
Bioinformatics and gene network analyses of the swine mammary gland
transcriptome during late gestation. Bioinform Biol Insights. 2013;7:193–216.
/>20. Palombo V, Loor JJ, D’Andrea M, Vailati-Riboni M, Shahzad K, Krogh U, et al.
Transcriptional profiling of swine mammary gland during the transition
from colostrogenesis to lactogenesis using RNA sequencing. BMC
Genomics. 2018;19(1):322. />21. Wickramasinghe S, Hua S, Rincon G, Islas-Trejo A, German JB, Lebrilla CB,
et al. Transcriptome profiling of bovine milk oligosaccharide metabolism
genes using RNA-sequencing. PLoS One. 2011;6(4):e18895. />0.1371/journal.pone.0018895.
22. Medrano JF, Rincon G, Islas-Trejo A. Comparative analysis of bovine milk
and mammary gland transcriptome using RNA-Seq, In 9th world congress
in genetics applied to livestock production, Leipzig, Germany; 2010. p. 852.
23. Wickramasinghe S, Rincon G, Islas-Trejo A, Medrano JF. Transcriptional
profiling of bovine milk using RNA sequencing. BMC Genomics. 2012;13(1):
45. />24. Crisà A, Ferrè F, Chillemi G, Moioli B. RNA-sequencing for profiling goat milk
transcriptome in colostrum and mature milk. BMC Vet Res. 2016;12(1):264.
/>25. Suárez-Vega A, Gutiérrez-Gil B, Klopp C, Robert-Granie C, Tosser-Klopp G,
Arranz JJ. Characterization and comparative analysis of the milk
transcriptome in two dairy sheep breeds using RNA sequencing. Nat Sci
Rep. 2015;5:18399.
26. Arora R, Sharma A, Sharma U, Girdhar Y, Kaur M, Kapoor P, et al. Buffalo milk
transcriptome: a comparative analysis of early, mid and late lactation. Nat
Sci Rep. 2019;9(1):5993. />27. Lemay DG, Hovey RC, Hartono SR, Hinde K, Smilowitz JT, Ventimiglia F, et al.
Sequencing the transcriptome of milk production: milk trumps mammary
tissue. BMC Genomics. 2013b;14(1):872. />64-14-872.
28. Wang Y, Li D, Wang Y, Li M, Fang X, Chen H, et al. The landscape of circular
RNAs and mRNAs in bovine milk exosomes. J Food Comp Anal. 2019;76:33–
8. />29. Chen T, Xi Q, Sun J, Ye R, Cheng X, Sun R, et al. Revelation of mRNAs and
proteins in porcine milk exosomes by transcriptomic and proteomic
analysis. BMC Vet Res. 2017;13(1):101. />021-8.
30. Witkowska-Zimny M, Kaminska-El-Hassan E. Cells of human breast milk. Cell
Mol Biol. 2017;22:11.
31. Zlotnik I. Types of cells present in cow’s milk. J Comp Pathol Ther. 1947;57:
196–208. />32. Zhang S, Chen F, Zhang Y, Lv Y, Heng J, Min T, et al. Recent progress of
porcine milk components and mammary gland function. J Ani Sci Biotech.
2018;9(1):77. />
Keel et al. BMC Genomic Data
(2021) 22:25
33. Alsaweed M, Hepworth AR, Lefèvre C, Hartmann PE, Geddes DT, Hassiotou
F. Human milk microRNA and total RNA differ depending on milk
fractionation. J Cell Biochem. 2015;116(10):2397–407. />002/jcb.25207.
34. Li R, Dudemaine PL, Zhao X, Lei C, Ibeagha-Awemu EM. Comparative
analysis of the miRNome of bovine milk fat, whey and cells. PLoS One.
2016;11(4):e0154129. />35. Huston GE, Patton S. Factors related to the formation of cytoplasmic
crescents on milk fat globules. J Dairy Sci. 1990;73(8):2061–6. https://doi.
org/10.3168/jds.S0022-0302(90)78885-6.
36. Munch EM, Harris RA, Mohammad M, Benham AL, Pejerrey SM, Showalter L,
et al. Transcriptome profiling of microRNA by next-gen deep sequencing
reveals known and novel miRNA species in the lipid fraction of human
breast milk. PLoS One. 2013;8(2):e50564. />pone.0050564.
37. Mortazavi A, Williams BA, Mccue K, Schaeffer L, Wold B. Mapping and
quantifying mammalian transcriptomes by RNA-Seq. Nat Methods. 2008;5:1–8.
38. Woliński J, Slupecka-Ziemilska M, Romanowicz K. Leptin and ghrelin levels
in colostrum, milk and blood plasma of sows and pig neonates during the
first week of lactation. Anim Sci J. 2013;85:2.
39. Ilcol YO, Hizli ZB, Ozkan T. Leptin concentration in breat milk and its
relationship to duration of lactational and hormonal status. Int Breastfeed J.
2006;1(1):21. />40. Pinotti L, Rosi F. Leptin in bovine colostrum and milk. Horm Metab Res.
2006;38(2):89–93. />41. Li S, Zhang L, Zhou Q, Jiang S, Yang Y, Cao Y. Characterization of stem cells
and immune cells in preterm and term mother’s milk. J Hum Lact. 2019;
35(3):528–34. />42. Canovas A, Rincon G, Bevilacqua C, Islas-Trejo A, Brenaut P, Hovey RC, et al.
Comparison of five different RNA sources to examine the lactating bovine
mammary gland transcriptome using RNA-sequencing. Nat Sci Rep. 2014;4:
5297.
43. Su Z, Dong X, Zhang B, Zeng Y, Fu Y, Yu J, et al. Gene expression profiling
in porcine mammary gland during lactation and identification of breedand developmental-stage-specific genes. Sci China Series C. 2006;49(1):26–
36. />44. Cordero G, Isabel B, Morales J, Menoyo D, Piñero C, Daza A, et al.
Conjugated linoleic acid (CLA) during last week of gestation and lactation
alters colostrum and milk fat composition and performance of reproductive
sows. Anim Feed Sci Tech. 2011;168(3-4):232–40. />nifeedsci.2011.04.085.
45. Bionaz M, Loor JJ. ACSL1, AGPAT6, FABP3, LPIN1, and SLC27A6 are the most
abundant isoforms in bovine mammary tissue and their expression is
affected by stage of lactation. J Nutr. 2008a;139:1019–24.
46. Suburu J, Shi L, Wu JJ, Wang S, Samuel M, Thomas MK, et al. Fatty acid
synthase is required for mammary gland development and milk production
during lactation. Am Physiol-Endoc M. 2014;306:E1132–43.
47. Tansey JT, Sztalryd C, Hlavin EM, Kimmel AR, Londos C. The central role of
perilipin a in lipid metabolism and adipocyte lipolysis. IUBMB Life. 2004;
56(7):379–85. />48. Martel PM, Bingham CM, McGraw CJ, Baker CL, Morganelli PM, Meng ML,
et al. S14 protein in breast cancer cells by SREBP-1c, superinduction with
progestin, and effects on cell growth. Exp Cell Res. 2006;312:278–88.
49. Yao DW, Luo J, He QY, Wu M, Shi HB, Wang H, et al. Thyroid hormone
responsive (THRSP) promotes the synthesis of medium-chain fatty acids in
goat mammary epithelial cells. J Dairy Sci. 2016;99(4):3124–33. https://doi.
org/10.3168/jds.2015-10632.
50. Bionaz M, Loor JJ. Gene networks driving bovine milk fat synthesis during
the lactation cycle. BMC Genomics. 2008b;9(1):366. />86/1471-2164-9-366.
51. Klobasa F, Werhahn E, Butler JE. Composition of sow milk during lactation. J
Anim Sci. 1987;64(5):1458–66. />52. Jensen PT, Pedersen KB. Studies on immunoglobulins and trypsin inhibitor
in colostrum and milk from sows and serum in their piglets. Acta Vet Scand.
1979;20(1):60–72. />53. Dawson HD, Loveland JE, Pascal G, Gilbert JGR, Uenishi H, Mann KM, et al.
Structural and functional annotation of the porcine immunome. BMC
Genomics. 2013;14(1):332. />54. Twigger AJ, Küffer GK, Geddes DT. Filgueria L. Nutrients. 2018;10(9):1230.
/>
Page 19 of 20
55. Yi L, Pimentel H, Bray NL, Pachter L. Gene-level differential analysis at
transcript-level resolution. Genome Biol. 2018;19(1):53. />86/s13059-018-1419-z.
56. Zhao FQ. Biology of glucose transport in the mammary gland. J Mammary
Gland Biol Neoplasia. 2014;19(1):3–17. />57. Ishida N. Kawakita. Molecular physiology and pathology of the nucleotide
sugar transporter family (SLC35). Eur J Phys. 2004;447(5):768–75. https://doi.
org/10.1007/s00424-003-1093-0.
58. Song Z. Roles of the nucleotide sugar transporters (SLC35 family) in health
and disease. Mol Asp Med. 2013;34(2–3):590–600. />mam.2012.12.004.
59. Bionaz M, Loor JJ. Gene networks driving bovine mammary protein
synthesis during the lactation cycle. Bioinfom Biol Insights. 2011;5:83–98.
60. Liongue C, Ward AC. Evolution of the JAK-STAT pathway. JAKSTAT. 2013;2:
e22756.
61. Khan MZ, Khan A, Xiao J, Ma Y, Ma J, Gao J, et al. Rols of JAK-STAT pathway
in bovine mastitis and milk production. Animals (Basel). 2020;10(11):2107.
62. Szewczuk M. Association of a genetic marker at the bovine Janus kinase 2
locus (JAK2/RsaI) with milk production traits in four cattle breeds. J Dairy
Res. 2015;82(3):287–92. />63. Oliver CH, Watson CJ. Making milk. JAKSTAT. 2013;2:2.
64. Williams MM, Vaught DB, Joly MM, Hicks DJ, Sanchez V, Owens P, et al.
ErbB3 drives mammary epithelial survival and differentiation during
pregnancy and lactation. Breast Cancer Res. 2017;19(1):105. />0.1186/s13058-017-0893-7.
65. Cao X, Zheng Y, Wu S, Yang N, Wu J, Liu B, et al. Characterization and
comparison of milk fat globule membrane glycoproteomes from human
and bovine colostrum and mature milk. Food Funct. 2019;10(8):5046–58.
/>66. Rooke JA, Bland IM. The acquisition of passive immunity in the newborn
piglet. Livest Prod Sci. 2002;1(28):13–23.
67. Bandrick M, Ariza-Nieto C, Baidoo SK, Molitor TW. Colostral antibodymediated and cell-mediated immunity contributes to innate and antigenspecific immunity in piglets. Dev Comp Immunol. 2014;43(1):114–20. https://
doi.org/10.1016/j.dci.2013.11.005.
68. Nguyen TV, Yuan L, Azevedo MSP, Jeong K, Gonzalez A-M, Saif LJ. Transfer
of maternal cytokines to suckling piglets: in vivo and in vitro models with
implications for immunomodulation of neonatal immunity. Vet Immunol
Immunopathol. 2007;117(3-4):236–48. />02.013.
69. Hurley WL, Theil PK. Perspectives on immunoglobulins in colostrum and
milk. Nutrients. 2011;3(4):442–74. />70. Rainard P, Riollet C, Berthon P, Cunha P, Fromageau A, Rossignol C, et al.
The chemokine CXCL3 is responsible for the constitutive chemotactic
activity of bovine milk for neutrophils. Mol Immunol. 2008;45(15):4020–7.
/>71. Lu J, Chatterjee M, Schmid H, Beck S, Gawaz M. CXCL14 as an emerging
immune and inflammatory modulator. J Inflamm. 2016;13(1):1. https://doi.
org/10.1186/s12950-015-0109-9.
72. Michie CA, Tantscher E, Schall T, Rot A. Physiological secretion of
chemokines in human breast milk. Eur Cytokine Netw. 1998;9(2):123–9.
73. Srivastava MD, Srivastava A, Brouhard B, Saneto R, Groh-Wargo S, Kubit J.
Cytokines in human milk. Res Commun Mol Pathol Pharmacol. 1996;93:263–8.
74. Maheshwari A, Christensen RD, Calhoun DA. ELR+ CXC chemokines in
human milk. Cytokine. 2003;24(3):91–102. />07.002.
75. Rempel LA, Freking BA, Miles JR, Nonneman DJ, Rohrer GA, Schneider JF,
et al. Association of porcine heparanase and hyaluronidase 1 and 2 with
reproductive and production traits in landrace-Duroc-Yorkshire population.
Front Genet. 2011;2:20.
76. Rempel LA, Vallet JL, Lents CA, Nonneman DJ. Measurements of body
composition during late gestation and lactation in first and second parity
sows and its relationship to piglet production and post-weaning
reproductive performance. Livestock Sci. 2015;178:289–95. />0.1016/j.livsci.2015.05.036.
77. Zhao S, Li CI, Guo Y, Sheng Q, Shyr Y. RNASeqSampleSize: real data based sample
size estimation for RNA sequencing. BMC Bioinformatics. 2018;19(1):1–8.
78. Bolger AM, Lohse M, Usadel B. Trimmomatic: a flexible trimmer for Illumina
sequence data. Bioinformatics. 2014;30(15):2114–20. />bioinformatics/btu170.
Keel et al. BMC Genomic Data
(2021) 22:25
79. Kim D, Langmead B, Salzberg SL. HISAT: a fast spliced aligner with low
memory requirements. Nat Meth. 2015;12(4):357–60. />nmeth.3317.
80. Pertea M, Pertea GM, Antonescu CM, Chang TC, Mendell JT, Salzberg SL.
StringTie enables improved reconstruction of a transcriptome from RNA-seq
reads. Nat Biotech. 2015;33(3):290–5. />81. Lee S, Seo CH, Lim B, Yang JO, Oh J, Kim M, et al. Accurate quantification of
transcriptome from RNA-Seq data by effective length normalization. Nucleic
Acids Res. 2011;39(2):e9. />82. Pertea M, Kim D, Pertea G, Leek JT, Salzberg SL. Transcript-level expression
analysis of RNA-seq experiments with HISAT, StringTie, and Ballgown. Nat
Protoc. 2016;11(9):1650–67. />83. Cai W, Li C, Liu S, Zhou C, Yin H, Song J, et al. Genome wide identification
of novel long non-coding RNAs and their potential associations with milk
proteins in Chinese Holstein cattle. Front Genet. 2018;9:281. />0.3389/fgene.2018.00281.
84. Kang YJ, Yang DC, Kong L, Hou M, Meng YQ, Wei L, et al. CPC2: a fast and
accurate potential calculator based on sequence intrinsic features. Nucleic
Acids Res. 2017;45(W1):W12–6. />85. Li A, Zhang J, Zhou Z. PLEK: a tool for predicting long non-coding RNAs
and messenger RNAs based on an improved k-mer scheme. BMC
Bioinformatics. 2014;15(1):311. />86. Guo JC, Fang SS, Wu Y, Zhang JH, Chen Y, Liu J, et al. CNIT: a fast and
accurate web tool for identifying protein-coding and long non-coding
transcripts based on intrinsic sequence composition. Nucleic Acids Res.
2019;47(W1):W516–22. />87. Finn RD, Clements J, Eddy SR. HMMER web server: interactive sequence
similarity searching. Nucleic Acids Res. 2011;39(suppl):W29–37. https://doi.
org/10.1093/nar/gkr367.
88. Finn RD, Coggill P, Eberhardt RY, Eddy SR, Mistry J, Mitchell AL, et al. The
Pfam protein families database: towards a more sustainable future. Nucleic
Acids Res. 2016;44(D1):D279–85. />89. Camacho C, Coulouris G, Avagyan V, Ma N, Papadopoulos J, Bealer K, et al.
BLAST+: architecture and applications. BMC Bioinformatics. 2009;10(1):421.
/>90. Love MI, Huber W, Anders S. Moderated estimation of fold change and
dispersion for RNA-seq data with DESeq2. Genome Biol. 2014;12(12):550.
91. Lancaster H. The combination of probabilities: an application of
orthonormal functions. Austral J Statist. 1961;3:20–33.
92. Fisher RA. Statistical methods for research workers. Edinburgh: Oliver and
Boyd; 1932.
93. McGlone J. Guide for care and use of agricultural animals in agricultural
research and teaching. Savoy: Fed. Animal Science Society; 2010.
Publisher’s Note
Springer Nature remains neutral with regard to jurisdictional claims in
published maps and institutional affiliations.
Page 20 of 20