Association between apolipoprotein gene polymorphisms and hyperlipidemia: A meta-analysis
Bạn đang xem bản rút gọn của tài liệu. Xem và tải ngay bản đầy đủ của tài liệu tại đây (2.42 MB, 19 trang )
BMC Genomic Data
Zhao et al. BMC Genomic Data
(2021) 22:14
/>
RESEARCH ARTICLE
Open Access
Association between apolipoprotein gene
polymorphisms and hyperlipidemia: a
meta-analysis
Xiao-Ning Zhao1†, Quan Sun2†, You-Qin Cao1, Xiao Ran3 and Yu Cao3*
Abstract
Background: Hyperlipidemia plays an important role in the etiology of cardio-cerebrovascular disease. Over recent
years, a number of studies have explored the impact of apolipoprotein genetic polymorphisms in hyperlipidemia,
but considerable differences and uncertainty have been found in their association with different populations from
different regions.
Results: A total of 59 articles were included, containing in total 13,843 hyperlipidemia patients in the case group
and 15,398 healthy controls in the control group. Meta-analysis of the data indicated that APOA5–1131 T > C,
APOA1 -75 bp, APOB XbaI, and APOE gene polymorphisms were significantly associated with hyperlipidemia, with
OR values of 1.996, 1.228, 1.444, and 1.710, respectively. All P-values were less than 0.05.
Conclusions: Meta-analysis of the data indicated that the C allele of APOA5 1131 T > C, the A allele at APOA1-75 bp,
the APOB XbaI T allele, and the ε2 and ε4 allele of APOE were each a risk factor for susceptibility for hyperlipidemia.
Keywords: Apolipoprotein, APO, Gene polymorphism, Hyperlipidemia, Meta-analysis
Background
Cardio-cerebrovascular disease is the leading cause of
increased human mortality, globally [1]. Recently,
studies have shown that the fatality rate from cardiocerebrovascular disease accounts for approximately
30% of the total global death toll [2]. Hyperlipidemia
is a chronic non-communicable disease caused by an
imbalance in the structure of plasma lipids caused by
a fat metabolism disorder [3]. It is the primary risk
factor for atherosclerosis and the pathological basis
for cardio-cerebrovascular disease [4]. In addition, a
large number of manuscripts have demonstrated that
hyperlipidemia is a pathogenic factor of digestive and
urinary diseases such as diabetes, hepatopathy, and pancreatitis. Hyperlipidemia can be categorized as
* Correspondence:
†
Xiao-Ning Zhao and Quan Sun contributed equally to this work.
3
School of Health, Guizhou Medical University, 550025 Guiyang, China
Full list of author information is available at the end of the article
hypercholesteremia, hypertriglyceridemia, mixed hyperlipidemia, and low-density lipoproteinemia, etc. Medical research has established that the mechanism of
hyperlipidemia is not only determined by environmental
factors, such as long-term consumption of large quantities
of saturated fatty acids, cholesterol, and sugar, it is also influenced by genetic factors at gene loci. There are multiple
academic reports that apolipoprotein (APO) gene mutations are closely related to disorders of blood lipid metabolism [5]. APO is an important component of lipoprotein.
So far, more than 20 forms of APO have been identified,
including APOA, APOB, APOC, APOD, APOE, APOH,
APOM, etc. [6]
Single nucleotide polymorphisms (SNPs) are changes
to a single nucleic acid in a protein caused by the insertion, deletion, or substitution of a single nucleotide base
in the gene sequence. Of the existing apolipoprotein
candidate genes, researchers have correlated APOA1,
APOA5, APOB, and APOE gene polymorphisms with
© The Author(s). 2021 Open Access This article is licensed under a Creative Commons Attribution 4.0 International License,
which permits use, sharing, adaptation, distribution and reproduction in any medium or format, as long as you give
appropriate credit to the original author(s) and the source, provide a link to the Creative Commons licence, and indicate if
changes were made. The images or other third party material in this article are included in the article's Creative Commons
licence, unless indicated otherwise in a credit line to the material. If material is not included in the article's Creative Commons
licence and your intended use is not permitted by statutory regulation or exceeds the permitted use, you will need to obtain
permission directly from the copyright holder. To view a copy of this licence, visit />The Creative Commons Public Domain Dedication waiver ( applies to the
data made available in this article, unless otherwise stated in a credit line to the data.
Zhao et al. BMC Genomic Data
(2021) 22:14
hyperlipidemia. APOA1 and APOA5 genes are located
in the long arm region of chromosome 11. APOA1 is located in the APOA1-C3-A4 gene cluster, the principal
site controlling the expression of lipids and lipoproteins
[7]. APOA5 is located downstream of APOA4, and its
distance from the APOA1/C3/A4 gene cluster is approximately 30 kb. The APOA5 gene is most commonly
altered at -1131 T > C, this polymorphism being closely
associated with a number of diseases, such as hypertriglyceridemia and coronary heart disease [8]. The APOB
gene is located in the short arm of chromosome 2 and
contains 29 exons and 28 introns. The cleavage sites
MspI and XbaI are located within exon 26 of the APOB
gene. The EcoRI cleavage site is located within exon 29
[9]. A number of studies have clearly indicated that the
APOB gene affects lipid metabolism to a certain extent.
The APOE gene is located on chromosome 19 with a
polymorphic gene structure. The isomers are encoded
by the three alleles ε2, ε3, and ε4 [10], forming 6 genotypes E2/2, E3/3, E4/4, E2/3, E2/4, and E3/4, of which
E3/3 is the most common within the population.
Over recent years, there have been multiple studies
that have explored the correlation between genetic polymorphism and hyperlipidemia for the apolipoprotein
gene loci described above, but there are great differences
and uncertainties in different populations from different
regions. Therefore, in the present review, we systematically searched the literature and reviewed case-control
studies of hyperlipidemia. A meta-analysis was conducted
to explore the relationship between APOA (A1-75bp,
A1 + 83 bp, A5–1131T>C), APOB (MspI, XbaI, EcorI),
and APOE with hyperlipidemia so that an evidence-base
can be provided for the prevention and control of
hyperlipidemia.
Results
Study characteristics
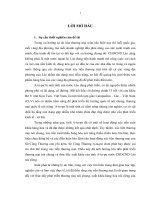
A total of 3706 articles were identified in the Chinese
and English databases, of which 59 articles were finally
selected, including 22 that analyzed APOA, 28 APOB,
and 30 APOE. Three sites in the APOA gene were studied: A5–1131T > C was studied in 10 case-control studies that included 1211 cases and 1495 controls; A1-75bp
was studied in 5 case-control studies that included 1284
cases and 1312 controls; and A1 + 83 bp was studied in 7
case-control studies that included 1452 cases and 1620
controls. The APOB gene was investigated at three sites:
MspI was studied in 6 case-control studies that included
a hyperlipidemia group, with 1155 cases and 1043 controls; XbaI was studied in 12 case-control studies that
included 1900 cases and 1836 controls; and EcorI was
studied in 10 case-control studies that included 1633
cases and 1686 controls. The APOE gene is co-coded by
the three alleles, ε2, ε3, and ε4, for which 30 case control
Page 2 of 19
studies were studied that included 5208 cases in the
hyperlipidemia group and 6406 cases in the control
group. The NOS score of no study included in the
review was less than 7. The comparison between case
and control groups was highly credible. The specific
process for literature retrieval is displayed in Fig. 1.
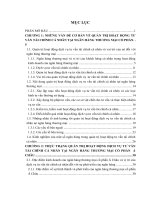
Meta-analysis of APOA5–1131 T > C (rs662799)
This gene locus was included in 10 case-control studies,
involving a total of 2706 subjects, including 1211 in the
hyperlipidemia group and 1496 in the control group.
The baseline data and quality evaluation of each study
are displayed in Table 1. Analysis of the relationship between C vs T alleles and hyperlipidemia (allele model)
revealed substantial heterogeneity (I2 = 73.9%, P < 0.001),
so a random-effects model was used to analyze the combined effects. Individuals with the C allele had a higher
risk of hyperlipidemia than those with the T allele, a difference that was statistically significant (OR = 1.996, 95%
CI = 1.529–2.606, P < 0.001) (Fig. 2). Other gene models
at this site displayed consistent results (Table 2). Subgroup analysis by ethnicity demonstrated an increased
risk of hyperlipidemia among Asians (OR = 1.818; 95%
CI = 1.268–2.607, P = 0.001) and Caucasians (OR = 2.355;
95% CI = 1.665 ~ 3.331, P < 0.001) that had the C allele,
using the allele model. Other gene models at this site
displayed results that were consistent with this (Table 3,
Fig. 3). Therefore, the single nucleotide polymorphism
APOA5–1131 T > C was associated with hyperlipidemia,
the C allele posing a risk factor for susceptibility to
hyperlipidemia.
Meta-analysis of APOA1-75 bp (rs670)
This location on APOA was included in 5 case-control
studies, involving a total of 2596 subjects, of which 1284
were in the hyperlipidemia group and 1312 in the control
group. Baseline data and quality evaluation are displayed in
Table 1. There was no significant heterogeneity in the
relationship between A vs G alleles and hyperlipidemia
(allele model) (I2 = 1.2%, P = 0.400), and so a fixed-effects
model was used to combine the effects. Individuals with the
A allele had a higher risk of hyperlipidemia than those with
the G allele, a difference that was statistically significant
(OR = 1.228, 95% CI = 1.067–1.413, P = 0.004) (Fig. 4). The
recessive model of this locus indicated that the difference
was not statistically significant (P = 0.066). Other gene
models at this site were consistent with this result, suggesting that the single nucleotide polymorphism APOA1-75 bp
is associated with hyperlipidemia, the A allele being a risk
factor for susceptibility to hyperlipidemia (Table 2).
Meta-analysis of APOA1 + 83 bp (rs5069)
This site was included in 7 case-control studies, involving a
total of 3072 subjects, including 1452 in the hyperlipidemia
Zhao et al. BMC Genomic Data
(2021) 22:14
Page 3 of 19
Fig. 1 Flow diagram of the meta-analysis
group and 1620 in the control group. The baseline data and
quality evaluation of each study are shown in Table 1.
Analysis of the relationship between A vs G alleles and
hyperlipidemia (allele model) indicated that there was no
significant heterogeneity (I2 = 0.0%, P = 0.472). Therefore, a
fixed-effects model was selected to analyze the pooled effect. There was no significant difference in risk in individuals that carried the T allele compared with C (OR = 0.928,
95% CI = 0.771–1.116, P = 0.425). The P-values of other
gene models at this locus were all higher than 0.05, suggesting that there was no significant difference. Thus, an association between APOA1 + 83 bp gene polymorphism and
susceptibility to hyperlipidemia can be considered not to
exist (Table 2).
hyperlipidemia group and 1043 in the control group.
Baseline data and quality evaluation are shown in
Table 4. Analysis of the association between M- vs M+
alleles and hyperlipidemia (allele model) indicated no
heterogeneity (I2 = 0.0%, P = 0.731), and do a fixedeffects model was selected to analyze the pooled effects.
No significant difference in risk was found in individuals
carrying the M- compared with the M+ allele (OR =
0.892, 95% CI = 0.756–1.053, P = 0.178). The P-values of
other gene models at this site were also greater than
0.05, indicating that there was no significant difference.
Thus, no association between genetic polymorphism of
APOB MspI and risk of hyperlipidemia was found
(Table 5).
Meta-analysis of APOB MspI (rs1801701)
Meta-analysis of APOB XbaI (rs693)
This gene locus was included in 6 case-control studies,
involving a total of 2198 subjects, including 1155 in the
This site was included in 12 case-control studies, involving a
total of 3736 subjects, including 1900 in the hyperlipidemia
2016
2001
2005
2017
Feng DW [7]
Jia LQ [24]
Bora K [2]
2016
Feng DW [7]
Zhu H [23]
2015
Ou HJ [5]
Bora K [2]
2011
2012
2017
Chi YH [21]
Xie YJ [22]
2016
2012
Han Y [8]
Feng DW [7]
2008
Peter H [19]
2016
2009
ZK Liu [18]
Feng DW [7]
2010
Brito [17]
2011
2012
Cláudia [16]
Huang G [20]
2014
Maria [15]
Assam, India
Sichuan,
China
Sichuan,
China
Xinjiang,China
Xinjiang,
China
Xinjiang,
China
Xinjiang,
China
Assam, India
Xinjiang,China
Xinjiang,
China
Xinjiang,
China
Xinjiang,
China
Hunan,
China
Netherlands
Hongkong,
China
Belo Horizonte,
Brazil
Minas Gerais,
Brazil
Napoli, Italian
Hunan, China
Taiwan, China
Shanghai,
China
Beijing, China
Area
100
118
134
345
365
241
150
100
200
345
365
275
109
254
56
53
108
165
95
76
156
172
100
109
255
391
370
246
150
100
200
391
370
252
117
240
176
77
107
142
102
240
262
80
43.12 ± 11.64
58.1 ± 8.9
54.7 ± 12.6
43.91 ± 14.27
46.8 ± 15.9
49.1 ± 0.7
56.8 ± 10.8
43.1 ± 11.6
58.5 ± 11.8
43.9 ± 14.3
46.8 ± 15.9
47.7 ± 7.9
60.3 ± 12.1
NR
49.6 ± 12.3
10.4 ± 2.7
48.4 ± 6.8
47.5 ± 12.2
61 ± 12
59.57 ± 10.2
NR
NR
Age (y)
Case
Control
Sample size
Case
42.95 ± 11.60
54.5 ± 9.6
51.7 ± 10.9
41.51 ± 13.28
45.2 ± 16.4
48.3 ± 0.8
58.1 ± 10.5
43.0 ± 11.6
58.3 ± 11.5
41.5 ± 13.3
45.21 ± 16.4
48.23 ± 7.6
62.9 ± 12.0
NR
50.1 ± 9.4
11.2 ± 3.4
46.7 ± 6.6
43.9 ± 9.6
62 ± 12
60.98 ± 13.58
NR
NR
Control
PB
NR
PB
PB
PB
HB
HB
PB
PB
PB
PB
HB
HB
HB
HB
HB
PB
HB
HB
PB
PB
HB
Source
of
control
PCR-RFLP
PCR
PCR
PCR
PCR
MALDI-TOF
PCR-RFLP
PCR-RFLP
PCR-RFLP
PCR
PCR
PCR-RFLP
PCR-RFLP
PCR
PCR
PCR-RFLP
PCR-RFLP
TaqMan
PCR-RFLP
PCR-RFLP
MALDI-TOF
PCR-RFLP
Genotyping
method
89
105
123
299
317
160
126
62
116
250
248
135
52
142
9
34
52
111
46
15
68
63
TT/GG/CC
Cases
SNP single nucleotide polymorphism, PB population-based; HB: hospital-based, HWE Hardy-Weinberg equilibrium, NR not reported
APOA1+83 bp
APOA1-75 bp
2008
2013
Long SY [14]
2016
Niu ZB [12]
Huang M [13]
2007
Zhao DD [11]
APOA5–1131
T>C
Year
First author
SNP
Table 1 Main characteristics of the studies of APOA included in the review
0
0
11
0
1
0
1
0
3
2
7
13
38
14
7
20
5
4
5
13
20
20
23
CC/AA/TT
13
11
44
48
80
24
35
82
87
104
102
43
72
27
14
52
49
36
41
68
86
CT/GA/CT
87
99
238
330
304
171
130
60
124
299
280
136
59
172
101
62
71
117
50
99
153
39
TT/GG/CC
Controls
13
10
17
57
63
73
20
33
73
86
83
95
50
22
61
13
33
23
45
111
94
36
CT/GA/CT
0
0
0
3
3
2
0
7
5
5
7
21
8
1
11
2
3
2
7
30
15
5
CC/AA/TT
8
6
7
9
9
7
7
8
7
9
9
8
7
6
7
6
7
7
7
8
9
7
NOS
HWE
0.48
0.25
0.3
0.1
0.02
3.78
0.77
0.68
2.31
0.18
0.09
0.57
0.36
0.11
0.19
1.52
0.13
0.49
0.54
0.02
0.01
0.77
χ2
0.49
0.62
0.58
0.76
0.89
0.05
0.38
0.41
1.29
0.67
0.77
0.49
0.55
0.75
0.66
0.22
72
0.48
0.46
0.9
0.91
0.37
P
Zhao et al. BMC Genomic Data
(2021) 22:14
Page 4 of 19
Zhao et al. BMC Genomic Data
(2021) 22:14
Page 5 of 19
Fig. 2 Pooled calculated OR for the association between the APOA5–1131 T > C allele and hyperlipidemia
group and 1836 in the control group. Baseline data and
quality evaluation are shown in Table 4. Analysis of the
association between T vs C alleles and hyperlipidemia (allele
model) indicated substantial heterogeneity (I2 = 72.4%,P <
0.001) and so a random-effects model was used to analyze
the pooled effects. The risk of hyperlipidemia in the T allele
population was higher than that with the C allele, the difference of which was statistically significant (OR = 1.444, 95%
CI = 1.061–1.966, P = 0.020) (Fig. 5). There was no significant difference between the dominant and codominant
models of this locus, with P-values of 0.100 and 0.140, respectively. The results of other gene models were consistent
with those of the allele model (Table 5). Subgroup analysis
by ethnicity displayed an increased risk of hyperlipidemia
among Caucasians that carried the T allele when analyzed
with the allele model, a difference that was statistically
significant (OR = 2.074; 95% CI = 1.611–2.672, P < 0.001).
However, no significant association was found in other gene
models. We found that there was no significant association
with risk of hyperlipidemia risk in Asians carrying the T
Table 2 Summary of the meta-analysis of the association of APOA gene polymorphisms with hyperlipidemia
SNP
Analysis model
Genotype model
Heterogeneity(I2/P)
OR (95%CI)
P
Publication bias P
APOA5–1131 T>C
A
C vs T
73.9%/ < 0.001
1.996(1.529 ~ 2.606)
< 0.001
0.353
D
TC + CC vs TT
71.2%/ < 0.001
2.179(1.565 ~ 3.035)
< 0.001
0.258
R
CC vs TC + TT
5.5%/ 0.390
2.790(2.055 ~ 3.789)
< 0.001
0.991
C
CC vs TT
45.7%/ 0.056
3.604(2.589 ~ 5.017)
< 0.001
0.899
TC vs TT
67.2%/ 0.001
1.932(1.395 ~ 2.674)
< 0.001
0.465
APOA1-75 bp
APOA1 + 83 bp
A
A vs G
1.2%/ 0.400
1.228(1.067 ~ 1.413)
0.004
0.086
D
AA+GA vs GG
0.0%/ 0.704
1.246(1.056 ~ 1.471)
0.009
0.067
R
AA vs GA + GG
15.9%/ 0.313
1.458(0.976 ~ 2.180)
0.066
0.086
C
AA vs GG
17.4%/ 0.304
1.520(1.008 ~ 2.291)
0.046
0.086
GA vs GG
0.0%/ 0.828
1.212(1.020 ~ 1.439)
0.029
0.221
A
T vs C
0.0%/ 0.472
0.928(0.771 ~ 1.116)
0.425
0.440
D
TT + TC vs CC
0.0%/ 0.478
0.950(0.780 ~ 1.157)
0.607
0.371
R
TT vs TC + CC
0.0%/ 0.799
0.310(0.076 ~ 1.271)
0.104
0.315
C
TT vs CC
0.0%/ 0.775
0.308(0.075 ~ 1.259)
0.101
0.346
TC vs CC
0.0%/ 0.607
0.967(0.793 ~ 1.180)
0.740
0.466
A allelic model; D dominant model; R recessive model; C codominant model; Publication bias P: using Begg’s or Egger’s tests
Zhao et al. BMC Genomic Data
(2021) 22:14
Page 6 of 19
Table 3 Subgroup analysis by ethnicity of the APOA5–1131 T>C polymorphism on susceptibility to hyperlipidemia
P
Ethnicity
Analysis model
Genotype model
OR (95%CI)
Asian
A
C vs T
1.818(1.268 ~ 2.607)
0.001
D
TC + CC vs TT
1.943(1.211 ~ 3.117)
0.006
R
CC vs TC + TT
2.794(2.011 ~ 3.883)
< 0.001
C
CC vs TT
3.785(1.997 ~ 7.173)
< 0.001
Caucasian
TC vs TT
1.622(1.060 ~ 2.482)
0.026
A
C vs T
2.355(1.665 ~ 3.331)
< 0.001
D
TC + CC vs TT
1.943(1.918 ~ 3.749)
< 0.001
R
CC vs TC + TT
2.790(2.055 ~ 3.789)
0.016
C
CC vs TT
3.282(1.392 ~ 7.739)
0.007
TC vs TT
2.600(1.873 ~ 3.609)
< 0.001
A allelic model; D dominant model; R recessive model; C codominant model
allele using the allele model (OR = 1.305; 95% CI = 0.902–
1.888, P = 0.158), other gene models displaying results
consistent with those of the allele model (Table 6, Fig. 6).
Therefore, an association between APOB XbaI gene single
nucleotide polymorphism and hyperlipidemia in Asians was
not considered to exist. However, the T allele at this locus
could be considered a risk factor for hyperlipidemia in
Caucasians.
Meta-analysis of APOB EcorI (rs1042031)
This site was included in 10 case-control studies, involving a
total of 3319 subjects, including 1633 in the hyperlipidemia
group and 1686 in the control group. Baseline data and
quality evaluation are shown in Table 4. Analysis of the
association between A vs G alleles and hyperlipidemia
(allele model) indicated heterogeneity (I2 = 70.0%, P <
0.001), so the pooled effects were analyzed using a
random-effects model. There was no significant difference
in risk in individuals carrying the A or G alleles (OR =
1.333, 95% CI = 0.942–1.885, P = 0.104). The results of
other gene models at this site were consistent with this
conclusion, and so no association between the genetic
polymorphism of APOB Ecor I and susceptibility to hyperlipidemia (Table 5) can be considered to exist.
Fig. 3 Subgroup analysis by ethnicity for the association between the APOA5–1131 T > C allele and the risk of hyperlipidemia
Zhao et al. BMC Genomic Data
(2021) 22:14
Page 7 of 19
Fig. 4 Pooled calculated OR for the association between the APOA1-75 bp allele and hyperlipidemia
Meta-analysis of APOE
This site was included in 30 case-control studies, involving a total of 11,614 subjects, including 5208 in the
hyperlipidemia group and 6406 in the control group.
The baseline data and quality evaluation of the various
studies are displayed in Table 7. The APOE ε3 allele was
used as a reference to analyze the relationship between
alleles and hyperlipidemia. Analysis of the data for ε2
(I2 = 63.0%, P < 0.001) and ε4 (I2 = 73.3%, P < 0.001) indicate that heterogeneity was present and so the pooled
effects were analyzed using a random-effects model. The
difference in risk between individuals with the ε2 and ε3
allele was not statistically significant (OR = 1.167, 95%
CI = 0.955–1.426, P = 0.131). The risk of hyperlipidemia
in individuals with the ε4 allele was higher than in those
with the ε3 allele, a difference that was statistically significant (OR = 1.710, 95% CI = 1.405–2.083, P < 0.001)
(Fig. 7). Because of heterogeneity, subgroup analysis by
ethnicity was conducted, the results using the allele
model demonstrating a risk of hyperlipidemia was different for Asians (OR = 1.304; 95% CI = 1.075–1.582, P =
0.007) for those with ε2 compared with the ε3 allele, but
the association was not significant for Caucasians (OR =
0.807; 95% CI = 0.502–1.297, P = 0.376) (Fig. 8). There
were significant differences in risk of hyperlipidemia,
which was higher in both Asians (OR = 1.704; 95% CI =
1.325–2.192, P < 0.001) and Caucasians (OR = 1.759; 95%
CI = 1.231–2.513, P = 0.002) with the ε4 allele than those
carrying the ε3 allele (Fig. 9).
Correlations in the APOE genotype (E2/E2, E2/E3, E2/
E4, E3/E4, E4/E4) and hyperlipidemia were analyzed
using the wild type E3/E3 genotype as a reference. The
heterogeneity, and OR and 95% CI values of these data
are displayed in Table 8. The significance level was
adjusted to α′ = α/(k-1) = 0.01. There was a significant
difference in risk of hyperlipidemia between carriers of
the E2/E4, E3/E4, and E4/E4 genotypes with carriers of
the E3/E3 genotype, the P-values of which were < 0.01 in
each case. To identify the source of significant heterogeneity, we conducted subgroup analysis based on ethnicity. The results demonstrated that there was a
significant difference in risk of hyperlipidemia in carriers
of all genotypes (E2/E2, E2/E3, E2/E4, E3/E4, E4/E4)
compared with carriers of the E3/E3 genotype in Asians,
while Caucasians carrying the E3/E4, E4/E4 genotypes
were statistically different from those carrying E3/E3
(Table 9). Therefore, APOE gene polymorphisms can be
considered to be closely associated with hyperlipidemia.
For Asians, either the ε2 or ε4 allele was a risk factor for
hyperlipidemia, while for Caucasians, only the ε4 allele
was a risk factor.
Publication bias and sensitivity analysis
There was no apparent asymmetry in each Begg’s funnel
plot (Fig. 10), indicating that publication bias was slight.
In addition, statistical analysis of the symmetry of Begg’s
funnel plots using an Egger’s test demonstrated that
publication bias for each gene locus displayed P-values
all > 0.05, indicating that publication bias was apparently
not present.
For groups that deviated substantially in the analysis,
meta-analysis was performed again after exclusion of the
associated manuscripts, and OR and P-values recalculated. Exclusion of the study [18] for APOA5–1131
T > C with the most deviating OR value using the allele
model resulted in conclusions similar and consistent
with those of the original data (OR = 1.800, 95% CI =
2012
2010
Timirci O [36]
2015
Ou HJ [5]
1999
2015
Zhang PZ [32]
CHOONG [35]
2015
Chi YH [21]
2011
Jin YN [27]
CHOONG [35]
Xie YJ [22]
1999
Gong LG [34]
2011
2003
Philippa [33]
Huang G [20]
1987
Selma [28]
2012
2000
Ou HJ [5]
Ma ZZ [31]
2015
Zhang PZ [32]
2010
2015
Jin YN [27]
Qian J [29]
2015
Xie YJ [22]
Capa-Istanbul,
Turkey
Singapore
Xinjiang, China
Xinjiang, China
Beijing,
China
Chongqing,
China
Xinjiang, China
Xinjiang, China
Guangdong,
China
Yunnan, China
Singapore
Liaoning, China
London, U.K.
Sao Paulo, Brazil
Xinjiang, China
Beijing,
China
Chongqing,
China
Xinjiang, China
Xinjiang, China
Guangdong, China
Guangdong, China
Yunnan, China
Sao Paulo,
Brazil
Xinjiang, China
Chongqing,
China
Xinjiang, China
Xinjiang, China
Xinjiang, China
Area
173
39
38
200
246
120
180
150
252
250
76
173
150
62
100
246
100
180
150
221
250
128
76
100
200
180
252
221
90
131
200
241
100
157
150
275
250
91
131
115
133
177
241
100
157
150
247
250
108
91
177
200
157
275
247
100
11.5 ± 3.6
NR
58.5 ± 11.8
49.1 ± 0.7
60.0 ± 5.0
48.1 ± 3.8
56.8 ± 10.8
47.7 ± 7.9
45.5 ± 13.2
46.9 ± 11.4
NR
54.2 ± 11.7
NR
58
49.1 ± 0.7
60.0 ± 5.0
48.1 ± 3.8
56.8 ± 10.8
48.7 ± 7.7
45.50 ± 13.20
40–70
46.9 ± 11.4
58
58.5 ± 11.8
48.1 ± 3.8
47.7 ± 7.9
48.7 ± 7.7
46 ± 11
Age (y)
Case
Control
Sample size
Case
11.4 ± 3.2
58.3 ± 11.5
48.3 ± 0.8
49.11 ± 4.2
58.1 ± 10.5
48.2 ± 7.6
47.5 ± 8.06
52.5 ± 13.1
44
48.3 ± 0.8
49.1 ± 4.2
58.1 ± 10.5
47.3 ± 6.2
47.5 ± 8.1
44
58.3 ± 11.5
49.1 ± 4.2
48.2 ± 7.6
47.3 ± 6.2
44 ± 11
Control
HB
HB
PB
HB
HB
HB
HB
HB
PB
HB
HB
HB
HB
HB
HB
HB
HB
HB
HB
PB
HB
HB
HB
PB
HB
HB
HB
HB
Source
of
control
PCR
PCR-RFLP
PCR-RFLP
MALDI-TOF
PCR
DNA chips
PCR-RFLP
PCR-RFLP
PCR-RFLP
DNA chips
PCR-RFLP
PCR-RFLP
PCR-RFLP
PCR
MALDI-TOF
PCR
DNA chips
PCR-RFLP
PCR-RFLP
PCR-RFLP
DNA probe
DNA chips
PCR
PCR-RFLP
DNA chips
PCR-RFLP
PCR-RFLP
PCR-RFLP
Genotyping
method
0
0
6
1
1
0
1
12
0
0
0
1
43
30
0
0
0
2
4
0
0
0
2
6
0
25
9
0
M-M−/
TT/ AA
Cases
4
9
52
29
19
12
55
73
41
13
25
29
59
94
19
20
28
29
54
52
8
7
25
66
26
68
70
4
M + M−/
CT/ AG
34
122
142
211
80
145
94
190
209
78
106
85
31
53
222
80
129
119
189
198
100
84
150
128
131
182
168
95
M + M+
/CC/ GG
Controls
0
0
6
0
1
0
0
10
0
0
0
0
12
13
0
0
0
0
3
0
0
1
1
12
0
22
6
0
M-M−/
TT/ AA
4
16
56
22
11
20
19
77
28
3
21
12
38
55
32
5
35
12
41
28
11
11
24
64
35
69
67
3
M + M−/
CT/ AG
35
157
138
224
108
160
131
165
222
73
152
138
12
32
214
95
145
138
177
222
117
64
75
124
145
161
148
87
M + M+ /
CC/ GG
7
6
7
7
8
7
7
8
8
7
6
6
6
6
7
8
7
7
7
8
6
7
6
7
7
8
7
6
NOS
HWE
0.11
0.41
0.01
0.54
1.33
0.62
0.69
0.07
0.88
0.03
0.72
0.26
3.16
1.99
1.19
0.07
2.09
0.26
0.13
0.88
0.26
0.42
0.37
0.91
2.09
3.43
0.24
0.03
χ2
0.74
0.52
0.91
0.46
0.25
0.43
0.41
0.79
0.35
0.86
0.4
0.61
0.08
0.16
0.28
0.8
0.15
0.61
0.72
0.35
0.61
0.51
0.54
0.34
0.15
0.06
0.63
0.87
P
(2021) 22:14
SNP single nucleotide polymorphism, PB population-based; HB: hospital-based, HWE Hardy-Weinberg equilibrium, NR not reported
APOB EcorI
2012
2011
Chi YH [26]
2012
Ma ZZ [31]
2000
Selma [28]
2010
2012
Chi YH [21]
1997
2015
Jin YN [27]
Qian J [29]
2011
Huang G [20]
Feng JS [30]
2012
Chi YH [26]
APOB XbaI
2009
Cao WJ [25]
APOB Msp
Year
First author
SNP
Table 4 Principal characteristics of the studies of APOB included in the review
Zhao et al. BMC Genomic Data
Page 8 of 19
Zhao et al. BMC Genomic Data
(2021) 22:14
Page 9 of 19
Table 5 Summary of the results of the meta-analysis of the association of APOB gene polymorphisms and hyperlipidemia
SNP
Analysis model
Genotype model
Heterogeneity(I2/P)
OR(95%CI)
P
Publication bias P
APOB MspI
A
M- vs M+
0.0%/ 0.731
0.892(0.756 ~ 1.053)
0.178
0.452
D
M-M−/M + M- Vs M + M+
0.0%/0.716
0.868(0.716 ~ 1.053)
0.152
0.707
R
M-M-vs M + M−/M + M+
0.0%/ 0.513
0.932(0.596 ~ 1.456)
0.757
0.908
C
M-M- vs M + M+
0.0%/ 0.555
0.903(0.574 ~ 1.421)
0.660
0.883
M + M- vs M + M+
0.0%/ 0.654
0.864(0.705 ~ 1.057)
0.156
0.746
A
T vs C
72.4%/ < 0.001
1.444(1.061 ~ 1.966)
0.020
0.732
D
TT + CT vs CC
73.5%/ < 0.001
1.360(0.943 ~ 1.962)
0.100
0.945
R
TT vs CT + CC
0.0%/ 0.747
1.613(1.022 ~ 2.545)
0.040
0.707
APOB XbaI
C
APOB EcorI
TT vs CC
0.0%/ 0.774
1.432(0.851 ~ 2.411)
0.017
0.724
CT vs CC
73.5%/ < 0.001
1.322(0.912 ~ 1.917)
0.140
0.837
A
A vs G
70.0%/ < 0.001
1.333(0.942 ~ 1.885)
0.104
0.474
D
AA+AG Vs GG
72.9%/ < 0.001
1.366(0.924 ~ 2.020)
0.118
0.283
R
AA vs AG + GG
0.0%/ 0.942
1.183(0.628 ~ 2.229)
0.603
0.221
C
AA vs GG
0.0%/ 0.886
1.166(0.617 ~ 2.202)
0.637
0.086
AG vs GG
72.6%/ < 0.001
1.356(0.913 ~ 2.015)
0.131
0.371
A allelic model; D dominant model; R recessive model; C codominant model; Publication bias P: using Begg’s or Egger’s tests
1.454–2.229, P < 0.001). The results indicated stability in
the APOA1-75 bp and APOA1 + 83 bp allele models,
with no literature having excessive deviation.
For the APOB Xba I locus using the allele model, exclusion of the manuscript [32] with the largest deviation
in OR value resulted in conclusions of the meta-analysis
consistent with the original conclusions (OR = 1.365,
95% CI = 1.001–1.862, P = 0.049). Exclusion of the biased
literature [36] that studied APOB Ecor I in Caucasians
resulted in differences in the meta-analysis that were
not statistically significant and consistent with the original conclusions (OR = 1.351, 95% CI = 0.940–1.941,
P = 0.104). Sensitivity analysis of the allele model of
APOB Msp I was performed, the results of which
were consistent with the original conclusions (OR =
0.926, 95% CI = 0.779–1.102, P = 0.387).
Exclusion of the manuscript [65] with the greatest
deviation in data for the ε2 allele of APOE resulted in
Fig. 5 Pooled calculated OR for the association between the APOB XbaI allele and hyperlipidemia
Zhao et al. BMC Genomic Data
(2021) 22:14
Page 10 of 19
Table 6 Subgroup analysis by ethnicity of the APOB XbaI polymorphism on susceptibility to hyperlipidemia
Ethnicity
Analysis model
Genotype model
OR(95%CI)
P
Asian
A
T vs C
1.305(0.902 ~ 1.888)
0.158
D
TT + CT vs CC
1.470(0.953 ~ 2.267)
0.081
R
TT vs CT + CC
1.476(0.507 ~ 4.300)
0.475
C
TT vs CC
1.569(0.542 ~ 4.541)
0.406
Caucasian
CT vs CC
1.466(0.960 ~ 2.238)
0.077
A
T vs C
2.075(1.611 ~ 2.672)
< 0.001
D
TT + CT vs CC
0.985(0.640 ~ 1.518)
0.947
R
TT vs CT + CC
1.644(0.993 ~ 2.723)
0.053
C
TT vs CC
1.391(0.765 ~ 2.530)
0.280
CT vs CC
0.848(0.509 ~ 1.412)
0.526
A allelic model; D dominant model; R recessive model; C codominant model
conclusions for the meta-analysis that the ε2 allele was
not associated with hyperlipidemia (OR = 1.150, 95%
CI = 0.943–1.402, P = 0.167). Correspondingly, exclusion
of the literature [65] with the largest deviation for the
APOE ε4 allele resulted in conclusions consistent with
those originally recorded, following recalculation, and so
carrying the ε4 allele can be considered a risk factor for
hyperlipidemia (OR = 1.657, 95% CI = 1.365–2.012, P <
0.001). To summarize, we conclude that there was no
apparent inconsistency in the literature that would
contradict our original conclusions, with good reliability.
Discussion
The present study found that allele C at APOA5–1131
T > C was a risk factor for hyperlipidemia, the A allele at
AI-75 bp conferred susceptibility to hyperlipidemia, the
T allele at APOB Xba I represents a preliminary pathogenic factor for hyperlipidemia in Caucasians, allele ε4
of the APOE gene is a risk factor for hyperlipidemia, and
allele ε2 is a risk factor for hyperlipidemia in Asians.
The APOE gene, located on chromosome 19, contains 4
exons and 3 introns, with 3 isomers, and the functions by
of regulating plasma total cholesterol (TC) and lipoprotein
Fig. 6 Subgroup analysis by ethnicity for the association between the APOB XbaI allele and the risk of hyperlipidemia
2012 Jiangsu,China
Jiang WM [53]
Long SY [54]
2018 Riyadh, Saudi
Arabia
2000 Valencia, Spain
1988 Kumamoto,
Japan
2016 Zaragoza,
Spain
2011 New Delhi,
India
2012 Zaragoza,
Spain
Turky H.A [57]
Corella [58]
Kobori [59]
Cenarro [60]
Kiran [61]
SolanasB [62]
330
264
352
219
HB
PB
HB
HB
PB
HB
HB
NR
HB
HB
51.3 ± 10.3 PB
53.1 ± 4.7
HB
50.2 ± 15.1 HB
50.2 ± 15.1 HB
40.1 ± 13.5 PB
56.3 ± 9.8
63.8 ± 6.2
51
58.0 ± 2.4
63.8 ± 6.2
HB
43.1 ± 10.8 HB
NR
48.4 ± 9.7
42.0 ± 7.9
47.9 ± 11.5
30–69
38.8 ± 9.1
57.8 ± 9.9
10.8
53.0 ± 15.5
58.2 ± 7.9
PB
HB
PB
HB
HB
HB
43.5 ± 16.9 HB
35.2 ± 9.6
44.8 ± 16.0 HB
37.6 ± 8.4
44.0 ± 6.3
NR
51.3 ± 10.3 PB
55.1 ± 9.7
54.6 ± 11.85 50.2 ± 15.1 HB
PCR
PCR-RFLP
RT-PCR
SRID
PCR
TaqMan
PCR
PCR-RFLP
PCR-RFLP
DNA
sequencing
DNA
sequencing
PCR-RFLP
PCR-RFLP
PCR
ARMS-PCR
DNA
sequencing
DNA
sequencing
PCR-RFLP
PCR-RFLP
ARMS-PCR
PCR-RFLP
PCR
PCR-RFLP
ARMS-PCR
PCR-RFLP
PCR-RFLP
PCR-RFLP
11
0
0
9
0
1
0
1
1
2
1
0
1
0
2
2
1
0
2
0
0
5
0
0
1
0
2
25
8
9
49
17
7
50
37
21
21
7
10
27
9
8
21
9
13
23
16
46
17
22
26
18
9
19
5
4
1
7
5
2
10
5
4
6
2
2
1
0
3
6
2
5
1
0
2
4
5
0
2
0
2
189
143
186
323
237
74
243
156
68
127
57
56
101
75
45
127
64
114
64
74
135
88
104
109
124
69
155
65
62
72
47
69
18
135
23
17
47
22
6
28
12
13
47
22
22
12
21
22
18
32
27
27
21
32
8
2
11
12
2
2
12
3
1
9
4
0
6
0
1
9
4
6
1
2
1
1
0
3
0
1
0
Source Genotyping Cases
of
method
E2/E2 E2/E3 E2/E4 E3/E3 E3/E4 E4/E4
control
56.0 ± 11.85 50.2 ± 15.1 HB
56.8 ± 12.4
58.3 ± 7.1
60.0 ± 8.3
NR
54.6 ± 11.9
48.4 ± 9.7
47.3 ± 13.8
56.9 ± 8.5
62.5 ± 7.2
52
41–60
56.4 ± 3.2
60.5 ± 8.3
NR
48.7 ± 10.5
58.48
Control
1
2
0
0
3
0
13
2
1
0
0
2
1
0
0
0
0
0
1
0
2
1
0
0
0
0
0
27
19
19
12
50
4
261
26
8
7
7
26
21
9
16
7
7
55
15
20
28
14
12
20
13
13
9
4
3
3
1
1
0
45
1
0
1
1
1
3
1
3
1
1
8
1
0
1
2
2
0
0
2
1
183
251
160
143
252
85
1128
165
48
86
86
165
116
75
61
86
86
225
102
81
182
97
61
81
58
60
75
45
73
34
30
23
11
512
35
16
6
6
35
13
9
15
6
6
38
27
7
35
8
12
7
9
14
9
4
4
4
2
1
0
59
1
0
0
0
1
2
1
0
0
0
2
0
0
2
0
0
0
0
2
0
E2/E2 E2/E3 E2/E4 E3/E3 E3/E4 E4/E4
Controls
8
7
8
7
7
8
7
7
7
6
6
7
6
7
7
7
7
7
8
7
7
7
6
7
7
6
6
P
0.33
0.39
0.33
0.46 0.79
5.48 0.06
2.53 0.28
0.39 0.82
1.28 0.53
0.66 0.72
2.83 0.24
2.27 0.32
3.89 0.14
2.19 0.33
2.19 0.33
2.27 0.32
5.04 0.08
1.75 0.42
2.66 0.26
2.19 0.33
2.19 0.33
5.59 0.06
2.53 0.28
2.2
1.9
2.87 0.24
1.82 0.4
2.2
2.03 0.36
1.79 0.41
0.94 0.63
χ2
NOS HWE
(2021) 22:14
312
220
188
288
447
330
104
100
2018
2003 Amsterdam,
Netherlands
ALBERT [56]
450
73
230
2004 Sichuan,China 112
Zhang XM [55] 2001 Sichuan,China 225
212
100
100
2013 Jiangsu,China
Jiang WM [52]
93
230
95
Zhang XM [51] 2001 Sichuan,China 74
96
95
100
100
328
146
108
250
122
87
108
80
91
94
156
Luo R [50]
72
212
102
160
113
133
163
165
172
210
164
2007 Beijing,China
2006 Hubei,China
Zhan CY [49]
2005 Sichuan,China 103
Tian Y [44]
2006 Shanxi,China
2005 Hubei,China
Zhu CL [43]
Liu YL [48]
2005 Sichuan,China 206
Wang R [42]
2011 Jiangsu,China
1996 Beijing,China
Zeng WY [41]
Qian J [47]
2001 Guangdong,
China
Zeng ZW [40]
2004 Beijing,China
2007 Hubei,China
Hu HN [39]
2013 Jiangsu,China
2007 Beijing,China
Zhao DD [11]
Jiang WM [46]
2007 Xinjiang,China 100
Wu XH [38]
Zhang YH [45]
2008 Beijing,China
Liang JP [37]
Age (y)
Case Control Case
Sample size
Year Area
First author
Table 7 Main characteristics of the studies of APOE included in the review
Zhao et al. BMC Genomic Data
Page 11 of 19
59
21
FUMERON [64] 1988 Paris, France
T Kuusi [65]
21
113
107
45.2 ± 0.8
NR
48.4 ± 6.8
46.7 ± 1.5
46.7 ± 6.6
Control
HB
HB
HB
PCR
PCR
PCR-RFLP
0
0
0
1
5
10
3
1
0
2
35
77
8
14
18
7
4
4
Source Genotyping Cases
of
method
E2/E2 E2/E3 E2/E4 E3/E3 E3/E4 E4/E4
control
0
1
0
1
13
9
0
1
0
11
79
72
8
16
25
1
3
1
E2/E2 E2/E3 E2/E4 E3/E3 E3/E4 E4/E4
Controls
SNP single nucleotide polymorphism, PB population-based, HB hospital-based, HWE Hardy-Weinberg equilibrium, NR not reported, SRID single radial immunodiffusion
1988 Helsinki,
Finland
109
2010 Minas Gerais,
Brasil
N.Ferreira [63]
Age (y)
Case Control Case
Sample size
Year Area
First author
Table 7 Main characteristics of the studies of APOE included in the review (Continued)
6
6
7
P
0.44 0.8
3.96 0.14
2.26 0.32
χ2
NOS HWE
Zhao et al. BMC Genomic Data
(2021) 22:14
Page 12 of 19
Zhao et al. BMC Genomic Data
(2021) 22:14
Page 13 of 19
Fig. 7 Pooled calculated OR for the association between the APOE allele and hyperlipidemia
metabolism. APOE3 is the most common phenotype. A
principal function is to bind low-density lipoprotein
receptor (LDL-R) and APOE receptor as the ligand [66].
Compared with APOE3, the ability of APOE4 to bind to
its receptor is relatively strong, resulting in the metabolism of chylomicrons (CMs) and very low-density lipoprotein (VLDL) residues to be accelerated and the conversion
of VLDL to LDL to increase. Additionally, the rate of liver
internalization and catabolism of CM and VLDL residues
becomes accelerated, resulting in increased free cholesterol in hepatocytes with feedback that caused a downregulation of LDL-R on their surface, resulting in a
decrease in the metabolic rate of LDL [67]. Furthermore,
the low intestinal cholesterol absorption capacity of ε4
carriers also increases, resulting in higher plasma levels of
TC and LDL. This is consistent with the conclusion that
the ε4 allele is a risk factor for hyperlipidemia in the
present review. The study also found that the ε2 allele is
harmful for blood lipid levels in the Asian population, but
failed to establish the effects on blood lipid levels in the
Caucasian population. This may be related to the imbalance of internal composition and the small sample size for
Caucasians. Of course, we cannot rule out the possibility
of a corresponding biological mechanism to explain why
this locus has no harmful effects on Caucasians.
APOB is the principal protein component of LDL and
plays a role in transportation of endogenous cholesterol to
maintain its balance within the body. The APOB gene is
located in region 23–24 of the short arm of human
chromosome 2. The APOB gene plays a key role in the
production, transport, and removal of LDL and VLDL
from plasma and regulates the concentration of plasma
cholesterol [68]. The polymorphism of the APOB XbaI restriction site is due to a mutation of nucleotide C → T at
position 7673 of the APOB gene cDNA, which changes the
codon sequence at position 2488 (ACC → ACT), thus producing an XbaI endonuclease recognition site. The T allele
may be related to a reduction in LDL degradation rate mediated by the receptor [9]. A number of studies have also
speculated that a single nucleotide polymorphism at this
locus is a genetic marker and has linkage disequilibrium
with other nearby DNA sequence variants that affect cholesterol levels [69]. Such a molecular mechanism could explain why the T allele is a risk factor for hyperlipidemia in
Caucasians. Other studies further confirm our conclusions
that this polymorphism of the APOB XbaI gene might increase the risk of cerebral infarction, and that the T allele
is such a risk factor [70]. The T allele was associated with
lower levels of HDL-C, which may be associated with the
incidence of coronary heart disease [71].
Zhao et al. BMC Genomic Data
(2021) 22:14
Page 14 of 19
Fig. 8 Subgroup analysis by ethnicity for the association between the APOE ε2 and ε3 alleles and the risk of hyperlipidemia
The APOA1 gene is located in the terminal region of the
long arm of chromosome 11 and consists of 3 introns and
4 exons. APOA1 is the main apolipoprotein to create highdensity lipoprotein (HDL), maintaining the stability and
integrity of the HDL structure, and promoting the esterification of cholesterol (TC) [72]. The APOA1-75 bp polymorphism not only destroys the endonuclease recognition
site but also changes the GGGCCGG sequence which
activates transcription. A change in the sequence may also
affect the synthesis of APOA1 [73]. This mechanism is
consistent with the conclusion that there is an association
between the A1-75bp gene single nucleotide polymorphisms and hyperlipidemia. The APOA5 gene, located in
23 regions of the long arm of chromosome 11, has 1889
bps and consists of 4 exons, 2 introns, and 4 silencing molecules. APOA5 can reduce triglyceride (TG) and increase
HDL, representing a protective factor for coronary heart
disease [74]. Some of the manuscripts also clearly stated
that the mutation APOA5–1131 T > C is closely related to
increased triglyceride levels [75] and that the CC genotype
of this locus was positively correlated with serum TG levels
and negatively correlated with APOA5 levels [76].
A meta-analysis can effectively compensate for the lack
of statistical efficacy and other problems within a single
study. However, although the present review developed
a scientifically-based and comprehensive search strategy
with strict unified screening criteria, limitations still
remain [77]: (1) There were few relevant Chinese and
English manuscripts on the acquisition of particular gene
loci, such as APOAI and APOB MspI, so the number of
case-control studies included in the analysis was small,
possibly reducing the effectiveness of the Egger’s and
Begg’s tests, in addition to sensitivity analysis; (2) The
data included in the review did not involve additional
races, which led to heterogeneity. Although ethnic subgroup analysis can identify heterogeneity to some extent,
we found that there was a small sample size in Caucasians for APOB XbaI, possibly the reason why the results
of the genetic model were not consistent at this locus.
(3) It is unknown whether there were statistical differences in sex and age among individuals included in the
study; (4) The effects of gene-environmental interactions
and genetic linkage disequilibrium were not considered.
In the future, we shall include more reliable data in this
Zhao et al. BMC Genomic Data
(2021) 22:14
Page 15 of 19
Fig. 9 Subgroup analysis by ethnicity for the association between the APOE ε3 and ε4 alleles and the risk of hyperlipidemia
respect and update the meta-analysis, thereby providing
a more reliable evidence base for the prevention and
control of hyperlipidemia from the perspective of the
apolipoprotein gene.
Conclusions
In summary, the results of the present meta-analysis revealed that the C allele of APOA5 1131 T > C, the A allele at APOA1-75 bp, the APOB XbaI T allele, and the
ε2 and ε4 alleles of APOE may represent genetic risk
factors for susceptibility for hyperlipidemia. In addition,
we found it is consistent with the present study on the
pathological mechanisms of hyperlipidemia. However,
there is a need for further large-scale studies, including
larger case-control studies and analysis of other loci of
the APO genes, to confirm our conclusions and elucidate the influence of gene-environment interactions.
Methods
Literature search strategy
The Pubmed, Web of Science, ScienceDirect, the Chinese
National Knowledge Infrastructure database, the Chinese
Table 8 Summary of the meta-analysis of the association of APOE gene polymorphisms with hyperlipidemia
Genotype model
Heterogeneity(I2/P)
OR(95%CI)
P
publication bias P
E2/E2
0.0%/0.634
1.746(1.081 ~ 2.819)
0.023
0.131
E2/E3
50.3%/0.001
1.076(0.883 ~ 1.311)
0.467
0.400
E2/E4
0.0%/0.790
1.693(1.227 ~ 2.336)
0.001
0.054
E3/E4
67.8%/< 0.001
1.578(1.276 ~ 1.951)
< 0.001
0.073
E4/E4
2.7%/ 0.424
2.346(1.723 ~ 3.195)
< 0.001
0.851
Publication bias P: using Begg’s or Egger’s tests
Zhao et al. BMC Genomic Data
(2021) 22:14
Page 16 of 19
Reporting Items for Systematic Reviews and Meta-Analysis
(PRISMA) statement [78].
Table 9 Subgroup analysis by ethnicity of APOE gene
polymorphisms on susceptibility to hyperlipidemia
Ethnicity
Genotype model
OR(95%CI)
P
Asian
E2/E2
2.062(1.131 ~ 3.761)
0.003
E2/E3
1.229(1.006 ~ 1.502)
0.009
E2/E4
1.958(1.283 ~ 2.986)
0.002
E3/E4
1.579(1.201 ~ 2.077)
0.001
Caucasian
E4/E4
3.312(2.041 ~ 5.374)
< 0.001
E2/E2
1.248(0.549 ~ 2.841)
0.597
E2/E3
0.703(0.479 ~ 1.034)
0.073
E2/E4
1.342(0.805 ~ 2.237)
0.260
E3/E4
1.612(1.121 ~ 2.317)
0.002
E4/E4
1.712(1.129 ~ 2.596)
0.002
Wanfang database, and Database of Chinese science
and technology periodicals were searched to identify
studies that evaluated the association of APO gene
polymorphisms with the risk of hyperlipidemia, where
publication date was prior to June 9, 2020. The keywords
“apolipoprotein”, “APO”, “hyperlipidemia”, “dyslipidemias”,
“hypercholesteremia”, “hypertriglyceridemia”, “mixed hyperlipidemia”, “low density lipoproteinemia”, “APOA”, “APOB”,
“APOC”, “APOD”, “APOE”, “APOA5–1131 T > C”,
“rs662799”, “APOA1-75 bp”, “rs670”, “APOA1 + 83 bp”,
“rs5069”, “APOB MspI”, “rs1801701”, “APOB XbaI”,
“rs693”, “APOB EcorI”, “rs1042031”, “gene”, “polymorphism”, and “genetic polymorphism” were searched. The references of all eligible studies were also searched manually in
order to find other studies missed during the initial search
activity. The analysis followed the guidelines of the Preferred
Fig. 10 Begg’s funnel plot for the APOE ε4 allele
Identification of studies for inclusion
The inclusion criteria for the present meta-analysis were
as follows: (1) studies that evaluated the association
between APO and risk of hyperlipidemia; (2) studies
with an appropriate statistical design and selection
methods; (3) case-control and RCT studies; (4) diagnostic criteria for dyslipidemia that were clear and uniform
[79]; (5) distribution of APO genotypes in controls
group were consistent with the Hardy-Weinberg equilibrium (HWE); (6) allele typing methods were accurate;
(7) data included in the studies were complete, without
omissions. Duplicated data, reviews, abstracts, case
reports, animal studies, and studies that did not meet
the inclusion criteria were excluded.
Data extraction
Two reviewers (XNZ and QS) independently conducted
literature screening and evaluation. The following information was extracted from each study for inclusion in the
review: first author, year of publication, area, age, source
of control, sample size of controls and cases, genotyping
method, Hardy-Weinberg equilibrium (HWE), and the
distribution of genotypes and frequencies of alleles in
cases and controls. Any disputes were resolved by discussion with a third investigator.
Quality evaluation
The quality of the selected case-control studies was
evaluated according to the Newcastle-Ottawa Quality
Assessment Scale (NOS) [80], of which data with scores
Zhao et al. BMC Genomic Data
(2021) 22:14
Page 17 of 19
0–3, 4–6 or 7–9 were low, moderate or high-quality, respectively [81].
Availability of data and materials
All data analysed in this study can be derived from publicly available
databases.
Statistical analyses
Declarations
The included hyperlipidemia data were analyzed by
meta-analysis using Stata 11 software. The correlation
between apolipoprotein gene polymorphism and hyperlipidemia was expressed by odds ratio (OR) and 95%
confidence intervals (CIs). In order to better evaluate the
presence of heterogeneity between the studies, an I2 test
was also used. Where homogeneity (I2 < 50%) was identified in the meta-analysis, a fixed-effects model was
adopted; otherwise, a random-effects model was used to
integrate the incorporated data. The data were assessed
using Egger’s and Begg’s tests to evaluate publication
bias. Sensitivity analysis was conducted by deleting, in
turn, the data from individual studies that had large deviations as identified in the results, then recalculating
the OR value. All P-values were two-sided, with a significance threshold set at α = 0.05.
To explore the source of significant heterogeneity,
subgroup analysis of race was performed. A total of 7
sites were included, of which 3 sites (APOA5–1131 T >
C,APOB XbaI, and APOE) were evaluated by subgroup
analysis of ethnicity, 2 sites (APOB MspI, and APOB
EcorI) were analyzed by sensitivity analysis, as there was
only one published study of different races in the literature that was not suitable for subgroup analysis. Race
was not evaluated in 2 sites (APOA1-75 bp, APOA1 +
83 bp) by subgroup analysis due to the fact that the populations studied were the same race, and had no significant heterogeneity.
Abbreviations
APO: Apolipoprotein; SNPs: Single nucleotide polymorphisms; HWE: HardyWeinberg Equilibrium; NOS: Newcastle-Ottawa Quality Assessment Scale;
TC: Total cholesterol; LDL-R: Low-density lipoprotein receptor;
CM: Chylomicron; VLDL: Very low-density lipoprotein; HDL: High-density
lipoprotein
Acknowledgments
We would like to acknowledge all individuals who participated in this study.
We thank all staff of the School of Public Health and the School of Health of
Guizhou Medical University and the School of Public Health of Hebei
Medical University for their collaboration.
Authors’ contributions
Writing-Original draft preparation: XNZ, QS; Methodology and data curation:
QS, XNZ; Writing-review and editing: YQC, XR, and XNZ; Supervision: YC, QS.
All authors have read and approved the final manuscript.
Funding
This work was supported by the First-Class Discipline Construction Project in
Guizhou Province - Public Health and Preventive Medicine (no. 2017[85]),
and by the 15th Provincial Capital Construction Project of Guizhou Development
and Reform Commission in 2018 (no. [2018]1571); Soft Science Project of Yunyan
District (no. [2016] 2). The funding bodies played no role in the design of the
study and collection, analysis, and interpretation of data and in writing the
manuscript.
Ethics approval and consent to participate
This work has been approved by the Ethics Committee of Guizhou Medical
University.
Consent for publication
Not applicable.
Competing interests
We declare that none of the work contained in this manuscript is published
in any language or currently under consideration at any other journal, and
there are no conflicts of interest to declare.
Author details
1
School of Public Health, the Key Laboratory of Environmental Pollution
Monitoring and Disease Control, Ministry of Education, Guizhou Medical
University, Guiyang 550025, China. 2School of Public Health, Hebei Medical
University, Shijiazhuang 050017, China. 3School of Health, Guizhou Medical
University, 550025 Guiyang, China.
Received: 11 September 2020 Accepted: 25 March 2021
References
1. Ye H, Zhou A, Hong Q, Tang L, Xu X, Xin Y, et al. Positive association
between APOA5 rs662799 polymorphism and coronary heart disease: a
case-control study and meta-analysis [J]. PLoS One. 2015;10(8):e135683.
/>2. Bora K, Pathak MS, Borah P, Hussain MI, Das D. Association of the
Apolipoprotein A-I gene polymorphisms with cardiovascular disease risk
factors and Atherogenic indices in patients from Assam, Northeast
India. Balkan J Med Genet. 2017;20(1):59–70. />bjmg-2017-0002.
3. Wang X, Li J, Wang Y, et al. Acupuncture and related therapies for
hyperlipidemia [J]. Medicine. 2020;99(49):e23548. />MD.0000000000023548.
4. Miao J, Zang X, Cui X, et al. Autophagy, hyperlipidemia, and atherosclerosis
[J]. Adv Exp Med Biol. 2020;1207:237–64. />5-4272-5-18.
5. Ou HJ, Huamg G, Liu W, et al. Relationship of the APOA5/A4/C3/A1
gene cluster and APOB gene polymorphisms with dyslipidemia [J].
Genet Mol Res. 2015;14(3):9277–90. (in Chinese). />8/2015.August.10.8.
6. Meng Q, Zhang XH, Zhang XW. Meta-anaylsis on association of ApoE gene
polymorphism with hyperlipidemia. Chinese Preventive Medicine. 2015;16:
304–7. (in Chinese). />7. Feng DW. Association between Polymorphisms of APOA1 Gene and
Susceptibility for Uyghur and Kazak’s Dyslipidemia [D]. Shihezi city: Shihezi
University; 2016. (in Chinese). />8. Han Y. Association between the Subclasses of HDL and APOA5 Gene
Polymorphism in Hypertriglyceridemia [D]. Hengyang city: University of
South China; 2012. (in Chinese)
9. Zhang PZ, Tian Y. Relationship of Apolipoprotein B and E gene
polymorphisms to dyslipidemia and the influence of exercise training. China
Sport Science. 2006;26:65–9. (in Chinese). />006.10.010.
10. Zhang Y, Zeng T, Xu J, Liu L. Apolipoprotein gene polymorphism in
coronary heart disease. Adv Cardiovasc Dis. 2019;40:1294–7. (in Chinese).
/>11. Zhao DD. Relationship between apolipoprotein A5, C3 and E gene
polymorphisms and phlegm and blood stasis syndrome and therapeutic
effect in patients with hyperlipidemia [D]. Beijing: China Academy of
Chinese Medical Sciences; 2007. (in Chinese)
12. Niu ZB. Association study between lipid metabolism-related
genepolymorphisms and polymorphisms and hyperlipidemia in aged
Zhao et al. BMC Genomic Data
13.
14.
15.
16.
17.
18.
19.
20.
21.
22.
23.
24.
25.
26.
27.
28.
29.
(2021) 22:14
patients withlong-term aerobic exercise [D]. Shanghai: Shanghai University
of Sport; 2016. (in Chinese) CNKI:CDMD:2.1016.258549
Huang MC, Wang TN, Wang HS, Sung YC, Ko YC, Chiang HC. The -1131T>C
polymorphism in the apolipoprotein A5 gene is related to
hypertriglyceridemia in Taiwanese aborigines. Kaohsiung J Med Sci. 2008;
24(4):171–9. />Long SY, Chen ZJ, Han Y, Christopher DM, Zhang CP, Yang Y, et al.
Relationship between the distribution of plasma HDL subclasses and the
polymorphisms of APOA5 in hypertriglyceridemia. Clin Biochem. 2013;46(9):
733–9. />Di Taranto MD, Staiano A, D'Agostino MN, D'Angelo A, Bloise E, Morgante A,
et al. Association of USF1 and APOA5 polymorphisms with familial
combined hyperlipidemia in an Italian population. Mol Cell Probes. 2015;
29(1):19–24. />Ferreira CN, Carvalho MG, Fernandes AP, Santos IR, Rodrigues KF, Lana AMQ,
et al. The polymorphism -1131T>C in apolipoprotein A5 gene is associated
with dyslipidemia in Brazilian subjects. Gene. 2013;516(1):171–5. https://doi.
org/10.1016/j.gene.2012.12.016.
Brito DD, Fernandes AP, Gomes KB, Coelho FF, Cruz NG, Sabino AP, et al.
Apolipoprotein A5-1131T>C polymorphism, but not APOE genotypes,
increases susceptibility for dyslipidemia in children and adolescents. Mol
Biol Rep. 2011;38(7):4381–8. />Liu ZK, Hu M, Baum L, Thomas GN, Tomlinson B. Associations of
polymorphisms in the apolipoprotein A1/C3/A4/A5 gene cluster with
familial combined hyperlipidaemia in Hong Kong Chinese. Atherosclerosis.
2010;208(2):427–32. />Henneman P, van der Sman-de Beer F, Moghaddam PH, Huijts P, Stalenhoef
AFH, Kastelein JJP, et al. The expression of type III hyperlipoproteinemia:
involvement of lipolysis genes. Eur J Hum Genet. 2009;17(5):620–8. https://
doi.org/10.1038/ejhg.2008.202.
Huang G, Zhong H, Re HM, Mao HM, Chi YH. Association of
polymorphisms of apoB genes EcoRI, XbaI, and MspI and apoAI gene 75 bp and + 83 bp with dyslipidemia in Kazaks. The Journal of
Practical Medicine. 2011;27:3518–22. (in Chinese). />969/j.issn.1006-5725.2011.19.026.
Chi YH. Relationship between ApoB gene EcoRI, XbaI, MspI and apoAI gene75bp, + 83bp polymorphisms and blood lipids [D]. Shihezi city: Shihezi
University; 2012. (in Chinese) doi: />Xie YJ. The Association of APoB and APoAI Gene Polymorphism With
DysliPidemia in Han Chinese of Xinjiang Shihezi [D]. Shihezi city: Shihezi
University; 2011. (in Chinese). />Zhu H, Liu Y, Bai H, Liu BW. Apolipoprotein AI gene MspI polymorphism in
relation to endogenous hypertriglyceridemia in Chinese population. Chin J
Arterioscler. 2001;9:332–6. (in Chinese). />949.2001.04.017.
Jia LQ, Bai H, Fu MD, Xu YH, Gou LT. Relationship of subclasses of serum
HDL and Apo A-I gene polymorphism in hyperlipidemia. Chinese J
Pathophysiol. 2006;04:796–800. (in Chinese). />000-4718.2006.04.039.
Cao WJ, Sheng L, Yang J, Zhou D, Cheng J. Relationship between MspI
polymorphism of apolipoprotein B gene and blood-fat of Hazakh
inhabitant. J Pract Med Techniques. 2009;16:770–2. (in Chinese). https://doi.
org/10.3969/j.issn.1671-5098.2009.10.002.
Chi YH, Huang G, Xie YJ, Guo ZL. Study on relationship between joint
action of EcoR I, Xba I and Msp I polymorphisms of apoB gene and
dyslipidemia. Journal of Clinical and Experimental Medicine. 2012;11:481–3.
(in Chinese). />Jin YN, Zhou L, Tang M, Zhang MJ, Tang XJ. Relationship between
ApoB gene Msp I/Xba I/EcoR I polymorphisms and serum lipid level
in male Han population in Chongqing,China. Acad J Second Mil Univ.
2015;36(9):966–71. (in Chinese). />00966, Relationship betweenApoBgeneMspI/XbaI/EcoRI polymorphisms
and serum lipid level in maleHanpopulation in Chongqing, China.
Cavalli SA, Hirata MH, Salazar LA, Diament J, Forti N, Giannini SD, et al.
Apolipoprotein B gene polymorphisms: prevalence and impact on serum
lipid concentrations in hypercholesterolemic individuals from Brazil. Clin
Chim Acta. 2000;302(1-2):189–203. />(00)00367-3.
Qian J, Hu DC, Zhao XL, Shao JC. Study on relationship between
apolipoprotein B gene polymorphisms frequencies distributionand and
essential hyperlipidemia of an nationality in Kunming area. Int J Lab
Page 18 of 19
30.
31.
32.
33.
34.
35.
36.
37.
38.
39.
40.
41.
42.
43.
44.
45.
46.
47.
48.
Med. 2010;31:1262–4. (in Chinese). />0.2010.11.026.
Feng JS, Xie XQ, Lin CL. Apolipoprotein B Gene Polymorphisms in Patients
with Hyperlipidemia or Coronary Heart Disease. J Jinan Univ (Natural
Science & Medicine Edition). 1997;18:14–8. (in Chinese). />007/BF02951625.
Ma ZZ, Huang WB, He FP, Zhang SB. Relationship between apolipoprotein B
gene polymorphisms and lipid levels in Yao population of Yuebei area. J
Mol Diagn Ther. 2012;4:333–5. (in Chinese). />674-6929.2012.05.013.
Zhang PZ, Tian Y. Influence of Apolipoprotein B gene polymorphisms over
effect of exercise on blood lipid. China Sport Science. 2015;35:38–47. (in
Chinese). />Talmud PJ, Barni N, Kessling AM, Carlsson P, Darnfors C, Bjursell G, et al.
Apolipoprotein B gene variants are involved in the determination of
serum cholesterol levels: a study in normo- and hypelipidaemic
individuals. Atherosclerosis. 1987;67(1):81–9. />Gong LG, Liu XR, Qiu GB, Li HF, Cui XW. Analysis of XbaI polymorphism in
the ApoB gene to hypertriglyceridemics in Chinese population. Chin J Lab
Diagn. 2003;7:306–8. (in Chinese). />003.04.012.
Choong ML, Sethi SK, Koay ES. Effects of intragenic variability at 3
polymorphic sites of the apolipoprotein B gene on serum lipids and
lipoproteins in a multiethnic Asian population. Hum Biol. 1999;71:381–97
PMID: 10380374.
Timirci O, Darendeliler F, Bas F, Arzu EH, Umit Z, Isbir T. Comparison of lipid
profiles in relation to APOB EcoRI polymorphism in obese children with
hyperlipidemia. In Vivo. 2010;24:65–9 PMID: 20133978.
Liang JP, Yang HM, Sheng T, Han LB, Yuan YJ, Niu XH, et al. Study on the
relationship between ApoE gene polymorphism and plasma lipid levels of
phlegm-blood-stasis syndrome of hyperlipemia. China J Trad Chin Med
Pharm. 2008;23:633–5 (in Chinese).
Wu XH, Cheng J, Zhou ZZ, Qin JM, He L. Relationship between
apolipoprotein E gene polymorphism and blood lipids in Kazakh population
in Xinjiang. Chinese J Clin Laboratory Sci. 2007;25:447–9. (in Chinese).
/>Hu HN, Chen W, Yang G, Lv M. Association of polymorphisms of apoprotein
E and lipid levels with hyperlipidemia. Chin J Tissue Engineering Res. 2007;
11:1453–6. (in Chinese). />Zeng ZW, Peng S, Peng J, Gong WX. Relationship between apolipoprotein E
gene polymorphism and hyperlipidemia. Guangdong Med J. 2001;22:120–1.
(in Chinese). />Zeng WW, Lv XY, Chen BS. The study on the association between
PolymorPhism of APoliPoProtein E gene and HyPerliPidemia. Chin J
Arterioscler. 1996;4:185–9 (in Chinese).
Wang R, Xie RL, Huang WF, Yang MQ. Apolipoprotein E gene
polymorphism and its relationship with type IV hyperlipidemia. Sichuan
Med J. 2005;26:400–1. (in Chinese). />004-0501-2005.04.027.
Zhu CL, Zhou X, Liu F, Hu HL. The relationship between polymorphisms of
Apolipoprotein E gene and Serum lipid. Chinese J Arteriosclerosis. 2005;13:
203–6. (in Chinese). />Tian Y, Long SY, Xu YH, Fu MD, Zhang XM, Liu BW. Study on apoE gene
polymorphism and subclasses of serum high density lipoprotein in type IV
hyperlipidemia. Chin J Med Genet. 2005;22:100–2. (in Chinese). https://doi.
org/10.3760/j.issn:1003-9406.2005.01.027.
Zhang YH, Dou XF, Shang W, Dou XF, Wang YF, Liu YQ, et al. Association
between familial combined hyperlipidemia (FCHL) and Apolipoprotein E
polymorphism. Chinese J Hypertension. 2004;22:29–32. (in Chinese). https://
doi.org/10.16439/j.cnki.1673-7245.2004.02.008.
Jiang WM, Fang ZY, Zhu CL, Tang SH. Effects of ApoE gene polymorphism on antiinflammatory action of Xuezhikang capsule. Chinese J Integrated Traditional
Western Med. 2013;33(1):35–9. (in Chinese). />Qian J, Jiang WM, Chen XH, Zhu CL, Xie L. Study on the relation between
ApoE gene polymorphisms and the plasma lipids in Hyperlipemia patients.
Chinese General Pract. 2011;14:840–2. (in Chinese). />issn.1007-9572.2011.08.010.
Liu YL, Li JK, Yan ZQ, Chen YJ. Correlation between apolipoprotein E gene
polymorphism and plasma lipid level. J Fourth Mil Med Univ. 2006;27:460–1.
(in Chinese). />
Zhao et al. BMC Genomic Data
(2021) 22:14
49. Zhan CY. Study on the relationship between Apolipoprotein E gene
polymorphism and blood lipid level and lipid-regulating effect in
hyperlipidemia with phlegm and blood stasis syndrome [D]. Beijing: Beijing
University of Chinese Medicine; 2006. (in Chinese)
50. Luo R, Chen WY. Relationship between apolipoprotein E gene
polymorphism and hyperlipidemia. Chinese Journal of Coal Industry
Medicine. 2006;9:246–7. (in Chinese). />51. Zhang XM, Bai H, Liu BW, Fan P, Zhang RJ, Xu YH, et al. Study on apoE
Gene Polymorphism in Chinese Type IIb Hyperlipidemia. J Sichuan Univ
(Medical Science Edition). 2001;32:179–82. (in Chinese). />969/j.issn.1672-173X.2001.02.006.
52. Jiang WM, Chen XH, Tang SH, Zhu CL, Xie L. Relationship between
TCM syndrome differentiation and ApoE exon 4 polymorphism and
dyslipidemia in patients with hyperlipidemia complicated with
hypertension. The third National Youth Forum on Cardiovascular
Diseases with Integrated traditional Chinese and Western Medicine and
the second Symposium of Cardiovascular Committee of Xinjiang Society
of Integrated traditional Chinese and Western Medicine; 2013 Sep 20;
Urumqi, Xinjiang, China. Xinjiang (China): The third National Youth
Forum on Cardiovascular Diseases with Integrated traditional Chinese
and Western Medicine and the second Symposium of Cardiovascular
Committee of Xinjiang Society of Integrated traditional Chinese and
Western Medicine; 2004.p. 172–177. (in Chinese).
53. Jiang WM, Zhu CL, Liu J, Tang SH. Correlation analysis of TCM syndrome
characteristics with ApoE gene polymorphisms in 212 hyperlipemia
patients. China Journal of Traditional Chinese Medicine and Pharmacy. 2012;
27:1458–60 (in Chinese) CNKI:SUN:BXYY.0.2012–05-076.
54. Long SY, Zhang XM, Fu MD, Xu YH, Liu BW. Relationship of APOE gene
polymorphism with subclasses of serum high density lipoprotein in
hyperlipidemia. Chin J Med Genet. 2004;21:83–6. (in Chinese). https://doi.
org/10.3760/j.issn:1003-9406.2004.06.019.
55. Zhang XM, Liu BW, Bai H, Fan P. Study on apoE gene polymorphism in
Chinese endogenous hypertriglycerdemia. Chin J Med Genet. 2001;18:21–5
(in Chinese) CNKI:SUN:ZHYC.0.2001–02-007.
56. Wiegman A, Sijbrands EJG, Rodenburg J, Defesche JC, de Jongh S, Bakker
HD, et al. The apolipoprotein epsilon4 allele confers additional risk in
children with familial hypercholesterolemia. Pediatr Res. 2003;53(6):1008–12.
/>57. Alharbi TH, Batais MA, Hasanato RM, Alharbi FK, Khan IA, Alharbi KK. Role of
Apolipoprotein E gene polymorphism in the risk o f familial
hypercholesterolemia: a case-control study. Acta Biochim Pol. 2018;65:415–
20. />58. Corella D, Guillén M, Portolés O, Sabater A, Cortina S, Folch J, et al.
Apolipoprotein E gene polymorphism and risk of hypercholesterolemia: a
case control study in a working population of Valencia. Med Clin. 2000;
115(5):170–5. />59. Kobori S, Nakamura N, Uzawa H, Shichiri M. Influence of apolipoprotein E
polymorphism on plasma lipid and apolipoprotein levels, and clinical
characteristics of type III hyperlipoproteinemia due to apolipoprotein E
phenotype E2/2 in Japan. Atherosclerosis. 1988;69(1):81–8. />0.1016/0021-9150(88)90291-2.
60. Cenarro A, Etxebarria A, de Castro-Orós I, Stef M, Bea AM, Palacios L, et al.
The p.Leu167del mutation in APOE gene causes autosomal dominant
hypercholesterolemia by Down-regulation of LDL receptor expression in
hepatocytes. J Clin Endocrinol Metab. 2016;101(5):2113–21. />0.1210/jc.2015-3874.
61. Meena K, Misra A, Vikram N, Ali S, Pandey RM, Luthra K. Cholesterol ester
transfer protein and apolipoprotein E gene polymorphisms in
hyperlipidemic Asian Indians in North India. Mol Cell Biochem. 2011;352(12):189–96. />62. Solanas-Barca M, de Castro-Orós I, Mateo-Gallego R, Cofán M, Plana N, Puzo
J, et al. Apolipoprotein E gene mutations in subjects with mixed
hyperlipidemia and a clinical diagnosis of familial combined hyperlipidemia.
Atherosclerosis. 2012;222(2):449–55. />therosclerosis.2012.03.011.
63. Ferreira CN, Carvalho MG, Fernandes APSM, Lima LM, Loures-Valle AA,
Dantas J, et al. Comparative study of apolipoprotein-E polymorphism and
plasma lipid levels in dyslipidemic and asymptomatic subjects, and their
implication in cardio/cerebro-vascular disorders. Neurochem Int. 2010;56(1):
177–82. />
Page 19 of 19
64. Fumeron F, Rigaud D, Bertiere MC, Bardon S, Dely C, Apfelbaum M.
Association of apolipoprotein epsilon 4 allele with hypertriglyceridemia in
obesity. Clin Genet. 1988;34(4):258–64. />988.tb02873.x.
65. Kuusi T, Taskinen MR, Solakivi T, Kauppinen-Mäkelin R. Role of
apolipoproteins E and C in type V hyperlipoproteinemia. J Lipid Res. 1988;
29(3):293–8. 3379342. />66. Mahley RW. Apolipoprotein E: from cardiovascular disease to
neurodegenerative disorders [J]. J Mol Med. 2016;94(7):739–46. https://doi.
org/10.1007/s00109-016-1427-y.
67. Mahley RW. Central nervous system lipoproteins [J]. Arterioscler Thromb
Vasc Biol. 2016;36(7):1305–15. />68. Pencina MJ, D'Agostino RB, Zdrojewski T, et al. Apolipoprotein B improves
risk assessment of future coronary heart disease in the Framingham heart
study beyond LDL-C and non-HDL-C [J]. Eur J Prev Cardiol. 2015;22(10):
1321–7. />69. Benn M, Nordestgaard BG, Jensen JS, Grande P, Sillesen H, Tybjaerg-Hansen
A. Polymorphism in APOB associated with increased low-density lipoprotein
levels in both genders in the general population. J Clin Endocrinol Metab.
2005;90(10):5797–803. />70. Niu C, Luo Z, Yu L, et al. Associations of the APOB rs693 and
rs17240441 polymorphisms with plasma APOB and lipid levels: a metaanalysis.[J]. Lipids Health dis. 2017;16(1):166. />944-017-0558-7.
71. Renges HH, Wile DB, McKeigue PM, Marmot MG, Humphries SE.
Apolipoprotein B gene polymorphisms are associated with lipid levels in
men of south Asian descent. Atherosclerosis. 1991;91:267–275. doi: https://
doi.org/10.1016/0021-9150(91)90174-2, 3.
72. Toptas B, Gormus U, Ergen A, et al. Comparison of lipid profiles with APOA1
MspI polymorphism in obese children with hyperlipidemia [J]. In Vivo. 2011;
25(3):425–30 PMID: 21576418.
73. Yin RX, Li YY, Lai CQ. Apolipoprotein A1/C3/A5 haplotypes and serum lipid
levels [J]. Lipids Health Dis. 2011;10(1):140. />X-10-140.
74. Li YY, Wu XY, Xu J, Qian Y, Zhou CW, Wang B. Apo A5 -1131T/C, FgB -455G/
A, −148C/T, and CETP TaqIB gene polymorphisms and coronary artery
disease in the Chinese population: a meta-analysis of 15,055 subjects [J].
Mol Biol Rep. 2013;40(2):1997–2014. />57-9 Apo A5 −1131T/C, FgB −455G/A, −148C/T, and CETP TaqIB gene
polymorphisms and coronary artery disease in the Chinese population: a
meta-analysis of 15,055 subjects.
75. Vrablik M, Hubacek JA, Dlouha D, Satny M, Adamkova V, Ceska R. Strong
association between APOA5 gene polymorphisms and
Hypertriglyceridaemic episodes [J]. Folia Biol (Praha). 2019;65(4):188–94
PMID: 31903892.
76. Kim M, Kim M, Yoo HY, Lee E, Chae JS, Lee SH, et al. A promoter variant of
the APOA5 gene increases atherogenic LDL levels and arterial stiffness in
hypertriglyceridemic patients. PLoS One. 2017;12(12):e186693. https://doi.
org/10.1371/journal.pone.0186693.
77. Zhai GH, Ma JL, Li MF. Association between apolipoprotein A5-1131T/C
polymorphism and type 2 diabetes mellitus in Chinese Han population: a
meta-analysis. Int J Lab Med. 2019;40:1321–1324. (in Chinese) https://doi.
org/ />78. Moher D, Liberati A, Tetzlaff J, Altman DG, Group P. Preferred
reporting items for systematic reviews and meta-analyses: the PRISMA
statement. PLoS Med. 2009;6(7):e1000097. />journal.pmed.1000097.
79. Rhee E, Kim HC, Kim JH, et al. 2018 guidelines for the management of
dyslipidemia [J]. Korean J Intern Med. 2019;34(4):723–71. />904/kjim.2019.188.
80. Wells GA, Shea B, O'Connell D, Peterson J, Welch V, Losos M, et al. The
Newcastle-Ottawa Scale (NOS) for assessing the quality of nonrandomised
studies in meta-analyses />epidemiology/oxford.asp
81. Lo CK, Mertz D, Loeb M. Newcastle-Ottawa scale: comparing reviewers' to
authors' assessments [J]. BMC Med Res Methodol. 2014;14(1):45. https://doi.
org/10.1186/1471-2288-14-45.
Publisher’s Note
Springer Nature remains neutral with regard to jurisdictional claims in
published maps and institutional affiliations.