The influence of intrapore cation on the fluorination of zeolite Y
Bạn đang xem bản rút gọn của tài liệu. Xem và tải ngay bản đầy đủ của tài liệu tại đây (4.56 MB, 11 trang )
Microporous and Mesoporous Materials 307 (2020) 110470
Contents lists available at ScienceDirect
Microporous and Mesoporous Materials
journal homepage: />
The influence of intrapore cation on the fluorination of zeolite Y
Daniel S. Parsons a, b, *, David C. Apperley c, Andrew Ingram d, Joseph A. Hriljac a, b, **
a
School of Chemistry, University of Birmingham, Birmingham, B15 2TT, UK
Diamond Light Source, Harwell Science and Innovation Campus, Didcot, OX11 0DE, UK
c
Department of Chemistry, Durham University, Durham, DH1 3LE, UK
d
School of Chemical Engineering, University of Birmingham, Birmingham, B15 2TT, UK
b
A R T I C L E I N F O
A B S T R A C T
Keywords:
Zeolite
Fluoride
Fluorination
Defluoridation
Silanol
The influence of the intrapore cation on the fluorination of zeolite Y from dilute fluoride solutions has been
studied, revealing fluoride reacts with the zeolite framework in the presence of a Brønsted acid to form [SiO3F]
and [AlO3F] moieties. 29Si{1H} Cross-polarised MAS NMR indicates the reaction proceeds by the substitution of
surface hydroxide moieties for fluoride. The fluorination reaction is strongly influenced by the nature of the
intrapore cation. Intrapore Brønsted acids facilitate fluorination of the framework by in situ ion-exchange,
releasing the acidic ions to the zeolite surface. The fluorination reaction may be further promoted by the
presence of intrapore alkaline earth cations (viz. Mg2+, Ca2+, Sr2+ and Ba2+). The conclusions of this work are
significant to the preparation of fluorinated zeolite catalysts, the application of zeolites in defluoridation and the
labelling of zeolite-based tracers with 18F for application in positron imaging techniques.
1. Introduction
Fluoride may be used as a mineraliser to catalyse condensation re
actions in sol-gel syntheses of zeolites and related materials. In many
cases, fluoride ions remain in cages in the products [1–7] where they
may also bond to silicon atoms forming five co-ordinate [SiO4F] species
[4–7]. Alternatively, fluoride may be incorporated into zeolites
post-synthesis from aqueous solutions. Previous studies on fluoride up
take by zeolites from aqueous solutions can generally be divided into
two categories: studies where zeolites are evaluated as adsorbents for
aqueous fluoride removal [8–14], and studies where fluoride is reacted
with the zeolite to modify the properties of the surface for catalytic
applications [15–21].
Studies that evaluate zeolite efficacy in aqueous fluoride removal
(defluoridation) are usually simple in conception, involving measuring
the amount of fluoride removed from solution by a natural zeolite
[8–10], or a zeolite modified with surface-sorbed trivalent cations
[11–14], using a fluoride ion-selective electrode. Post-treatment char
acterisation of the zeolite is not reported in any case and mechanistic
understanding is limited to information gleaned from fitting equilibrium
uptake data to adsorption isotherms.
Defluoridation has been demonstrated for natural samples of
clinoptilolite [8], analcime [8] and stilbite [8–10]. For stilbite, the Ca
form (Ca-STI) achieves higher fluoride loadings than the Na form
(Na-STI) [9]. In another study on Ca/NH4-STI and Ca/Na-STI, fluoride
uptake was attributed to “connectivity defects” and ion-exchange lead
ing to CaF2 precipitation, respectively [10]; however, neither conclusion
is supported by any evidence. Hitherto, the mechanism by which fluo
ride interacts with zeolites in dilute solutions has been unknown and
subject to supposition.
The modification of zeolites with Fe3+ (stilbite) [11], Al3+ (zeolites
A, X, Y and clinoptilolite) [12–14] and La3+ (clinoptilolite) [13] has
given rise to appreciable fluoride loadings. Fits to the
Dubinin-Radushkevitch isotherm reveal fluoride interacts by chemi
sorption with Al3+-modified zeolites A, X and Y [12,14]. In these
modified zeolites, it is believed fluoride substitutes for a hydroxide in
surface-sorbed M3+-complexes [12,14].
In studies where zeolites are fluorinated to modify the properties of
the surface for enhanced catalytic performance, the zeolite is typically
treated with a concentrated acid solution containing NH4F and heated
under reflux or hydrothermal conditions for a period of hours to days
[15–19]. Alternatively, the zeolite may be loaded with a fluoride con
taining solution by incipient wetness impregnation followed by thermal
treatment at ca. 500 ◦ C [20,21]. The zeolites are typically those of
* Corresponding author. Diamond Light Source, Harwell Science and Innovation Campus, Didcot, OX11 0DE, UK.
** Corresponding author. Diamond Light Source, Harwell Science and Innovation Campus, Didcot, OX11 0DE, UK.
E-mail addresses: (D.S. Parsons), (J.A. Hriljac).
/>Received 6 March 2020; Received in revised form 23 June 2020; Accepted 4 July 2020
Available online 25 July 2020
1387-1811/© 2020 The Authors. Published by Elsevier Inc. This is an open access article under the CC BY license ( />
D.S. Parsons et al.
Microporous and Mesoporous Materials 307 (2020) 110470
catalytic significance such as ZSM-5 or related materials such as tita
nosilicates with the MOR structure [16,20]. 19F MAS NMR spectroscopy
has confirmed the presence of [SiO3F] [15–18], [SiO4F] [15–18] and
[AlO3F] [19] moieties in fluorinated zeolites and related materials,
among species such as hexafluorosilicate ions attesting framework
destruction in some instances [15–17].
The mechanism by which the fluorination of zeolites occurs is
ascribed either to the addition of H+F− ion pairs across T-O-T bonds, or
alternately, the substitution of fluoride for hydroxide at surface silanol
(Si–OH) or aluminol (Al–OH) moieties. Decreasing intensities associated
with silanol hydroxyl stretches in IR spectra are put forward to support
the latter mechanism (substitution at surface hydroxide moieties) [15,
21]. The only evidence put forward for the former mechanism is based
on adsorption measurements to determine surface acidity which appears
inconclusive and far from compelling [20].
Naturally, a greater understanding of how defluoridation by zeolites
occurs from low concentration fluoride solutions could inform strategies
to enhance fluoride loadings. Such strategies could also be applied to
enhance fluoride loadings attained by large zeolite particles labelled
with 18F− for application as radiotracers in positron imaging techniques,
such as PEPT (Positron Emission Particle Tracking) [22]. In this study,
we have investigated the interaction between dilute fluoride solutions
and zeolites, determining the influence the intrapore cation has on the
affinity for fluoride, the fluoride containing moieties present in the
products and the likely mechanism by which defluoridation occurs.
readings. Blank measurements were employed for all analyte solutions
of a given concentration to adjust for any adsorption to the vessel.
Fluoride loadings (mg F− /g) of the initial zeolite material were calcu
lated by equation (1).
F− loading (mg F− /g) = (c0 − ce )/ρ; whereρ = m/v
(1)
In Equation (1), c0 and ce are the initial and equilibrium fluoride
concentrations (mg L− 1), respectively, as measured by a calibrated
fluoride ion-selective electrode (ISE). V is the volume of the solution (L)
and m is the initial mass of the zeolite (g).
In solutions which were analysed by ICP-OES to determine the Na+
concentration, solutions were made by dilution of 1000 ppm F− (1 g L− 1)
NaF solution (Hanna Instruments, HI70701L) with ultrapure water.
Circa 0.150 g portions of zeolites H–Y or NH4–Y, weighed accurately to 3
decimal places, were added to the NaF solutions (30 ml). The solutions
were added to the water bath with shaking attachment at 25 ◦ C as
described earlier and shaken for 24 h. After 24 h, solutions were filtered
through a 0.2 μm filter. Aliquots (15 ml) of the filtered solution were
added to TISAB-II (3 ml); the fluoride concentration was then measured
as described above. Separate aliquots of the filtered analyte solution
(9.71 ml) were diluted and acidified by the addition of 0.29 ml of 67 wt
% ultrapure HNO3 (VWR, NORMATOM™) rendering the final analyte
solution 2 wt% HNO3.
1:1 NaF:HNO3 solutions, in the range 5–60 ppm fluoride, were pre
pared by dilution of the appropriate amount of 1000 ppm F− (1 g L− 1)
NaF solution (Hanna Instruments, HI70701L) with deionised water,
where the required amount of 0.1 M HNO3 to render the final solution
1:1 NaF:HNO3 was added during dilution (e.g. in producing 250 ml of a
1:1 NaF:HNO3 solution with concentration 20 ppm F− , 2.60 ml of 0.1 M
HNO3 was added during dilution). Batch adsorption experiments with
Na–Y proceeded as described earlier with the 1:1 NaF:HNO3 solutions.
2. Experimental
2.1. Materials
NH4-zeolite Y (NH4–Y) was obtained from Alfa-Aesar (product
45863). Na–Y was obtained from Sigma-Aldrich (product 334448). H–Y
was produced by calcination of NH4–Y at 550 ◦ C in air in a muffle
furnace for 5 h.
Mx(NH4)1-2x-Y and MxNa1-2x-Y (M = Mg, Ca, Sr or Ba) species were
prepared by ion-exchange of the parent materials, NH4–Y and Na–Y,
respectively, with 0.25 M solutions of the appropriate divalent metal
nitrate salt agitated at 60 ◦ C in a Memmert WNB14 shaking water bath
for 24 h (zeolite to solution ratio of 0.5 g:50 ml). Divalent metal nitrate
salts employed were Mg(NO3)2.6H2O (Sigma Aldrich, 99%), Ca
(NO3)2.4H2O (Acros Organics, 99%), Sr(NO3)2 (Alfa Aesar, 99%) and Ba
(NO3)2 (Sigma Aldrich, 99%). Following ion-exchange, the products
were collected by vacuum filtration, washed copiously with deionised
H2O and dried overnight at 60 ◦ C.
2.3. Characterisation
Powder X-ray diffraction (PXRD) was performed on a Bruker D8
Advance diffractometer in reflection geometry equipped with a Nifiltered Cu Kα X-ray source (λ = 1.5418 Å) and fitted with a solid-state
LynxEye position sensitive detector. Scans were measured over the 2θ
range 4–60◦ at a scan rate of 0.04◦ s− 1 with a step-size of 0.02◦ .
XRF spectrometry was performed on a Bruker S8 Tiger spectrometer.
All samples were measured as loose powders mounted on Mylar™ film
for the maximum 18-min data collection time. Quantitative results were
obtained from SPECTRAplus software. The Kα emission line was used to
quantify all elements, except for Sr and Ba which were instead quanti
fied by the Lα emission line.
Scanning electron micrographs were obtained on a Phillips XL30
ESEM FEG microscope at an accelerating voltage of 20 keV and a
working distance of 10 mm. The imaged samples were mounted on
graphite tape then sputter coated with a gold thin film prior to imaging.
Solid-state 29Si NMR spectra were acquired using a Varian VNMRS
spectrometer operating at 79.44 MHz for silicon, with a 6 mm (rotor
outside diameter) magic-angle spinning (MAS) probe and at a sample
spin-rate of approximately 6 kHz. Direct excitation spectra were ob
tained following a 90◦ pulse with a 240 or 60 s recycle delay for H–Y and
Sr0.14(NH4)0.72-Y, respectively. Cross-polarisation spectra were recorded
using a 10 ms contact time and 1 s recycle delay. Spectral referencing is
with respect to tetramethylsilane, carried out by setting the highfrequency resonance from tetrakis(trimethylsilyl)silane to − 9.9 ppm.
Fluorine-19 MAS NMR spectra were acquired using a Bruker Avance
III HD spectrometer operating at 376.48 MHz for fluorine, with a 3.2 mm
MAS probe and at a sample spin-rate of either 18 or 20 kHz. Spectra were
acquired using a rotor-synchronised Hahn-echo and with a recycle delay
of 4 s. Spectral referencing is with respect to CFCl3, carried out by setting
the resonance from a 50:50% v/v mixture of CF3COOH/H2O to − 76.54
ppm. All MAS NMR spectra were recorded at ambient probe
temperature.
2.2. Batch fluoride adsorption measurements
Sodium fluoride solutions in the desired concentration range (5–60
ppm fluoride) were made by dilution of the appropriate volume of 1000
ppm fluoride (1 g L− 1) NaF solution (Hanna Instruments, HI70701L)
with deionised water in polypropylene volumetric flasks. Ca. 0.100 g of
zeolite, weighed accurately to 3 decimal places, was added to the so
lution (20 ml) of desired concentration in a polypropylene vessel (ca
pacity = 60 ml, diameter = 28 mm). The vessels were placed in a
Memmert WNB14 water bath equipped with a shaking attachment and
shaken laterally at approx. 110 shakes per minute for 24 h, at the
specified temperature. Following 24 h, 15 ml of supernatant solution
was decanted and added to 3 ml of TISAB-II buffer (Hanna Instruments,
HI401005L). The potential of the solution (mV) was measured with a
calibrated fluoride ion-selective electrode (Cole Parmer) connected to a
Hanna Instruments HI 3222 processor, calibrated across the range
1–100 ppm fluoride with standards (1, 10 and 100 ppm fluoride) made
by serial dilution of 1000 ppm F– NaF solution. Calibrants were also
prepared in a 5:1 mixture with TISAB-II. Solution fluoride concentra
tions were calculated from the appropriate calibration curve. Calibrant
and analyte solutions were stirred while measuring to ensure accurate
2
D.S. Parsons et al.
Microporous and Mesoporous Materials 307 (2020) 110470
ICP-OES analysis of Na concentrations was performed on a Perki
nElmer OES Optima 8000 spectrometer. Calibrants, with concentrations
0.1, 1, 5, 10 and 100 ppm, were made by dilution of 1000 ppm Na
standard solution (Centripur®) with ultrapure water. 67 wt% ultrapure
HNO3 (0.29 ml) was added to each calibrant solution (9.71 ml), such
that each calibrant was acidified to ca. 2 wt% and to the same extent as
the analyte solutions. A representative blank solution of ultrapure water
(9.71 ml) was also acidified by addition of 67 wt% ultrapure HNO3
(0.29 ml).
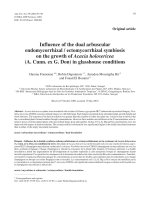
3.2. H–Y, NH4–Y and Na–Y: fluoride loadings
Equilibrium fluoride loadings from dilute NaF solutions (5–60 ppm
F− ) achieved by the zeolites H–Y, NH4–Y and Na–Y under isothermal
conditions as measured by a fluoride ion-selective electrode (ISE) are
plotted in Fig. 1 as a function of the initial fluoride concentration. The
contact time for all solutions with the zeolite was 24 h, loadings
measured following 48 and 72 h for H–Y show negligible variation from
those measured after 24 h, indicating that equilibrium is achieved by 24
h of contact between the zeolite and solution. Changing the intrapore
cation gives rise to markedly different equilibrium fluoride loadings
across the concentration range. No detectable change in fluoride con
centration occurs following contact with Na–Y, indicating negligible
fluoride adsorption on this zeolite. In contrast, fluoride uptake is
observed for both H–Y and NH4–Y across the same concentration range
under the same conditions. The fluoride loadings achieved by H–Y are
greater than NH4–Y from solutions with the same concentration;
moreover, loadings for both zeolites increase upon increasing the tem
perature from 25 ◦ C to 40 ◦ C.
2.4. Adsorption isotherms
The Dubinin-Radushkevitch (DR) isotherm equation and its linear
form, as commonly applied to adsorption at the solid-liquid interface,
are presented in Equation (2). The adsorption potential (ε) in the DR
isotherm may be calculated by Equation (3) [23,24]. The adsorbate
solubility (cs) used in Equation (3) was calculated at each temperature,
using the equation presented in Reynolds and Belsher [25], then con
verted to ppm F− (cs = 18803 ppm F− at 25 ◦ C, and cs = 19621 ppm F− at
40 ◦ C). The characteristic adsorption energy (Ec) may be derived from
the Dubinin-Radushkevitch constant (K) by the relationship in Equation
(4). Linear regression analysis to determine R2, the gradient and
y-intercept for each plot was performed in Sigmaplot software.
( )
VO
ln qe = ln
(2)
− K ε2
Vm
3.3. Role of Brønsted acids
While substantial fluoride uptake is observed for H–Y and NH4–Y,
negligible uptake under the same conditions is observed for Na–Y. The
NH4–Y and Na–Y employed possess similar particle sizes and bulk Si/Al
ratios; the only obvious characteristic difference between the two zeo
lites is the nature of the intrapore cation. Unlike Na–Y, the intrapore
cations in NH4–Y and H–Y are Brønsted acids; it would appear these
acidic cations are critical to the interaction occurring between the
zeolite and aqueous fluoride.
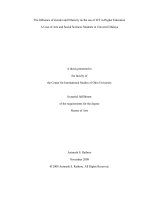
Measurement of the Na+ concentrations in supernatant solutions by
ICP-OES, following 24 h of contact with the zeolite, confirms ion+
exchange occurs between aqueous Na+ ions and intrapore NH+
4 or H
ions, in the case of NH4–Y and H–Y, respectively. Fig. 2 presents a plot of
equilibrium ion loading (mol g− 1), for both F− and Na+, for each zeolite
at 25 ◦ C as a function of initial fluoride concentration (ppm F− ), where
F− and Na+ concentrations were determined by a F− ISE and ICP-OES,
Definitions for equation (2): qe, equilibrium uptake (mg g− 1); K,
Dubinin-Radushkevitch constant (mol2 kJ− 2); ε, adsorption potential (kJ
mol− 1); VO, specific micropore volume (cm3 g− 1); Vm, volume of the
adsorbate (cm3 mg− 1).
( )
C
ε = RT ln s
(3)
Ce
Definitions for equation (3): R, universal gas constant (kJ K− 1
mol− 1); T, absolute temperature (K); cs, adsorbate solubility (mg L− 1).
Ec = (2K)−
0.5
(4)
Fits to the Langmuir, Temkin and Freundlich isotherms have also
been tested and these isotherms, as well as plots and the results of fits (R2
and isotherm parameters), may be found in the Supporting Information.
3. Results and discussion
3.1. H–Y, NH4–Y and Na–Y: characterisation
The phase purities of H–Y, NH4–Y and Na–Y were confirmed by
PXRD (Supporting Information, Fig. S1). Unit cell parameters deter
mined from a unit cell refinement by chekcell software [26] are also
presented in the Supporting Information (Table S1). XRF spectrometry
confirmed the Si/Al ratios of NH4–Y (2.8(1)) and Na–Y (2.7(1)) are
equivalent within error. The bulk Si/Al ratio of H–Y (2.7(1)) is within
error of the parent material NH4–Y (2.8(1)); however, intrapore
aluminium-containing species are known to form during the calcination
of NH4–Y [27]. The framework Si/Al ratio of H–Y determined from
deconvoluted integrals in the 29Si MAS NMR spectrum is 4.7, attesting
dealumination of the framework and the formation of intrapore
aluminium-containing species. The 29Si MAS NMR spectrum recorded
on H–Y along with peak positions, assignments and integrals may be
found in the Supporting Information (Fig. S2 and Table S2). Scanning
electron micrographs of NH4–Y, Na–Y and H–Y confirm a similar particle
dispersity in each sample, generally spanning 0.3–2.0 μm for discrete
particles with some larger aggregates also present (Supporting Infor
mation, Fig. S3).
Fig. 1. A plot of equilibrium fluoride loading (mg F− /g), by zeolites H–Y,
NH4–Y and Na–Y, at different temperatures as a function of initial fluoride
concentration (ppm F− ).
3
D.S. Parsons et al.
Microporous and Mesoporous Materials 307 (2020) 110470
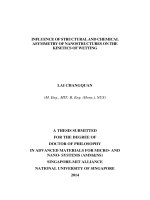
Fig. 3. Equilibrium fluoride loadings attained by Na–Y from NaF solutions
(brown) and 1:1: NaF: HNO3 solutions (yellow) as a function of initial F−
concentration. (For interpretation of the references to colour in this figure
legend, the reader is referred to the Web version of this article.)
Fig. 2. Plot of Na+ and F− equilibrium ion loadings achieved for H–Y and
NH4–Y at 25 ◦ C.
the essential role of H+ in fluoride adsorption by zeolites.
The influence of protons on fluoride uptake has been further
demonstrated by measuring fluoride loadings from acidic solutions. The
pH of 60 ppm F– NaF solutions were reduced to 4.1, 3.5 and 3.0 by the
addition of 0.1 M HNO3; fluoride loadings attained by Na–Y, H–Y and
NH4–Y at 25 ◦ C from these solutions were measured and the results are
plotted in Fig. S5 in the Supporting Information. A moderate increase in
fluoride loading is observed for all zeolites upon lowering the pH from
6.7 to 4.1, with a further increase in loading upon reducing the pH to
3.5. In the case of NH4–Y and Na–Y, a yet higher fluoride loading may be
achieved at pH = 3.0; however, the fluoride loading attained for H–Y
decreases upon lowering the pH from 3.5 to 3.0. Critically, fluoride
uptake is observed for Na–Y in acidic media but not in near neutral
solutions (pH = 6.7), further supporting the essential role of Brønsted
acids in the fluorination of the zeolites.
respectively, of the same supernatant solutions. In Fig. 2 lines join the
data points to add clarity in areas where they are proximal. Fig. 2 shows
that at each concentration for each zeolite, a higher Na+ concentration is
exchanged into the zeolite than the F− concentration that is adsorbed to
it, hence the concentration of H+ or NH+
4 ions released by ion-exchange
is greater than the amount of F− adsorbed. Consequently, a stoichio
metric equivalence of H+ or NH+
4 ions migrate to the surface, where they
may participate in fluoride adsorption.
XRF spectrometry performed on the zeolites, NH4–Y and H–Y,
following treatment with 60 ppm F– NaF solutions at 25 ◦ C and 40 ◦ C for
24 h further attests that ion exchange occurs between the aqueous Na+
+
ions and intrapore NH+
4 or H ions. A Na/Al ratio of 0.11(2) was
measured for fluorinated H–Y samples treated at both 25 ◦ C and 40 ◦ C.
Slightly higher Na/Al ratios of Na/Al = 0.13(2) and Na/Al = 0.14(2)
were measured for NH4–Y treated at 25 ◦ C and 40 ◦ C, respectively.
Moreover, the Si/Al ratios measured for each fluorinated zeolite, at each
temperature, agree with the Si/Al ratios measured for the parent ma
terials within error. A Si/Al ratio of 2.7(1) was measured for each NH4–Y
and H–Y species fluorinated at either 25 ◦ C or 40 ◦ C. While treating
zeolites with aqueous fluoride under driving conditions can often lead to
dealumination [28], XRF analysis indicates there is no discernible
dealumination occurring under the mild conditions employed in this
study.
The pH of the NaF solutions are near neutral ranging from pH = 6.9
at 5 ppm F− , decreasing slightly to pH = 6.7 at 60 ppm F− . Consequently,
the free [H+] concentration in solution is negligible compared with the
aqueous [F− ] concentration. The only source of protons to participate in
adsorption are Brønsted acidic intrapore cations released following ionexchange with Na+. The essential role of a proton source in fluoride
adsorption on the zeolites has been further confirmed by measuring
fluoride loadings for Na–Y from fluoride solutions containing an
equivalent source of protons. The fluoride loadings achieved by Na–Y
from 1:1 NaF:HNO3 solutions and pure NaF solutions are plotted in
Fig. 3. Appreciable fluoride loadings are achieved by Na–Y when an
equivalent source of H+ is present in solution, whereas no fluoride is
adsorbed from pure NaF solutions at near neutral pH, further supporting
3.4. H–Y and NH4–Y: Dubinin-Radushkevitch (DR) isotherm
Good fits are observed to the linear DR equation for both zeolites at
both temperatures, with R2 > 0.988 in each case (plots presented in
Fig. 4, and R2 values and Ec values from the fits listed in Table 1). The DR
isotherm is arguably the most informative model commonly applied to
solid-liquid adsorption as it permits the determination of the charac
teristic adsorption energy (Ec), also termed the free energy of sorption,
providing good fits are observed. The magnitude of Ec is indicative of the
strength, and nature, of adsorption occurring; in instances where Ec < 8
kJ mol− 1, adsorption is attributed to physical adsorption, whereas
values in the range 8 < Ec < 16 kJ mol− 1 are often ascribed to chemical
adsorption [14]. The values of Ec calculated from the gradient (K) by the
relationship, Ec = 2K− 0.5, are presented in Table 1. The magnitude of Ec
for H–Y, at both 25 and 40 ◦ C, indicates chemisorption is the dominant
mode of adsorption taking place, intimating a chemical bond is being
formed between fluoride and the zeolite.
The free energy of sorption, Ec, for NH4–Y at 40 ◦ C (8.5 kJ mol− 1)
indicates chemisorption is taking place; however, at 25 ◦ C the value of Ec
for NH4–Y (7.5 kJ mol− 1) falls below 8 kJ mol− 1, which by convention
demarcates physical and chemical adsorption. Although the magnitude
of Ec indicates fluoride interacts by physisorption to NH4–Y at 25 ◦ C,
solid state NMR of NH4–Y fluorinated at 25 ◦ C, detailed later in Section
4
D.S. Parsons et al.
Microporous and Mesoporous Materials 307 (2020) 110470
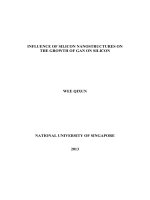
3.5. H–Y and NH4–Y: fluorine environments
Fluorine-19 MAS NMR spectra measured on H–Y and NH4–Y, fluo
rinated by contact with 200 ppm F– NaF solutions for 24 h at 25 ◦ C, are
presented in Fig. 5. Fluoride loadings of 29 and 20 mg F− /g were
measured for H–Y and NH4–Y, respectively, by a fluoride ISE calibrated
across the range 1–1000 ppm F− . The H–Y and NH4–Y fluorinated under
these conditions will hereon be referred to as H–Y(F) and NH4–Y(F). The
19
F MAS NMR spectra for H–Y(F) and NH4–Y(F) contain 3 distinct res
onances at approximately − 119, − 153 and − 176 ppm. Recording the
spectrum for H–Y(F) at different spin rates, 20 and 18 kHz, enabled
centrebands to be differentiated from spinning sidebands. All the in
tensity outside the range − 115 to − 180 ppm is produced by spinning
sidebands (denoted by asterisks in Fig. 5).
In the 19F MAS NMR spectra, peak B at − 153 ppm occurs at a
chemical shift commonly associated with [SiO3F] moieties in zeolites
and other silicates [15–18,29,30]. Peak B has an asymmetric profile in
both spectra. Peak fitting indicates there may be an additional resonance
at δF ≈ − 135 ppm in both spectra (Supporting Information), however
this does not account for all the observed peak asymmetry. The possible
origin of an additional resonance at δF ≈ − 135 ppm is covered later
(Section 3.9). The asymmetric profile may be indicative of multiple
signals in the region giving rise to one unresolved peak. Several signals
resulting from [SiO3F] moieties could be expected in the 19F MAS NMR
spectra on account of the 4 observed silicon environments in the 29Si
MAS NMR spectra of both H–Y (Supporting Information) and NH4–Y
(Section 3.6).
Peak C at δF ≈ − 176 ppm corresponds to those observed in a previous
study on H–Y fluorinated by incipient wetness impregnation followed by
high temperature treatment. 27Al NMR experiments, including 2D NMR,
in the study demonstrated the resonance was produced by fluorine
atoms bonded to 4 co-ordinate aluminium atoms, i.e. [AlO3F] [19].
Peak A at δF ≈ − 119 ppm occurs at a chemical shift often associated
with fluoride ions within the zeolite pores, but not within a cage, and
charge compensated by an intrapore cation [19,28,31,32]. In 19F NMR
spectra, aqueous fluoride ions in sodium fluoride solutions produce a
resonance at δF ≈ − 122 ppm [33], similar to the chemical shift observed
for intrapore fluoride within zeolites. As the anticipated environment of
both would comprise hydrated fluoride ions, the similar chemical shifts
are unsurprising. The charge on each intrapore fluoride ion must be
compensated by an additional intrapore cation, the associated cation
would be expected to migrate simultaneously into the framework with
the fluoride ion.
Ultimately, the dominant resonances in the 19F MAS NMR spectra of
H–Y(F) and NH4–Y(F) may be assigned to [SiO3F] and [AlO3F] moieties
Fig. 4. Plot of adsorption data fitted to the linear DR equation for H–Y
and NH4–Y.
Table 1
Characteristic sorption energies (Ec) and R2 for DR plots of H–Y and NH4–Y.
Zeolite
T (◦ C)
R2
Ec (kJ mol− 1)
H–Y
25
40
25
40
0.995
0.997
0.992
0.989
10.2
10.9
7.5
8.5
NH4–Y
3.5, shows fluoride reacts with, and forms a chemical bond to, the zeolite
framework. Ultimately, the 8 kJ mol− 1 value should be viewed as a
guideline and the value of Ec at 25 ◦ C reflects the lower favorability of
the reaction at lower temperatures, rather than a weaker interaction
with the adsorbent. The less favourable Ec values observed for NH4–Y,
compared with H–Y, may be because dissociation of the ammonium ion
must occur to provide the proton which mediates the fluorination
reaction.
Fig. 5. 19F MAS NMR spectra recorded on fluorinated NH4–Y (left) and H–Y (right). * denotes spinning sidebands. Peaks are labelled A, B and C as discussed in
the text.
5
D.S. Parsons et al.
Microporous and Mesoporous Materials 307 (2020) 110470
often appear co-incident with Q4 Si(nAl) resonances in 29Si MAS NMR
spectra [34]. In 29Si{1H} CP MAS NMR, magnetisation is transferred
from the 1H nuclei of the silanol moieties to the 29Si nuclei, enhancing
the intensity of Q3 Si resonances [34]. As all nominally assigned Q4 Si
(nAl) resonances, except Si(0Al), will have some Q3 Si(n-1Al) contri
bution, comparing changes in peak intensity in the 29Si{1H} CP MAS
NMR spectra between the parent material and fluorinated derivative
may intimate by which mechanism the reaction proceeds.
Fig. 7 depicts the 29Si{1H} CP MAS NMR spectra of NH4–Y and
NH4–Y(F), where intensity has been normalised such that the intensities
in the zeolite. The presence of these moieties following fluorination
further supports that fluoride interacts by “chemical adsorption”,
reacting with the zeolite framework, as indicated previously by
adsorption energies derived from fitting to the DR isotherm. Indeed, the
presence of these environments in NH4–Y(F), fluorinated at 25 ◦ C,
confirms that chemisorption is occurring despite the lower than ex
pected Ec value. It appears the presence of extra-framework aluminiumcontaining species within H–Y do not affect the interaction between the
zeolite and fluoride, as the resonances present in the 19F MAS NMR
spectra are the same for both H–Y and NH4–Y. 19F MAS NMR also reveals
the migration of small quantities of NaF ion-pairs into the zeolite, as
evidenced by the resonance attributed to intrapore fluoride.
3.6. Fluorination mechanism
Assignments in the MAS NMR spectra of H–Y(F) and NH4–Y(F)
indicate that fluoride reacts with the zeolite framework to form [SiO3F]
and [AlO3F] moieties. The acid-mediated fluorination of zeolite frame
works to produce these moieties may proceed by two plausible mecha
nisms, illustrated in Fig. 6. Mechanism 1 depicts the substitution of
fluoride at surface hydroxyl groups (either silanol or aluminol) pro
ceeding by the protonation of the hydroxyl group followed by the
elimination of water, enabling fluoride to form a bond to silicon or
aluminium. Alternatively, the addition of H+F− ion-pairs across T-O-T
bonds could also lead to fluorination of the framework as illustrated in
mechanism 2 in Fig. 6. Critically, mechanism 1 would lead to a
commensurate decrease in surface hydroxyl moieties with increasing
fluoride loading, whereas the reaction proceeding by mechanism 2
would lead to a corresponding increase in the surface hydroxyl con
centration with increasing fluoride loading. This distinction may be
exploited to determine which mechanism is occurring by measuring 29Si
{1H} cross-polarised MAS NMR (CP MAS NMR) spectra on the fluori
nated zeolites.
In the 29Si MAS NMR spectra of zeolites, Q3 Si(nAl) resonances
typically appear at a chemical shift a few ppm downfield of the corre
sponding Q4 Si(nAl) resonance. Consequently, Q3 Si(n-1Al) resonances
Fig. 7. Normalised
29
Si{1H} CP MAS NMR spectra for NH4–Y and NH4–Y(F).
Fig. 6. Possible mechanisms for the fluorination of zeolite frameworks.
6
D.S. Parsons et al.
Microporous and Mesoporous Materials 307 (2020) 110470
of the Si(0Al) peaks (δSi ≈ − 106 ppm) are equivalent in both spectra to
allow comparisons on differing intensities in the other peaks. In the
spectra in Fig. 7, the Si(1Al), Si(2Al) and Si(3Al) peaks occur at δSi ≈
− 101, − 96 and – 90 ppm, respectively. A decrease in the intensity of the
Si(1Al) and Si(2Al) peaks is apparent for NH4–Y(F), compared with the
parent material, NH4–Y, indicating the silanol concentration decreases
following fluorination, and therefore the reaction likely proceeds by
mechanism 1, the substitution of fluoride at surface hydroxyl moieties. A
downfield shift is observed in the Si(1Al), Si(2Al) and Si(3Al) peaks of
NH4–Y(F), compared with the peak positions in the NH4–Y spectrum,
with the magnitude of the shift increasing with increasing n. The origin
of this shift is unclear but may relate to the different intrapore cation
concentration in NH4–Y(F), resulting from ion exchange between
aqueous Na+ and intrapore NH+
4 during the treatment.
3.9. Mx(NH4)1-2x-Y: fluorine environment
Fluorine-19 MAS NMR spectra recorded for Mx(NH4)1-2x-Y species,
treated with 60 ppm F– NaF solutions for 24 h at 25 ◦ C, are presented in
Fig. 10. The approximate chemical shifts for resonances 1–4 (as labelled
in Fig. 10) in each spectrum are listed in Table 4. The spectra recorded
on NH4–Y partially exchanged with alkaline earth metals (Mg, Ca, Sr and
Ba) resemble the spectrum for the fluorinated parent material (NH4–Y
(F)): all contain the same 3 peaks at similar chemical shifts within the
range − 115 to − 180 ppm with some spinning sidebands outside this
range. The only significant difference is the appearance of an additional
peak (2) at δF ≈ − 135 ppm in the spectra for all Mx(NH4)1-2x-Y species.
While there is no distinct maximum at δF ≈ − 135 ppm in the
Ca0.17(NH4)0.66-Y(F) spectrum, peak fitting demonstrates there is a
resonance at this chemical shift (Supporting Information). Peak fitting
also indicates there is likely a resonance at δF ≈ − 135 ppm in the fluo
rinated parent material, NH4–Y(F); however, the estimated integral of
this resonance in the NH4–Y(F) spectrum is less than in spectra recorded
on fluorinated Mx(NH4)1-2x-Y species.
Peak 1 in the 19F MAS NMR spectra of fluorinated Mx(NH4)1-2x-Y
species corresponds to peak A at δF ≈ − 119 ppm in the NH4–Y(F)
spectrum and is therefore attributed to the intrapore fluoride environ
ment. Peak 3 corresponds to the [SiO3F] resonance which dominates the
NH4–Y(F) spectrum (peak B) at δF ≈ − 153 ppm, however in the
Mx(NH4)1-2x-Y spectra this resonance occurs at δF shifted downfield by
3–8 ppm. The higher chemical shift of the [SiO3F] resonance reflects
deshielding of the fluorine nuclei caused by the greater charge density of
the divalent intrapore cations. Peak 4 corresponds to the [AlO3F] reso
nance at δF ≈ − 176 ppm in the NH4–Y(F) spectrum (peak C); this
resonance also occurs at δF shifted downfield by 3–8 ppm, for analogous
reasons to peak 3. The relative intensity of the [AlO3F] peak appears to
be reduced compared with the corresponding intensity in the NH4–Y(F)
spectrum; the origin of this diminished intensity is not clear.
The origin of peak 2 observed at δF ≈ − 135 ppm in all spectra is
unclear. The invariance of the chemical shift with different M2+ ions
within the system, and the likely presence of this environment in NH4–Y
(F), indicates the environment is not directly bonded to the M2+ ion
[35]. If present in Mx(NH4)1-2x-Y species, resonances for [SiO4F] moi
eties would be expected at δF ≈ − 135 ppm, approximately 10 ppm
downfield of the [SiO3F] resonances [5]; however, the 29Si MAS NMR
spectrum recorded on fluorinated Sr0.14(NH4)0.72-Y, (Supporting Infor
mation), shows no intensity in the region where five co-ordinate silicon
resonances would be expected (δSi ≈ − 145 ppm) [5]. It could be argued
that the proportion of silicon in five co-ordinate species would be too
low to give rise to a discernible peak in the spectrum; however, if only
40% of the fluoride adsorbed to Sr0.14(NH4)0.72-Y were bonded to silicon
in [SiO4F] moieties, this would correspond to ca. 1% of all silicon atoms
within the zeolite being present as [SiO4F] moieties. A discernible peak
would therefore be expected if [SiO4F] moieties were responsible for
peak 2; ultimately, it is unlikely these moieties are responsible for the
unassigned resonance. Furthermore, there is no satisfactory explanation
for how the [SiO4F] moiety may be produced in the fluorinated zeolites
by a proton-mediated process.
A resonance at δF ≈ − 135 ppm has been observed in fluorinated
derivatives previously, where the identity remained unsolved [15,16].
The [SiO2F2] moiety was put forward in each study as a candidate
responsible for the resonance, but no evidence for this assignment was
provided. For fluorination to proceed by the proposed mechanism,
[SiO2F2] could only be produced by substitution of fluoride for both
hydroxide components of geminal silanol moieties (i.e. [SiO2(OH)2]).
A new theoretical explanation for the unassigned resonance is that it
is caused by neighboring or proximal [SiO3F] groups. The presence of
[SiO3F] groups in close proximity could cause deshielding of the fluorine
nuclei and a consequent downfield shift in δF from the values typically
associated with [SiO3F] resonances. If sufficiently close, fluoride atoms
bonded to the framework could exert Coulombic repulsion on one
3.7. Mx(NH4)1-2x-Y: characterisation
The influence of intrapore cation on zeolite fluorination has been
further studied for zeolite Y containing divalent intrapore cations, as
divalent cations possess greater charge density than monovalent cations,
and the presence of divalent cations within channels lowers the overall
cation concentration thus increasing accessibility to guest species.
NH4–Y partially ion-exchanged with alkaline earth cations, Mx(NH4)12+
2+
2+
or Ba2+), have been characterised by PXRD
2x-Y (M = Mg , Ca , Sr
and XRF spectrometry. PXRD patterns and unit cell parameters may be
found in the Supporting Information. The extent of ion-exchange has
been quantified by XRF spectrometry; Table 2 contains the Si/Al and M/
Al ratios measured for Mx(NH4)1-2x-Y species, where x in the formula has
been determined for each species directly from the M/Al ratio.
3.8. Mx(NH4)1-2x-Y: fluoride loadings and DR isotherms
Equilibrium fluoride loadings (qe) attained across the concentration
range (5–60 ppm F− ) at 25 ◦ C for Mx(NH4)1-2x-Y species are plotted in
Fig. 8, for comparison loadings measured for the parent material,
NH4–Y, are also plotted. The partial exchange of M2+ in all cases leads to
enhanced equilibrium F− loadings achieved by the zeolite across the
entire concentration range. Analogous plots for equilibrium loadings at
40 ◦ C (Supporting Information) demonstrate modest increases in
loading upon increasing temperature.
Applying the linear DR equation to equilibrium uptake data for
Mx(NH4)1-2x-Y species leads to good agreement in all instances, with R2
> 0.988 for each species at both temperatures. DR plots at each tem
perature are presented in Fig. 9. R2 values for fits along with Ec calcu
lated for each plot are collated in Table 3. In each instance where a
divalent cation has been partially exchanged into NH4–Y, the charac
teristic fluoride adsorption energy is greater at 25 ◦ C than the value for
the parent material, NH4–Y (7.5 kJ mol− 1). For each Mx(NH4)1-2x-Y
species, increasing the temperature from 25 to 40 ◦ C leads to a further
increase in Ec. Modest increases are observed for Ca0.17(NH4)0.66-Y and
Sr0.14(NH4)0.72-Y upon increasing the temperature to 40 ◦ C (ca. 0.1–0.2
kJ mol− 1), whereas greater increases in Ec are observed upon increasing
the temperature for Mg0.15(NH4)0.70-Y and Ba0.21(NH4)0.58-Y.
Table 2
M/Al and Si/Al measured for Mx(NH4)1-2x-Y by XRF spectrometry.
Zeolite
M/Al
Si/Al
NH4–Y
Mg0.15(NH4)0.70-Y
Ca0.17(NH4)0.66-Y
Sr0.14(NH4)0.72-Y
Ba0.21(NH4)0.58-Y
–
0.15(1)
0.17(1)
0.14(1)
0.21(1)
2.7(1)
2.7(1)
2.7(1)
2.6(1)
2.6(1)
7
Microporous and Mesoporous Materials 307 (2020) 110470
D.S. Parsons et al.
Fig. 8. Equilibrium fluoride loadings achieved at 25 ◦ C by Mg0.15(NH4)0.70-Y and Ca0.17(NH4)0.66-Y (left), and Sr0.14(NH4)0.72-Y and Ba0.21(NH4)0.58-Y (right).
Fig. 9. DR plots for Mg0.15(NH4)0.70-Y and Ca0.17(NH4)0.66-Y (left), and Sr0.14(NH4)0.72-Y and Ba0.21(NH4)0.58-Y (right).
another through space, serving to distort the electron cloud and subse
quently affect the shielding of the fluorine nuclei. Furthermore, the
presence of fluorine substituents on neighboring silicon atoms in the
framework could lead to increased polarity of the Si–F bonds,
deshielding the fluorine nuclei through inductive effects. Comparable
downfield shifts (ca. 10 ppm) are observed in 19F NMR spectra upon the
introduction of fluorine substituents at neighboring carbon atoms in
fluoroalkanes [37].
If proximal [SiO3F] groups are responsible for the resonance, the
question of how the divalent cations promote reactivity at proximal
silanol groups is raised. It is surmised that a divalent cation on the
zeolite surface co-ordinates the fluoride ion prior to the reaction,
Table 3
R2 and Ec for fits to the linear DR equation for Mx(NH4)1-2x-Y.
Zeolite
T (◦ C)
R2
Ec (kJ mol− 1)
Mg0.15(NH4)0.70-Y
25
40
25
40
25
40
25
40
0.993
0.995
0.995
0.995
0.994
0.992
0.989
0.997
10.0
11.1
11.9
12.0
11.9
12.1
10.4
11.0
Ca0.17(NH4)0.66-Y
Sr0.14(NH4)0.72-Y
Ba0.21(NH4)0.58-Y
8
D.S. Parsons et al.
Fig. 10.
Microporous and Mesoporous Materials 307 (2020) 110470
19
F MAS NMR spectra of fluorinated Mx(NH4)1-2x-Y species as labelled. * denotes spinning sidebands. Peaks are labelled 1–4 as discussed in the text.
divalent cations promote the fluorination of zeolites without directly
coordinating the fluoride ions. A full understanding of how divalent
cations promote the reaction is hindered by the unassigned resonance in
the 19F MAS NMR spectra of the fluorinated zeolites.
It was reported in a study on defluoridation by a natural Ca/Na-STI
sample that ion-exchange between intrapore Ca2+ and aqueous Na+
followed by precipitation of CaF2 was responsible for observed fluoride
uptake [10]. 19F MAS NMR spectra recorded on alkaline-earth
exchanged zeolites (Mx(NH4)1-2x-Y) contain no resonance correspond
ing to MF2 species, which would be expected at − 107 (CaF2), − 83.2
(SrF2), − 196 (MgF2) and − 11.2 ppm (BaF2), respectively [35]. All MF2
species for M containing zeolites, except CaF2, have a greater solubility
than the highest fluoride concentration employed in these studies, as a
result ion-exchange between aqueous Na+ and intrapore M2+ could not
give rise to MF2 precipitation in these systems [36]. In the case of CaF2,
precipitation could occur from solutions with concentrations greater
than 7 ppm F− , provided a stoichiometric equivalence of Ca2+ were
present in solution. The absence of a resonance at δF ≈ − 107 ppm in the
19
F MAS NMR spectrum of Ca0.17(NH4)0.66-Y(F) confutes the calcium
fluoride precipitation theory.
Table 4
Approximate chemical shifts in19F MAS NMR spectra for Mx(NH4)1-2x-Y species
and NH4–Y.
Zeolite
δF (ppm)
NH4–Y
Mg0.15(NH4)0.70-Y
Ca0.17(NH4)0.66-Y
Sr0.14(NH4)0.72-Y
Ba0.21(NH4)0.58-Y
−
−
−
−
−
1
119
118
118
118
118
2
3
−
−
−
−
−
−
−
−
−
137
134
136
136
4
153
150
145
144
144
−
−
−
−
−
176
174
167
168
166
bringing the fluoride into close proximity to silanol moieties that may
neighbor the divalent cation, allowing a reactive intermediate to form
more readily. A divalent cation in a fixed position on the surface could
promote the reaction on two or more proximal silanol groups if they are
present, whereas in the absence of a divalent cation, reactivity at silanol
groups is expected to be random. Moreover, in the absence of divalent
cations, the Coulombic repulsion incurred by proximal fluoride ions may
prevent the formation of proximal [SiO3F] moieties in any significant
concentration. Naturally, the proximal [SiO3F] assignment, and how
divalent cations may promote reactivity at proximal silanol groups, re
mains only a theory unless empirically proven.
Except for the unassigned peak at δF ≈ − 135 ppm, which may also be
present in NH4–Y(F), the fluorine environments observed in fluorinated
Mx(NH4)1-2x-Y species correspond to those observed in NH4–Y(F), con
taining [SiO3F], [AlO3F] and intrapore fluoride. Critically, while higher
fluoride loadings and increased characteristic adsorption energies are
observed for Mx(NH4)1-2x-Y species, there is no evidence that the diva
lent cations directly co-ordinate the fluoride ions. It would appear the
3.10. MxNa1-2x-Y: fluoride loadings
MxNa1-2x-Y (M = Mg2+, Ca2+, Sr2+ or Ba2+) prepared by ionexchange, analogously to Mx(NH4)1-2x-Y, have been characterised by
PXRD and XRF spectrometry (Supporting Information). Equilibrium
fluoride loadings (qe) for MxNa1-2x-Y and Mx(NH4)1-2x-Y from 20 ppm F−
solutions at 25 ◦ C are listed in Table 5. Despite higher divalent metal
content in MxNa1-2x-Y compared with Mx(NH4)1-2x-Y, equilibrium
loadings for MxNa1-2x-Y are much lower than the analogous Mx(NH4)19
D.S. Parsons et al.
Microporous and Mesoporous Materials 307 (2020) 110470
change in the fluoride uptake measured for the divalent cation
exchanged forms of Na–Y compared with the parent material, with
comparatively low uptake observed for all MxNa1-2x-Y species. 19F MAS
NMR spectroscopy reveals no direct M-F bonds are formed in fluorinated
Mx(NH4)1-2x-Y species, nor are MF2 species precipitated, rather the re
action appears to proceed in the same manner as for NH4–Y evidenced
by resonances attributable to [SiO3F], [AlO3F] and intrapore fluoride
species. An additional resonance of unknown origin is present at δF ≈
− 135 ppm in the 19F MAS NMR spectra; it has been postulated that the
resonance is caused by proximal [SiO3F] moieties with a downfield shift
in δF caused by, either or both, through space Coulombic repulsion be
tween near fluorine atoms and inductive effects leading to deshielding of
the fluorine nuclei. A theory has been put forward for how M2+ cations
could promote fluoride reactivity at adjacent silanol moieties; however,
the assignment remains unproven. Ultimately, it appears the H+-medi
ated mechanism for fluorination is also responsible for the observed
uptake in Mx(NH4)1-2x-Y species. While there is no evidence to suggest
that the divalent metal ion directly co-ordinates fluoride, the presence of
divalent intrapore cations nevertheless increase the observed fluoride
loadings and characteristic adsorption energies, therefore promoting
reactivity between fluoride and the zeolite framework.
Table 5
Equilibrium fluoride loadings achieved by MxNa1-2x-Y and Mx(NH4)1-2x-Y from
20 ppm F– NaF solutions at 25 ◦ C.
M
qe, MxNa1-2x-Y (mg
g− 1)
qe, Mx(NH4)1-2xY
% (qe, MxNa1-2x-Y)/(qe,
Mx(NH4)1-2x-Y)
(mg g− 1)
Mg
Ca
Sr
Ba
0.11
0.14
0.07
0.12
1.88
2.74
2.64
1.92
5.9
5.1
2.6
6.3
2x-Y
species with equilibrium loadings for MxNa1-2x-Y corresponding to
between 2.6 and 6.3% of the loadings attained for Mx(NH4)1-2x-Y. As the
pH of the solutions are near neutral (pH = 6.8) and there is no proton
source, this further supports the essential role of a proton source in
mediating fluoride uptake in the divalent substituted zeolites.
While the fluoride loadings achieved for MxNa1-2x-Y species are low
compared with the loadings for Mx(NH4)1-2x-Y under the same condi
tions, there is still detectable fluoride uptake for MxNa1-2x-Y which is not
observed for the parent compound Na–Y under the same conditions. As
there is no H+ source, the only fluoride environment observed in
Mx(NH4)1-2x-Y species that would be anticipated in the Na analogues is
the intrapore fluoride environment. The presence of this environment in
MxNa1-2x-Y but not in Na–Y may be rationalised by the greater accessi
bility to the pores afforded by lower intrapore cation concentrations,
allowing the migration of Na+F− ion pairs into the framework. Intrapore
fluoride ions being responsible for the observed uptake in MxNa1-2x-Y
remains supposition, however, as NMR experiments have not been
performed on fluorinated MxNa1-2x-Y species to confirm this assignment,
due to the low fluoride content and long experiment durations required
to obtain informative spectra.
Declaration of competing interest
The authors declare that they have no known competing financial
interests or personal relationships that could have appeared to influence
the work reported in this paper.
Acknowledgements
This work was supported by the Schools of Chemistry and Chemical
Engineering at the University of Birmingham.
4. Conclusions
Appendix A. Supplementary data
NH4–Y and H–Y exhibit reactivity with aqueous fluoride, whereas
Na–Y does not. The importance of a H+ source in mediating the fluori
nation reaction between the zeolite and fluoride has been established.
Moreover, by employing 19F MAS NMR spectroscopy to probe the local
environment, it has been determined that fluoride reacts with the
framework forming four co-ordinate fluorine containing species,
[SiO3F] and [AlO3F]. A minor amount of fluoride is also present as
fluoride ions in the pores, suggesting the migration of some Na+F− ionpairs into the zeolite. 29Si{1H} CP MAS NMR spectra have been used to
differentiate between two plausible mechanisms for the fluorination
reaction in NH4–Y, intimating the reaction proceeds by substitution of
fluoride at surface hydroxyl groups, the same mechanism by which
fluorination is reported to proceed in hydrothermal and high tempera
ture treatments on other zeolites, as inferred in those reports by IR
spectroscopy [15,21].
Findings on the fluorination of zeolite frameworks have important
implications on the potential application of zeolites in defluoridation, as
the environmental remediation of excess aqueous fluoride from solu
tions with typical concentrations 20–50 ppm fluoride is desirable [8,14].
Here, the efficacy of H+ and NH+
4 -bearing zeolite Y in fluoride uptake
from solutions in this concentration range has been demonstrated. In
addition, the fluorination of zeolites under mild conditions, 25 ◦ C and
200 ppm fluoride solutions, has achieved significant loadings (ca. 2 wt
%) for zeolites containing acidic intrapore cations. These conditions
achieve loadings comparable with those reported for fluorinated zeolites
prepared for catalytic applications [18], yet under significantly milder
and safer conditions.
Partial ion-exchange of alkaline earth divalent cations (Mg2+, Ca2+,
Sr2+ and Ba2+) into NH4–Y leads to enhanced fluoride loadings achieved
and an increase in the characteristic adsorption energy in all cases,
compared with the parent material (NH4–Y). In contrast, there is little
Supplementary data to this article can be found online at https://doi.
org/10.1016/j.micromeso.2020.110470.
References
[1] A. Corma, M.J. Diaz-Cabanas, F. Rey, Chem. Commun. (2003) 1050–1051, https://
doi.org/10.1039/b212477g.
[2] M. Estermann, L.B. McCusker, C. Baerlocher, A. Merrouche, H. Kessler, Nature 352
(1991) 320–323, />[3] M. Hernandez-Rodriguez, J.L. Jorda, F. Rey, A. Corma, J. Am. Chem. Soc. 134
(2012) 13232–13235, />[4] P.A. Barrett, M. Camblor, A. Corma, R.H. Jones, L.A. Villaescusa, J. Phys. Chem. B
102 (1998) 41474155, />[5] H. Koller, A. Wă
olker, H. Eckert, C. Panz, P. Behrens, Angew. Chem. Int. Ed. 36
(1997) 2823–2825, />[6] M.A. Camblor, M.J. Diaz-Cabanas, J. Perez-Pariente, S.J. Teat, W. Clegg, I.
J. Shannon, P. Lightfoot, P.A. Wright, R.E. Morris, Angew. Chem. Int. Ed. 37 (1998)
2122–2126, />AID-ANIE2122>3.0.CO, 2-6.
[7] H. Koller, A. Woelker, L.A. Villaescusa, M.J. Diaz-Cabanas, S. Valencia, M.
A. Camblor, J. A. Chem. Soc. 121 (1999) 3368–3376, />ja9840549.
[8] M. Adem, T. Sani, Y. Chebude, G. Fetter, P. Bosch, I. Diaz, Bull. Chem. Soc. Ethiop.
29 (2015) 53–62, />[9] M. Maruthamuthu, A. Sivasamy, Fluoride 27 (1994) 81–88.
[10] L.G. Hortiguela, A.B. Pinar, J. Perez-Pariente, T. Sani, Y. Chebude, I. Diaz,
Microporous Mesoporous Mater. 193 (2014) 93–102, />micromeso.2014.03.014.
[11] Y. Sun, Q. Fang, J. Dong, X. Cheng, J. Xu, Desalination 277 (2011) 121–127,
/>[12] M.S. Onyango, Y. Kojima, A. Kumar, D. Kuchar, M. Kubota, H. Matsuda, Separ. Sci.
Technol. 41 (2006) 683–704, />[13] S. Samatya, U. Yuksel, M. Yuksel, N. Kabay, Separ. Sci. Technol. 42 (2007)
2033–2047, />[14] M.S. Onyango, Y. Kojima, O. Aoyi, E.C. Bernardo, H. Matsuda, J. Colloid Interface
Sci. 279 (2004) 341–350, />[15] X. Fang, Q. Wang, A. Zheng, Y. Liu, Y. Wang, X. Deng, H. Wu, F. Deng, M. He,
P. Wu, Catal. Sci. Technol. 2 (2012) 2433–2435, />c2cy20446k.
10
D.S. Parsons et al.
Microporous and Mesoporous Materials 307 (2020) 110470
[27] Y. Hong, J.J. Fripiat, Microporous Mater. 4 (1995) 323–334, />10.1016/0927-6513(95)00038-B.
[28] A. Bolshakov, N. Kosinov, D.E. Romero Hidalgo, B. Mezari, A.J.F. van Hoof, E.J.
M. Hensen, Catal. Sci. Technol. 9 (2019) 4239–4247, 10.1039/C9CY00593E.
[29] I. Ogino, M. Nigra, S. Hwang, J. Ha, T. Rea, S.I. Zones, A. Katz, J. Am. Chem. Soc.
133 (2011) 3288–3291, />[30] R.E. Youngman, S. Sen, J. Non-Cryst. Solids 349 (2004) 10–15, />10.1016/j.jnoncrysol.2004.03.122.
[31] L. Delmotte, M. Soulard, F. Guth, A. Seive, A. Lopez, T.L. Guth, Zeolites 10 (1990)
778–783, />[32] G. Zhang, B. Wang, W. Zhang, M. Li, Z. Tian, Dalton Trans. 45 (2016) 6634–6640,
/>[33] E.Y. Chekmenev, S.K. Chow, D. Tofan, D.P. Weitekamp, B.D. Ross, P. Bhattacharya,
J. Phys. Chem. B 112 (2008) 6285–6287, />[34] G. Engelhardt, U. Lohse, A. Samoson, M. Magi, M. Tarmak, E. Lippmaa, Zeolites 2
(1982) 59–62, />[35] A. Zheng, S. Liu, F. Deng, J. Phys. Chem. C 113 (2009) 15018–15023, https://doi.
org/10.1021/jp904454t.
[36] D.R. Lide (Ed.), CRC Handbook of Chemistry and Physics, 73rd ed, CRC Press, Boca
Raton, FL, 1973.
[37] H.P. Ebrahimi, M. Tofazzoli, Concepts Magn. Reson. 40 (2012) 192–204, https://
doi.org/10.1002/cmr.a.21238.
[16] X. Fang, Q. Wang, A. Zheng, Y. Liu, L. Lin, H. Wu, F. Deng, M. He, P. Wu, Phys.
Chem. Chem. Phys. 15 (2013) 4930–4938, />[17] Y. Yang, J. Ding, B. Wang, J. Wu, C. Zhao, G. Gao, P. Wu, J. Catal. 320 (2014)
160–169, />[18] X. Lu, W. Zhou, Y. Guan, A. Liebens, P. Wu, Catal. Sci. Technol. 7 (2017)
2624–2631, />[19] H.M. Kao, Y. Liao, J. Phys. Chem. C 111 (2007) 4495–4498, />10.1021/jp070739w.
[20] R. Le Van Mao, T.S. Le, M. Fairbairn, A. Muntasar, S. Xiao, G. Denes, Appl. Catal., A
185 (1999) 41–52, />[21] S. Kowalak, E. Szymkowiak, M. Laniecki, J. Fluor. Chem. 93 (1999) 175–180,
/>[22] D.S. Parsons, A. Ingram, J.A. Hriljac, MRS Adv 4 (2019) 21–26, />10.1557/adv.2018.635.
[23] K.Y. Foo, B.H. Hameed, Chem. Eng. J. 156 (2010) 2–10, />cej.2009.09.013.
[24] Q. Hu, Z. Zhang, J. Mol. Liq. 277 (2019) 646–648, />molliq.2019.01.005.
[25] J.G. Reynolds, J.D. Belsher, J. Chem. Eng. Data 62 (2017) 1743–1748, https://doi.
org/10.1021/acs.jced.7b00089.
[26] J. Laugier, B. Bochu, LMGP Suite of Programs, Laboratoire des Mat´
eriaux et du
G´enie Physique, France, 2002.
11