Thermal kinetics of free volume in porous spin-on dielectrics: Exploring the network- and pore-properties
Bạn đang xem bản rút gọn của tài liệu. Xem và tải ngay bản đầy đủ của tài liệu tại đây (2.23 MB, 10 trang )
Microporous and Mesoporous Materials 308 (2020) 110457
Contents lists available at ScienceDirect
Microporous and Mesoporous Materials
journal homepage: />
Thermal kinetics of free volume in porous spin-on dielectrics: Exploring the
network- and pore-properties
A.G. Attallah a, b, *, N. Koehler c, M.O. Liedke a, **, M. Butterling a, E. Hirschmann a, R. Ecke d, S.
E. Schulz c, d, A. Wagner a
a
Helmholtz-Zentrum Dresden-Rossendorf, Institute of Radiation Physics, 01328, Dresden, Germany
Physics Department, Faculty of Science, Minia University, P.O. 61519, Minia, Egypt
Center for Microtechnologies, Chemnitz University of Technology, 09126, Chemnitz, Germany
d
Fraunhofer ENAS, Technology-Campus 3, 09126, Chemnitz, Germany
b
c
A R T I C L E I N F O
A B S T R A C T
Keywords:
In-situ curing
Positron annihilation spectroscopy
Porogen removal
Porosimetry
FTIR
Ultra-low-k Dielectric
Dielectrics
Pore size distribution
Positronium
Comprehensive ex-situ and in-situ investigations of thermal curing processes in spin-on ultra-low-k thin films
conducted by positron annihilation spectroscopy and Fourier transform infrared spectroscopies are presented.
Positron annihilation lifetime spectroscopy of ex-situ cured samples reveals an onset of the curing process at
about 200 ◦ C, which advances with increasing curing temperature. Porogen agglomeration followed by diffusive
migration to the surface during the curing process leads to the generation of narrow channels across the film
thickness. The size of those channels is determined by a pore size distribution analysis of positron lifetime data.
Defect kinetics during in-situ thermal curing has been investigated by means of Doppler broadening spectroscopy
of the annihilation radiation, showing several distinct partially superposed and subsequent curing stages, i.e.,
moisture and residual organic solvents removal, SiOx network cross-linking, porogen decomposition, and finally
creation of a stable porous structure containing micropore channels interconnecting larger mesopores formed
likely due to micelle like interaction between porogen molecules, for curing temperatures not larger than 500 ◦ C.
Static (sequencing curing) states captured at specific temperature steps confirm the conclusions drawn during the
dynamic (continuous curing) measurements. Moreover, the onset of pore inter-connectivity is precisely estimated
as pore interconnectivity sets in at 380–400 ◦ C.
1. Introduction
The functioning operation and performance of Integrated Circuits
(IC) strongly depend on the properties of their main building blocks, i.e.,
conductors, transistors, and insulators (dielectrics). Due to the contin
uous increase of transistor densities integrated in modern microchips
and their decreasing size, the main research focused on methods to
lower the dielectric constant (k) [1–5]. The scaling-down of microchip
dimensions towards Ultra Large-Size Integration (ULSI) results in an
enlarged Resistance-Capacitance (RC) delay time, which strongly limits
the microchip’s functionality [6–8]. Cu wiring in the
Back-End-Of-the-Line (BEOL) process replaced Al [9,10] reduced the
electrical resistance by 40% [1]. Moreover, different strategies have
been proposed in order to reduce the dielectric constant of the interlayer
dielectric (ILD) materials [2], e.g., adding less polarized organic groups
(F or C doped) with widening of the network and incorporating porosity
into SiO2 [11]. Notably, the introduction of porosity (effective reduction
of density) is crucial for fabricating ultra-low-k (ULK) films with k ≤ 2.0,
due to presence of air (kair/vacuum = 1.0) in the solid phase.
Porous low-k materials could be deposited by plasma enhanced
chemical vapor deposition (PECVD) or by spin-on processes [5,12–16].
For both processes, there are different precursors for the network
building and for the formation of porogen [5,17] In every case, the
curing process is critical for achieving a good control of the final film
structure and the resulting film properties. The curing enhances the
matrix crosslinking structure which is correlated to better mechanical
stability of the ULK and the formation of pore structure by removal of
porogen. Mainly in industry fabrication process, the curing is a combi
nation of thermal processes – necessary for the network formation, and
UV treatment – for more efficient porogen removal [18,19]. However,
* Corresponding author. Helmholtz-Zentrum Dresden-Rossendorf, Institute of Radiation Physics, 01328, Dresden, Germany.
** Corresponding author.
E-mail addresses: (A.G. Attallah), (M.O. Liedke).
/>Received 27 May 2020; Received in revised form 30 June 2020; Accepted 1 July 2020
Available online 29 July 2020
1387-1811/© 2020 The Authors.
Published by Elsevier Inc.
This is
( />
an
open
access
article
under
the
CC
BY-NC-ND
license
A.G. Attallah et al.
Microporous and Mesoporous Materials 308 (2020) 110457
the experiences in the introduction of porous low-k materials in the
interconnect systems identify operational and reliability problems
[20–22]. On the hand these problems are attributed to the weaker
network and the porosity in principle, but on the other hand on not
optimal curing processes. Subsequent following processes after ULK
deposition and curing with temperature and/or UV radiation leads to
further out diffusion of gaseous components and film cracking. Because
of that it is necessary to have a deeper insight in the kinetic of the curing
process.
Contrary to CVD, the porogen is not chemically incorporated and is
much easier removable by thermal activation. In this manner a single
kinetic processes, i.e., thermal curing, is sufficient for the network
(vitrification) and pore formation - with pore agglomeration, porogen
decomposition and out diffusion – which are partly superposed.
Conventional porosimetry methods like gas adsorption and mercury
intrusion are not reliable for characterizing ~500 nm-thick films
because they lose their sensitivity in thin films (less than 1 μm thickness)
which are applied on a Si wafer [23]. Ellipsometric porosimetry (EP) and
X-ray porosimetry (XRP) can be used for characterizing such thin films.
While the EP method quantifies the refraction index of the absorbent
(toluene) to get the pore size distribution [24], XRP detects absorbent
density increase. EP and XRP are only suitable to determine open
porosity and depth profiling is not possible. In order to overcome such
drawbacks, we chose positron annihilation spectroscopy (PAS) using
positron beam-based sources, which allow depth-profiling porosimetry
of open and closed pores in thin films [25,26].
The presented work explores thermal curing processes in spin-on
porous dielectrics utilizing ex-situ and in-situ experimental methods.
The fundamental issues will be addressed here: (i) the mechanism of
pore formation during porogen removal, (ii) the temperature threshold
of porogen diffusion and agglomeration, as well as (iv) volumetric
diffusion restrictions, e.g. channels connecting pores in the bulk with the
surface. Addressing these questions is extremely important in order to
formulate recipes for controlling pore sizes, to prevent pore inter
connectivity and accessibility to the surface, and even to support the
introduction of state-of-the-art porous dielectrics for future integration
processes.
studied as a function of temperature from T = 100 ◦ C–450 ◦ C. The curing
time was fixed to 30 min.
2.2. Methods
2.2.1. FTIR
Fourier-transform infrared spectroscopy (FTIR) was used to deter
mine the chemical and structural changes after ex-situ annealing at
different temperatures. The measurements were performed in trans
mission mode in the spectral mid-range from 400 to 4000 cm− 1, using a
Bruker Tensor 27 spectrometer. The optical response was given as
absorbance after a baseline subtraction. According to the Beer-Lambert
law, the absorbance is proportional to the molar concentration of
chemical species and the sample thickness. Therefore, all spectra were
normalized by the initial thickness in order to quantify changes in
bonding arrangements, which are important since curing introduces a
high loss in thickness. The thickness was measured with a Sentech SE
850 spectral ellipsometer in a wavelength range from 380 nm to 830 nm
at a constant angle of 70◦ . The film thickness was calculated by a Cauchy
model [28]. Selected peak areas were integrated for the characterization
of temperature driven processes.
2.2.2. PAS
In materials, the journey of injected positrons (e+) starts with ther
malization, followed by diffusion, then annihilation realized by emission
of two 511-keV γ quanta. During e+ diffusion in porous materials, it has
the ability to form a positron-electron (e+-e-) hydrogen-like bound state
known as Positronium (Ps) [29–31]. Depending on the relative spin
orientations of e+ and e− , a singlet state (para-Ps; p-Ps) and a triplet state
(ortho-Ps (o-Ps) are formed. The intrinsic vacuum lifetimes of p-Ps and
o-Ps are 125 ps and 142 ns, respectively. The lifetime of the short-lived
p-Ps is not significantly affected by molecular electrons but that of the
long-lived o-Ps is. o-Ps collides with pore walls and when it exchanges
the electron with an e− of antiparallel spin orientation, the annihilation
lifetime is reduced as an inverse function of the pore size. A correlation
between this collisionally-reduced o-Ps lifetime and the pore size was
firstly described in the Tao-Eldrup (TE) model [32,33] for small pores (R
< 1 nm) and later expanded for large pore sizes and at different tem
peratures in the rectangular TE (RTE) model [34].
Considering the energy balance of the annihilation process, p-Ps
annihilates by 2γ photons mode (each of 511 keV) while o-Ps annihila
tion (under vacuum or in large pores) gives 3γ photons with each of
them having an energy distribution extending from 0 to 511 keV [35]. In
2γ annihilation, the energies of the annihilation photons are broadened
due to the electronic momentum at the annihilation site (assuming zero
velocity of the thermalized positrons). This energy broadening is
measured by Doppler broadening spectroscopy (DBS) which is charac
terized by two shape parameters, S and W. The S-parameter is a measure
of the ratio between the central region of the photopeak and the com
plete broadened peak area, while the W-parameter represents the counts
in the wings (tails) of the spectrum divided by the total area below the
peak. In defective sites, the electronic density is low and hence the
probability of annihilation with valence electrons is higher than with
core electrons. Accordingly, the yield is increased in the central region of
the spectrum because of the larger fraction of low momentum electrons
(valence electrons) [36] causing a higher S-parameter. By definition, the
S-parameter represents annihilation of free and bound positrons [35],
where the latter is related to the pick-off and p-Ps annihilation [37]. On
the other hand, the W-parameter describes positron annihilation with
core (high momentum) electrons and it characterizes the chemical sur
rounding at the annihilation site. For better understanding of the
chemical environment at the annihilation site we employed coincidence
Doppler broadening spectroscopy (cDBS). cDBS is able to show very
small changes in W-parameter as discussed later. In case of connected
pores towards the samples surface or relatively large pores (>50 nm),
the self-annihilation (3γ) probability of o-Ps increases and the counts in
2. Experimental details
The curing process of spin-on ULK films has been investigated by
positron annihilation lifetime spectroscopy (PALS), Doppler broadening
spectroscopy (DBS), coincidence DBS (cDBS), and Fourier-transform
infrared spectroscopy (FTIR). First, the results of the ex-situ curing by
PALS, cDBS, and FTIR at several different temperatures are presented in
order to estimate the onset of porogen decomposition and effects of
temperature on the created pore sizes. However, the ex-situ curing gives
not so deep insights about kinetics of the curing process. Therefore, in
the second part of this paper, the in-situ curing of the ULK films by DBS is
presented. For better understanding of the film’s chemical composition,
cDBS of annihilation radiation has been utilized.
2.1. Materials
The chemicals used for the spin-on organo-silicate glasses were
provided by SBA Materials, Inc with k = 2.2. The liquid precursor
consists of silicon alkoxide esters dissolved in a suitable organic solvent
and an amphiphilic block copolymer acting as pore generator [27]. The
solute was spin-coated on 6-inch silicon wafers with 2000 rpm for 60 s
for 500 nm thick films. The spin-coated samples were then soft baked for
120 s at 150 ◦ C on a hot plate at ambient air. The soft bake remove the
majority of spinning solvent and the tackiness of the film. Then the
wafers were cut in small samples of 2 × 2 cm before the curing process.
The proper curing process were carried out in a quartz glass furnace
under nitrogen atmosphere and with a heating ramp of 10 ◦ C/min. The
investigation of pore- and network formation during thermal curing was
2
A.G. Attallah et al.
Microporous and Mesoporous Materials 308 (2020) 110457
the energy spectrum for energies well below 511 keV increases. So, the
3γ/2γ ratio of energy spectra [38] shows variations in pore sizes
(qualitatively) and it can visualize the pore interconnectivity [38].
Depth-profiling of ex-situ and in-situ cured ULK thin films has been
performed at the slow positron beam-based facilities; MePS1 (for PALS
measurements), and SPONSOR2 and AIDA3 (for DBS and cDBS
measurements).
PALS: The MePS system is a beamline at the user-facility ELBE
dedicated to probe open volume defects in thin films by means of PALS.
The positron beam is generated from a 35 MeV electron beam via
bremsstrahlung and pair production in a W converter [39]. The positron
lifetime measurement utilizes a CeBr3 scintillation detector with an
overall timing resolution down to ~210 ps at FWHM and count-rates of
about 100 kcps. A Y2O3-stabilized ZrO2 (YSZ) reference sample with a
well-known single positron annihilation lifetime of ~181 ps has been
used to determine the timing resolution. PALS measurements of the ULK
films were performed by using positron implantation energies, EP, from
1 keV to 12 keV for depth profiling. Prior to PALS experiments, all
samples were in-situ annealed at 150 ◦ C for 30 min at ~1 × 10− 6 mbar to
purge the pores from moisture adsorbed during or after preparation. A
discrete data analysis has been performed by the PALSfit3 routine [40]
while the MELT code [41] has been used for calculating continuous
lifetime distributions. Spectra with 1 × 10⁷ total counts were used for
the former and 3 × 10⁷ counts for the latter, respectively. The pore size
was derived using the EELViS4 code [42].
DBS and cDBS: A high-purity Ge detector with an energy-resolution
of (1.09 ± 0.01) keV at 511 keV was used for DBS at the AIDA [43]
chamber for in-situ curing. The shape parameters S were calculated from
the central region of the peak with E = 511 ± 0.70 keV and the wing
parameter W was chosen as E = 511 ± 2.13 keV to E = 511 ± 2.74 keV.
Two-collinear high-purity Ge detectors (energy resolution of 780 ± 20
eV) of the SPONSOR [44] setup have been used to perform cDBS.
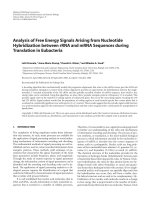
Fig. 1. FTIR spectra of uncured and cured samples at different curing tem
peratures. The baseline is corrected and data are normalized to a thickness of
500 nm.
Si–OH stretching in silanol. This peak undergoes a strong decrease until
250 ◦ C and disappears after 350 ◦ C curing in the FTIR spectra. The
silanol condensation contributes mainly to the crosslinking reaction by:
-Si–OH + -Si– OH → -Si–O–Si + H2O
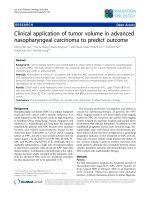
This is also reflected in Fig. 2b, the behavior of Si–OH and OH
(>3100 cm− 1) vibration peaks indicates that the Si–OH condensation
process takes place mainly between 100 ◦ C and 200 ◦ C and probably
completing around 300 ◦ C. The porogen removal becomes manifest in
the reduction of the peak area in the range of 3000 cm− 1 to 2800 cm− 1
[45–48]. There, different symmetrical and asymmetrical stretching
modes of CHx-bonds occur, which are indicative for porogen composi
tions. It must be kept in mind that spin-on solutions are a complex
mixture of chemicals, containing not only the network and porogen
precursor. For instance, chemicals to improve rheology during spin
coating are necessary. These chemicals mostly consist of similar struc
tures as the porogen itself and contributes to the symmetrical and
asymmetrical stretching modes of CHx-bonds inside the material.
Nevertheless, unlike the porogen, these chemicals are less temperature
stable and are removed at lower temperature regimes. Fig. 2 a shows
that the porogen removal is divided into two parts, where until T = 200
◦
C more that 80% of CHx-bonds are removed from the material. From
200 ◦ C until the final curing temperature is reached, a further >10%
decrease can be observed. Since from literature it is known, that the
porogen removal usually takes places at higher curing temperature
[49–52], the second part of the CHx-bond reduction is dedicated to the
porogen removal, whereas the first part until 200 ◦ C contributes to the
removal of remaining rheological chemicals.
The Si–CH3 peak between 1300 cm− 1 and 1200 cm− 1 was added,
because the relationship between Si–CH3 to Si–O absorption area in
dicates a change of mechanical properties. This happens due to the
SiCH3 bonds breakage, which potentially can initiate further conden
sation reactions [53]. The absorption from 900 cm− 1 to 700 cm− 1 be
longs to the fingerprint region, a complex structure of different Si-(CH3)x
and Si–O bonds [45]. This part of the spectrum is not included in the
discussion. The Si–CH3 peak in Fig. 2 d also increases with temperature.
At 450 ◦ C a small drop could be explained by CH group loss.
3. Results and discussion
3.1. Ex-situ curing
3.1.1. FTIR
The ULK films have been ex-situ cured in the temperature of T =
100–450 ◦ C (50 ◦ C steps) and then investigated utilizing FTIR technique.
Fig.S1 (supplementary materials) shows the thickness change of the
cured ULK samples as a function of temperature. The initial thickness of
~509 nm at the uncured state is reduced to ~336 nm after curing at 450
◦
C. The shrinkage of films is more than 30% making thickness normal
ization for FTIR spectroscopy analysis mandatory. Fig. 1 presents the
normalized FTIR spectra revealing a detailed overview of the
temperature-induced material changes. The obtained peaks where in
tegrated and compared to the uncured state to qualitatively demonstrate
the material changes. A strong bond is observed between 1000 and 1200
cm− 1 mostly assigned to SiO bond vibrations in Si–O–Si groups and is
equated with the matrix crosslinking structure. These bonds are strongly
developed by curing. The peak could be deconvoluted in 3 peaks, for a
cage like structure, suboxide and network [45]. In stoichiometric ther
mal oxides the bonding angle is reported to be ~144◦ with single FTIR
absorption around 1080 cm− 1. The material here has different bonding
angle from the ideal stoichiometry, ~140◦ for network peak around
1063 cm− 1, <140◦ for suboxide peak at 1023 cm− 1, is attributed to Si
atoms having one or more nonoxygen neighbors and ~150◦ for cage
structure at 1135 cm− 1.
The second region of interest is around 900 cm− 1 and represents the
1
2
3
4
(1)
3.1.2. PALS
In order to validate whether the formed pores display open (to the
surface and interconnected) or closed (isolated or possibly bottle neck
connected) porosity, two sample series without and with 20 nm carbon
cap layer have been investigated. The decomposition of PALS spectra of
Mono-energetic Positron Source.
Slow-Positron System of Rossendorf.
Apparatus for In-situ Defect Analysis.
Excited Energy Levels and Various Shapes.
3
A.G. Attallah et al.
Microporous and Mesoporous Materials 308 (2020) 110457
100
a) CHx bonds
Int. peak area (%)
Int. peak area (%)
100
80
60
40
20
0
0
100
200
300
400
60
OH
Si-OH
40
20
0
500
b) OH bonds
80
0
100
200
300
400
500
Curing temperature (°C)
160
220
150
200
c) SiO bonds
Int. peak area (%)
Int. peak area (%)
Curing temperature (°C)
140
130
120
110
d) SiCH3 bonds
180
160
140
120
100
100
0
100
200
300
400
500
0
Curing temperature (°C)
100
200
300
400
500
Curing temperature (°C)
Fig. 2. The percentage change of CHx bonds, OH bonds, SiO bonds, and SiCH3 with respect to the uncured sample, derived from integrated peak areas in selected
absorption bands (see Fig. 1).
the uncapped samples showed six lifetime (LT) components while the
capped samples revealed only five LT components. These LT compo
nents originate from the annihilation of: (1) p-Ps and free (unbound) e+
(τ1), (2) open volume defects in the matrix (τ2), (3) o-Ps in intrinsic
material (matrix) free volume (τ3), (4) o-Ps in micropores and porogen
(τ4), (5) o-Ps in the main mesopores (τ5), and (6) o-Ps escaping from the
pore network to vacuum (τ6). The existence of the 6th LT component in
the uncapped sample proves accessible voids, which allows for o-Ps
escaping into vacuum, whereas the cap layer prevents that process. The
veering away of o-Ps from the films is illustrated by the monotonic
decrease of the relative positron lifetime intensity (τ6 with increased
probing depth (supplementary Fig.S2). The escape of o-Ps results,
moreover, in an underestimation of the measured mesopore sizes and it
limits the observation of any changes during porogen removal (see
supplementary Fig.S2). Generally, in amorphous materials the first two
short-lived LT components have not well defined link to the free volume
size (free volume refers here to the pore, whereas as open volume we
define at other smaller defects), hence they will be excluded from the
following discussions of the pore evolution during curing. For clarity,
only results acquired for EP = 4 keV will be presented here. In the low
energy region up to EP = 3 keV the positron annihilation takes place
mostly at surface states and inside the cap layer (see the Makhov profile
in Fig.S3). Obviously, at EP = 4 keV most of the films (500-336 nm) is
probed with little to no contribution from either the surface or the
substrate (see Fig.S3).
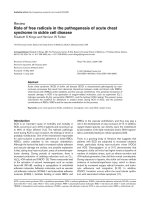
Fig. 3 shows the variation of the longest three LT components, their
corresponding relative intensities, and calculated pores sizes as func
tions of the curing temperature at EP = 4 keV, which corresponds to a
mean positron implantation depth of ~140 nm according to the Makhov
profile assuming material density of ρSiO2 = 2.65 g cm− 3. In fact, the
material density is likely lower due to micro- and mesopores, hence
positrons penetrate deeper. The pore size D3 detected by the third LT τ3
increases from 0.5 nm to 0.8 nm as well as its relative intensity I3 in
creases from ~7% to ~30% with curing temperatures up to T = 400 ◦ C.
This behavior is a consequence of the network formation in spin-on
MSSQ materials as seen in Fig. 2c. Since τ3 remains similar for the
highest curing temperatures T = 400 and 450 ◦ C and at the same time I3
is reduced to ~12%, out migration of o-Ps from the matrix free volume
to mesopores takes place. This is possible throughout (i) a direct
Fig. 3. o-Ps lifetimes, relative intensity, and pore sizes measured at EP = 4 keV
for 20 nm carbon-capped ULK thin films as functions of curing temperature T.
migration channel between the matrix and mesopore (assuming absence
of contaminations, i.e. porogen on the pore wall quenching o-Ps) as well
as across (ii) the free volume of micopore-mesopore network as long as
the porogen is not blocking the entrances to mesopores. It is plausible to
assume that porogen during the curing process is generating both types
of voids, i.e. micropores due to migration and mesopores as a conse
quence of agglomeration likely a consequence of mutual attraction be
tween not more than few porogen molecules generating micelle like
formations [54], and the overall microstructure of free volume can be
4
A.G. Attallah et al.
Microporous and Mesoporous Materials 308 (2020) 110457
approximated as a mesopore network interconnected by smaller in
diameter [55,56] micropores [see the sketch in Fig. 3]. In case of both
scenarios, a trapping cross-section for the free volume of the matrix will
decrease fostering the migration of o-Ps and consequently reducing the
positron lifetime relative intensity. At lower curing temperatures such
channels to mesopores or mesopores themselves are blocked by residual
porogen.
The fourth LT τ4 serves as a probe of the porogen presence and
absence in micropores at the same time. These micorpores are a
consequence of porogen mobility and migration throughout solidifying
and expanding in the free volume size matrix (network). It is mostly
motivated by the fact that the intensity of I4 decreases to less than 5% by
reaching the final curing temperature and at the same time τ4 (D4) be
comes about three times (twice) as large at the highest temperature. The
latter can be explained as a formation of larger free volume (micropores)
than original free volume of porogen. Comparing LT τ4 with the CHxbonds in Fig. 2a from 200 ◦ C to 450 ◦ C the reduction observed in IR
analysis is in good agreement to PALS investigations. At low curing T <
350 ◦ C, porogen molecules are still present in the system and the value of
τ4 is likely a superposition of partially emptied micropores and free
volume of remaining porogen. In that T < 350 ◦ C range the micropore
size slightly increases at the expense of the porogen concentration and
once the sample is cured at ≥350 ◦ C, the calculated size increases as a
result of porogen extraction and relaxation. Since the pores are emptied
from porogen, steric hindrance is reduced at higher temperatures, which
may be another contribution to the increase of τ4 (D4). Starting from
about 350 ◦ C the residuals of porogen previously blocking entrances to
mesopores now are set them free, which is related to more sudden
reduction of I4 with T and can be ascribed to a migration of o-Ps from
micropores to the accessible now mesopores. PALS results regarding I4
are consistent with FTIR for T > 200 ◦ C (Fig. 2a). Two processes su
perimpose: (i) porogen decomposition and for largest temperatures –
porogen removal and (ii) micropore and network formation take place at
the same time.
The fifth LT τ5 reflects mesopore evolution as a function of temper
ature. Their signature has been not detected in the uncured state, but
exists in all cured samples. LT τ5 and hence the size of mesopores (D5)
monotonically increases with T. The increase of mesopore size is a
consequence of the network (matrix) microstructure evolution, porogen
mobility, agglomeration, and out diffusion. It mostly represents free
volume generated by porogen agglomerates due to mutual attraction
between porogen molecules generating micelle like formations [54].
The relative intensity I5 grows monotonically until 400 ◦ C. From 400 ◦ C
to 450 ◦ C I5 increases from 10% to over 30%, whereas the intensity of LT
τ3 decreases in a same abrupt way. This abrupt increase in I5 can be
interpreted as thermal decomposition of remaining residual porogen in
channel like structures between mesopores and is an evidence of inter
connectivity. The rise of I5 is a physical consequence of increased trap
ping cross-section at these largest free volumes.
The positron energy scans of τi, Ii, and Di, where i = 3, 4, 5 denotes
the order of LTs, detected across the ULK films thickness are depicted in
supplementary materials as Fig. S5.
Taking into account that each discrete o-Ps LT component is in fact a
weighted average of LT in a certain group of similar pore sizes, the width
of the broadening of the pore size distribution (PSD) calculated from oPs LT should be investigated in order to examine pore size uniformity.
Accumulating high statistics per spectrum (30 million) allows calcu
lating lifetime distributions using the MELT code which provides the
intensity distribution per o-Ps LT [57]. The conversion of this distribu
tion of o-Ps intensity into PSD has been done successfully for other low-k
films where PSD with 1 nm (FWHM) broadening has been found [58]
because of dispersed pores with different sizes in PECVD films. Since the
spin-on coated ULK films should yield uniform pore sizes, PSD is
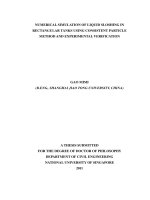
determined here to confirm this assumption (see Fig. 4). Four well
separated groups of free volumes or pores have been identified. The first
two distributions centered at ~0.8 nm and ~1.8 nm reflect the
Fig. 4. Spherical pore size distribution (PSD) derived from PALS results by
MELT of ULK samples cured at different temperatures at EP = 4 keV.
broadening of τ3 and τ4 from discrete analysis (compare to bottom panel
of Fig. 3). However, the uncured sample measured at 25 ◦ C (black dis
tribution) shows a broad PSD extending from 0.4 nm to 0.8 nm, being
most likely an overlapping of the o-Ps annihilation in the matrix (D3 in
Fig. 3) and in the porogen (D4 in Fig. 3). This overlapping takes place
because the difference in LT is not large enough to separate these two
close components. This broad PSD has been split into two PSD for all the
cured samples. In the cured samples, the intensity of the first distribution
(defined as the area under the curve; not shown), which corresponds to
the matrix, increases up to 400 ◦ C and then drops at 450 ◦ C, which
agrees well with the behavior of I3 presented in Fig. 3. Next two distri
butions represent micropore formation, i.e., first and second micropore
distribution. The first distribution of micropores centered at about 0.9
nm can be ascribed to free volumes existed in and left after the porogen
decomposition and its integrated area decreases with the curing tem
perature similarly to I4 shown in Fig. 3. The second micropore distri
bution ranges from 1.45 nm to 1.95 nm. Both micropore distributions
are likely associated with free volume connecting mesopores, e.g. neck
like channels created by the porogen during its out diffusion from the
film, which transport o-Ps once residual porogen concentration is suf
ficiently low. Interestingly, the PSD of mesopores is very narrow (~0.1
nm width) and the integrated area increases with the curing tempera
ture. The maximum and narrowest mesopore size with the highest in
tensity is obtained for the sample cured at 450 ◦ C. Such a narrow PSD
suggests that the free volume microstructure consists of very well
defined free volume blocks without any dispersion across the overall
sample thickness. The results presented in Fig. 3 have been obtained for
a depth of ~140 nm. Similar narrow distributions have been found for
depths of ~46 nm and ~88 nm, too (see supplementary Fig.S6).
Both discrete (PALSfit) and continuous (MELT) analysis combined
provide similar values of positron lifetime, evidencing moreover basi
cally no dispersion of pore sizes. It is plausible to expect that the
increasing of D5 value as a function of curing temperature reflects
increased porogen mobility during curing, which on the other hand
enables porogen agglomeration in the miscible phase hence formation of
larger pores. Consequently, bottle neck like interlinked pore networks
would be generated. Here, very slow 10 ◦ C/min curing rate was used,
which likely enhances porogen clustering. In order to prevent porogen
clustering other means of treatments like faster curing rates with a glass
furnace or optimized UV curing in a couple of minutes, or possibly even
faster curing rates in the sub-second range are presently investigated.
Another solution to prevent porogen agglomeration is to pre-heat the
film to moderate temperatures in order to initiate and stabilize network
cross-linking and densification earlier than the onset of porogen
5
A.G. Attallah et al.
Microporous and Mesoporous Materials 308 (2020) 110457
decomposition. Also, the existence of the 1.45–1.95 nm distribution
(linked to channels) suggests that the porogen removal from the film is
only possible via these channels and it reflects the size of porogen
molecules after migration from original sites. Whereas the larger mes
opores most likely originate from local porogen agglomerations, stabi
lized be developing with temperature network. In addition, the
formation of these channels leads to surface-accessible pores, which, if
hydrophilic, will adsorb moisture or other impurities and in turn leading
to higher leakage currents and lower breakdown voltages in devices.
Employing materials with larger free volumes than the size of the
decomposed porogen as a matrix or using porogen with sizes smaller
than the free volumes in the matrix could pave a new way to solve this
problem. It would allow for porogen removal via the free volume of the
matrix (matrix intrinsic porosity). By preventing the formation of these
channels, self-sealed pores form.
vitreous C reference is depicted in Fig. 5 for the ULK films (cured for 90
min at temperatures from 150 ◦ C to 450 ◦ C in 100 ◦ C steps) as well as for
the glass reference. The low-momentum region (pL < 10− 2 m0c) is mostly
a representation of the S-parameter (EP = 4 keV), hence the free volume
of pores (Fig. 5). The momentum region pL > 10− 2 m0c shows the
annihilation with core-electrons of porogen and the matrix.
The general shape of the uncured curve resembles to a large extent
the SiO2 reference sample in the low and intermediate momentum re
gions (minimum at pL ~5 × 10− 3 m0c and maximum at pL ~15 × 10− 3
m0c) and at the same time the high momentum part overlaps with the Creference. The latter, is a signature of dominant positron annihilation
with electrons in carbon. With increasing curing temperature the
amplitude (ratio to vitreous C) at the high momentum region increases
monotonically, suggesting decrease of carbon decoration of the defect
site, which can be linked to porogen decomposition and out diffusion
from the annihilation site. Such a dependence of the C content on the
curing temperature confirms the results of PALS and FTIR for porogen
removal and general reduction of the carbon content with curing
temperature.
The variation of cDBS curves in the higher momentum region (pL >
10− 2 m0c) represents the development of the matrix as a function of
curing temperature, too. The remaining backbone of the fully cured and
porogen-free ULK films does not consist of pure SiO2, but rather Si–O
bonds with methyl-groups. It is obvious that for larger temperatures the
ratio curves are dissimilar to the electronic structure of amorphous glass
since the annihilation site is decorated by other elements. Especially,
samples cured at 350 ◦ C and 450 ◦ C deviate strongly at pL > 17 × 10− 3
m0c. Beside the stronger matrix crosslinking with the curing tempera
ture, -Si-CH3 bond strengthen increases, too (FTIR- Fig. 2d). In conclu
sion, the disagreement between the ratio curves of the cured samples at
350 ◦ C and 450 ◦ C and the glass reference spectrum evidences that the
structure is not formed solely by SiOx but it contains SiCH3 bonds as
well, which are a part of the matrix, rather than the pore wall.
3.1.3. cDBS
The core electrons possess high momentum acting as fingerprints for
each element. Due to the higher chance of positrons to annihilate with
valence electrons, the overlap of these high momenta-electrons with
positrons is small. Consequently, the counts in the tails of the spectrum
which probe the high-momentum electron distributions are low. Since,
only one detector is used during DBS the noise-to-signal ratio is in turn
high. The so-called ”coincidence Doppler broadening spectroscopy”
(cDBS) utilizes two detectors during the measurement, which greatly
reduces the noise-to-signal ratio [59]. cDBS detects both annihilation
photons and reveals the contribution to the positron annihilation with
electrons originating from different elements located at the annihilation
site. Elemental information is derived from cDBS by analyzing the
photon intensity in the high-momentum region (similarly to the
W-parameter). Uncured samples containing both porogen and SiO2
show a distinguished dependence of the electron momentum, pL, which
is referenced to a given reference sample [see Fig. 5]. Such ratio curves
will be different for uncured and completely cured samples. Since the
uncured system have a high carbon content due to the presence of the
porogen, vitreous carbon has been used as a reference for porogen
content. The fully cured sample should contain a large concentration of
SiOx (Si–O bonds), which electronically are to a large extent similar to
amorphous glass, hence a glass substrate has been used as a reference for
fully cured samples. Such references have been used to register their
characteristic shapes of the annihilation line. Comparative measure
ments between these references and samples cured at different tem
peratures show the evolution of the curing process. The electronic
momenta variation obtained at EP = 4 keV and normalized to the
3.2. In-situ curing at AIDA system as a probe of free volume kinematics
PALS measurements on ex-situ cured films provided important hints
regarding porogen removal. In this section the kinetic evolution of
porosity during the curing process are discussed, which has been
demonstrated to our knowledge for the first time using the all in-situ
approach. This experiment gives insights into the mechanism of pore
formation and the onset of pore inter-connectivity. Two different sample
series were probed: (i) capped (with 20 nm-thick carbon layer) and (ii)
uncapped films and treated with exactly the same thermal conditions.
One film series (with and without cap layer) have been cured sequen
tially at AIDA [43] using different curing temperatures and a dwell time
of 1h in ultra-high vacuum (10− 8 - 10− 9 mbar) and measured by Doppler
broadening PAS at room temperature. The sequentially cured uncapped
(supplementary materials Fig.S7a) and caped (supplementary materials
Fig.S7b) films both showed a monotonic increase of the S-parameter and
a decrease of the W-parameter as functions of curing temperature, a
clear signature of increasing open and free volume. In addition, a
thickness reduction is evidenced in both systems as a shorter plateau of
the material sensitive W-parameter for the 200 ◦ C curing step compare
the pristine film, which is in accordance with FTIR. The thickness
reduction is further progressing at larger curing temperatures. The re
sults of the continuous in-situ curing experiment, where both type of
films (with and without cap layer) have been cured at a constant heating
ramp of 1 ◦ C/min with sampling period of 5 min, are summarized in
Fig. 6, which shows the variation of the S-parameter (Fig. 6a) and the
normalized (with respect to the Si substrate) Nvalley/Ntotal ratio (Fig. 6b)
at EP = 4 keV. The meaning of the Nvalley/Ntotal is explained later in the
text. The comparison between the capped and uncapped samples serves
to disentangle contributions of a pure pick-off process from o-Ps
escaping the films through the pore network, respectively. At the same
time, the porogen decomposition could feature two feasible scenarios:
Fig. 5. Dependence of the ratio to vitrous carbon of ULK thin films cured from
150 ◦ C to 450 ◦ C on the electronic momenta where glass has been used as
references of fully cured samples.
6
A.G. Attallah et al.
Microporous and Mesoporous Materials 308 (2020) 110457
examined using the Nvalley/Ntotal parameter (Fig. 6.b). The Nvalley de
scribes mostly the number of 3γ annihilation events and the Ntotal ac
counts for both the number of 3γ and 2γ annihilation events [35].
Notably, Nvalley/Ntotal shows five stages in the uncapped samples while
these five stages are combined into only two stages in the capped one.
Through stage I in the uncapped sample, the normalized Nvalley/Ntotal
ratio is constant and slightly higher than unity. This means, that the
removal of residual organic solvents and mositure could already clean
some openings to the surface allowing for o-Ps to annihilating via 3γ
emission. The increase of Nvalley/Ntotal during the stage II represents
additional openings to the surface created during the cross-linking
process. In stage III only a gentle increase of Nvalley/Ntotal is observed,
which indicates that the fraction of the accessible from the surface pores,
created at the beginning of this stage, is unaffected by temperature and
most likely the created pores are still isolated from each other and from
the surface. Here, the slight increase of Nvalley/Ntotal as a function of
temperature represents matrix modifications allowing o-Ps to travel
more undisturbed, e.g., due to the size and concentration increase of
intrinsic open volume as shown from PALS results. The transition from
isolated pores into interconnected pores starts at ~380 ◦ C (stage IV) as
displayed by the steeper increase of Nvalley/Ntotal. It can be explained as
increasing probability of 3γ annihilation, which takes place in the case of
infinite long channels that can extend up to the film surface and taking
into account the constancy of S-parameter along the stage IV (Fig. 6 a
and Fig.S1). The rate of pore interconnectivity is lower along the stage V,
starting at 450 ◦ C, which shows a smaller slope of Nvalley/Ntotal with
respect to that of the stage IV.
Interestingly, Nvalley/Ntotal is nearly constant along stages I-III in the
capped sample and it is ~1.0, which proves that the 20 nm carbon cap
works nicely and prevented o-Ps from escaping. The capping also hides
all internal curing-related processes (residual organic solvents and
moisture removal, cross-linking, and porogen removal) form being
detected from Nvalley/Ntotal. At ~400 ◦ C, Nvalley/Ntotal starts to increase
which means the onset of interconnectivity inside the sample itself in
stages IV + V of the capped sample similar to the uncapped sample.
Here, due to interconnectivity long enough channels are created
allowing a small fraction of o-Ps to annihilate not via the pick-off process
but with intrinsic vacuum lifetime. In case o-Ps could leave the film
across cracks in the cap layer, which we cannot unambiguously exclude,
Nvalley/Ntotal the parameter should be much larger, more in the range for
uncapped films.
The transition from closed (isolated) to open pores (inter
connectivity) can be monitored using o-Ps 3γ annihilation simply
because o-Ps can travel a long distance inside the pore network and
finally out-diffuse into vacuum via open to surface pores where finally it
annihilates emitting 3γ photons [60]. We have utilized this property to
estimate an interconnectivity length, LPs, as a function of curing tem
perature. The overall 3γ annihilation process of o-Ps besides the
contribution from out-diffused into vacuum, it consists in addition of a
small fraction, which annihilates inside the pore network [60,61]. Ac
cording to Ref. [61], the experimental 3γ annihilation fraction, F3γ
(definition of F3γ is given in the supplementary materials section S.F3γ),
can be evaluated using the following equation:
Fig. 6. S-parameter (a) and normalized Nvalley/Ntotal ratio (b) of capped (red
squares) and uncapped (black squares) ULK samples at different temperature
(from RT to 500 ◦ C) during the curing in-situ at AIDA system. (For interpre
tation of the references to colour in this figure legend, the reader is referred to
the Web version of this article.)
(i) porogen diffuses inside the matrix but is not mobile enough and re
mains there or (ii) it, unavoidably, creates paths to the surface. In the
latter case, the cap layer would hinder or delay the removal of the
decomposed porogen from the film.
In Fig. 6 a, the S-parameter shows four stages of curing along tem
peratures from 30 ◦ C to ~500 ◦ C for both the capped and uncapped
samples. It should be noted, that the S- parameter is a weighted average
of different open volume contribution, i.e., free annihilation at inter
stitial positions and in vacancy like defects as well as bound annihilation
as p-Ps, and o-Ps in pores due to pick-off process and outside the films in
case of escape throughout the pore network. In the uncapped sample,
the linear increase of S-parameter in the stage I can be attributed to the
removal of residual organic solvents and absorbed from ambient mois
ture. During stage II from ~100 ◦ C to ~160 ◦ C, matrix cross-linking
starts to takes place as well as the removal of remaining rheological
chemicals continues, the latter reflected by increase of S, hence free
volume. The slow increase of S-parameter during stage III illustrates the
time and temperature dependence of porogen removal and matrix for
mation. In stage IV, starting at 400 ◦ C, the mean pore size is formed,
since it does not change in size anymore and a curing process is close to
completion.
In the capped sample (red squares in Fig. 6a), the S-parameter is
constant along stage I, which represents most probably hindering of
residual organic solvents and moisture removal, which is delayed and
starts at ~ 100 ◦ C during the stage II. The stage II for the capped film has
a similar slope as stage I in the uncapped sample, hence one can say that
sages I and II in the uncapped sample are combined into one single stage,
II, in the capped sample. Hence, in the capped sample, the stage II re
sembles the residual organic solvents and moisture removal, crosslinking onset, and porogen decomposition onset. Again as in the
uncapped sample, stage III represents the removal of porogen residues.
Here, the slope of stage III is slightly smaller than that in the uncapped
sample and also the stage IV, which reflects a complete pore formation
and the initiation of interconnectivity, has been shifted due to the
presence of the cap layer. It seems that the porogen tries to leave the
sample by making channels to the surface but since the cap is there, it
diffuses into the matrix or it incorporates into the carbon layer or leaves
across it. Therefore, we believe that the capping hinders porogen
removal to a large extend.
The analysis of the S-parameter illustrated the change of created
porosity, whereas the onset of the pore inter-connectivity has been
(F3γ)
total
= (F3γ)
vacuum
+ (F3γ) mesopores
(2)
The fraction of o-Ps annihilation in vacuum has been calculated for
uncapped films (see supplementary materials, section S.F3γ). The frac
tion of o-Ps annihilation in mesopores calculated for the same samples
but capped is estimated by fitting the intensity I5 of τ5. Table 1 shows the
calculated values of F3γ in mesopores, vacuum, as well as the inter
connectivity length, LPs, and its ratio to film thickness D, LPs/D, as
functions of curing temperature. For 3γ annihilation in mesopores
positron implantation energies Ep = 3 keV and 6 keV have been chosen
to indicate the o-Ps fraction close to the middle of the film and at the
film-substrate interface, respectively. The energies Ep = 1 keV and 6 keV
7
A.G. Attallah et al.
Microporous and Mesoporous Materials 308 (2020) 110457
curing by Doppler broadening PAS, which realized the most deep insight
into free volume and porogen kinetics, hints that the creation of path
ways (micropores) to the surface is the only way for the porogen
removal. The in-situ curing also nicely shows that the pore inter
connectivity occurs at ~380–400 ◦ C. The interconnectivity length in
creases nonlinearly as a function of curing temperature reaching a value
of ~180 nm at final 450 ◦ C curing temperature, which is ~50% of the
film thickness.
Table 1
Fractions of o-Ps annihilating in mesopores (at Ep = 3 and 6 keV) and vacuum (at
Ep = 1 and 6 keV), interconnectivity length, and its ratio to film thickness as
functions of curing temperature.
Curing
temperature
(◦ C)
200
300
400
450
3γ fraction (%)
in mesopores
3γ fraction
(%) in
vacuum
Ep =
3 keV
Ep =
6 keV
Ep
=1
keV
Ep
=6
keV
0.015
0.01
0.062
0.062
0.018
0.011
0.067
0.067
30
39
47
51
12
17
15
15
Interconnectivity
length, LPs, (nm)
LPs/D
1.76
24.91
74.17
179.92
0.004
0.06
0.21
0.49
CRediT authorship contribution statement
A.G. Attallah: Conceptualization, Writing - original draft, Writing review & editing. N. Koehler: Resources, Software, Data curation,
Validation. M.O. Liedke: Supervision, Resources, Software, Data cura
tion, Validation. M. Butterling: Resources, Visualization, Software,
Formal analysis. E. Hirschmann: Resources, Visualization, Software,
Data curation, Funding acquisition. R. Ecke: Resources, Visualization,
Supervision. S.E. Schulz: Resources, Supervision, Visualization. A.
Wagner: Resources, Supervision, Visualization.
have been selected for the 3γ fraction in vacuum to show the highest and
lowest escaped portions, respectively but still within the film region.
The obtained 3γ fraction in mesopores is very low most likely due to
their small size and characteristic microstructure as shown in the sketch
of Fig. 3, i.e. worm-like micropore channels leading to larger mesopores.
Such a microstructure suggests that o-Ps annihilates dominantly by pickoff and probability of 3γ annihilation is low. Since the chance of o-Ps
escape to vacuum reduces with increasing Ep, the 3γ fraction in meso
pores at 6 keV is the same or larger than at 3 keV. Moreover, the 3γ
vacuum fraction of o-Ps is the largest at 1 keV (sub-surface region) and
clearly increases with curing temperature. Similarly, the inter
connectivity length LPs raises with the curing temperature reaching
~180 nm at 450 ◦ C curing temperature. The variation of LPs is nonlinear
and a steeper, more pronounce increase is visible after curing at T > 300
◦
C in agreement with in-situ curing results (Fig. 6b). The LPs/D ratio
shows that ~50% of the film thickness is interconnected after final
curing at 450 ◦ C.
Declaration of competing interest
The authors declare that they have no known competing financial
interests or personal relationships that could have appeared to influence
the work reported in this paper.
Acknowledgments
This research was funded by the DFG project No. 398216953 (WA
2496/1-1 and SCHU1431/9-1). Part of this research was carried out at
ELBE at the Helmholtz-Zentrum Dresden - Rossendorf e. V., a member of
the Helmholtz Association. We would like to thank the facility staff for
assistance. This work was partially supported by the Impulse-und Networking fund of the Helmholtz Association (FKZ VH-VI-442 Memriox)
and the Helmholtz Energy Materials Characterization Platform
(03ET7015). We thank to J. Hickman from SBA Materials for providing
chemicals utilized to manufacture ULK films.
4. Conclusions
Monoenergetic positron beam based spectroscopic methods (lifetime
and Doppler broadening) have been employed in conjunction with FTIR
to study the thermal curing process in-situ and ex-situ by varying the
curing temperature of spin-on low-k thin films. FTIR spectroscopy
shows, that the crosslinking of the network material by silanol
condensation starts at low temperatures and is finished by the complete
disappearance of the Si–OH peak at 350 ◦ C. However, the Si–O peak
region continually grows, most likely originated by a densification of the
material, which also causes the thickness reduction of 30%. At 400 ◦ C
Si–CH3 bond break starts to occur, which can cause the transition from
isolated pores into interconnected pores, started at ~380 ◦ C, which is
explicitly detected by PALS and in-situ DB PAS. The porogen removal
starts at 200 ◦ C and slowly decrease to less than 5% at 450 ◦ C. In-situ DB
PAS and ex-situ PALS suggest that porogen removal and pore formation
kinematics is not a single step mechanism but rather a continuous multistage process, which is initiated at 200 ◦ C ending at 450 ◦ C. Because of
the incomplete vitrification process of the matrix in the initial stages of
the curing, porogen molecules can approach each other, forming micelle
like aggregations, which in turn contribute to the formation of openings
(channels) towards the surface and inside the film. This leads to the
increased pore size accompanied by increased positron annihilation
intensity as a function of the curing temperature. Hence, a channel-like
free volume structure is obtained as a consequence of porogen migration
with a channel cross-section of about 1.6 nm and numerous larger
mesopores across the pathways, former porogen agglomerations. It is
unambiguously confirmed by distributional analysis of PALS data,
which revealed a narrow pore size distribution becoming even narrower
with increasing curing temperature. Mesopores with about 3.1 nm size
and 35% intensity were obtained after curing the sample at 450 ◦ C.
Moreover, PALS indicates that the matrix free volume increases both in
size and concentration with the curing temperature as well. The in-situ
Appendix A. Supplementary data
Supplementary data to this article can be found online at https://doi.
org/10.1016/j.micromeso.2020.110457.
References
[1] A. Grill, S.M. Gates, T.E. Ryan, S.V. Nguyen, D. Priyadarshini, Progress in the
development and understanding of advanced low k and ultralow k dielectrics for
very large-scale integrated interconnects - state of the art, Appl. Phys. Rev. 1
(2014), 011306.
[2] D.J. Michalak, J.M. Blackwell, J.M. Torres, A. Sengupta, L.E. Kreno, J.S. Clarke,
D. Pantuso, Porosity scaling strategies for low-k films, J. Mater. Res. 30 (2015)
3363–3385, />[3] H.S. Rathore, Electrochemical Society. Dielectric science and technology division,
in: Proceedings of the Second International Symposium on Low and High Dielectric
Constant Materials: Materials Science, Processing, and Reliability Issues,
Electrochemical Society, 1997.
[4] M. Bohr, The new era of scaling in an soc world, in: Dig. Tech. Pap. - IEEE Int.
Solid-State Circuits Conf., 2009, />[5] B.D. Hatton, K. Landskron, W.J. Hunks, M.R. Bennett, D. Shukaris, D.D. Perovic, G.
A. Ozin, Materials chemistry for low-k materials, Mater. Today 9 (2006) 22–31,
/>[6] R.D. Miller, In Search of low-k dielectrics, Science 80– (1999) 286.
[7] P.S. Ho, J. Leu, W.W. Lee, Overview on Low Dielectric Constant Materials for IC
Applications, Springer, Berlin, Heidelberg, 2003, pp. 1–21, />10.1007/978-3-642-55908-2_1.
[8] K. Maex, M. Baklanov, Low dielectric constant materials for microelectronics,
J. Appl. Phys. 93 (2003) 8793, />[9] D. Edelstein, J. Heidenreich, R. Goldblatt, W. Cote, C. Uzoh, N. Lustig, P. Roper,
T. McDevitt, W. Motsiff, A. Simon, J. Dukovic, R. Wachnik, H. Rathore, R. Schulz,
L. Su, Full copper wiring in a sub-0.25 μm CMOS ULSI technology, in: Tech. Dig. Int. Electron Devices Meet. IEDM, 1997, pp. 773–776, />iedm.1997.650496.
8
A.G. Attallah et al.
Microporous and Mesoporous Materials 308 (2020) 110457
[10] S. Venkatesan, A.V. Gelatos, V. Misra, B. Smith, R. Islam, J. Cope, B. Wilson,
D. Tuttle, R. Cardwell, S. Anderson, M. Angyal, R. Bajaj, C. Capasso, P. Crabtree,
S. Das, High performance 1.8 V, 0.20 μm CMOS technology with copper
metallization, in: Tech. Dig. - Int. Electron Devices Meet. IEDM, 1997, pp. 769–772,
/>[11] D. Shamiryan, T. Abell, F. Iacopi, K. Maex, Low-k dielectric materials, Mater.
Today 7 (2004) 34–39, />[12] P. Marsik, P. Verdonck, D. De Roest, M.R. Baklanov, Porogen residues detection in
optical properties of low-k dielectrics cured by ultraviolet radiation, Thin Solid
Films 518 (2010) 4266–4272, />[13] A.M. Urbanowicz, K. Vanstreels, P. Verdonck, D. Shamiryan, S. De Gendt, M.
R. Baklanov, Improving mechanical robustness of ultralow-SiOCH plasma
enhanced chemical vapor deposition glasses by controlled porogen decomposition
prior to UV-hardening ARTICLES YOU MAY BE INTERESTED IN, J. Appl. Phys. 107
(2010) 104122, />[14] O. Gourhant, V. Jousseaume, L. Favennec, A. Zenasni, P. Maury, L. Mage,
P. Gonon, G. Vincent, Extendibility of the PECVD porogen approach for ULK
materials, in: Mater. Res. Soc. Symp. Proc., Cambridge University Press, 2007,
pp. 45–50, />[15] J. El Sabahy, G. Castellan, F. Ricoul, V. Jousseaume, Porous SiOCH thin films
obtained by foaming, J. Phys. Chem. C 120 (2016) 9184–9191, />10.1021/acs.jpcc.6b00204.
[16] G. Panzarasa, S. Aghion, G. Marra, A. Wagner, M.O. Liedke, M. Elsayed, R. KrauseRehberg, R. Ferragut, G. Consolati, Probing the impact of the initiator layer on
grafted-from polymer brushes: a positron annihilation spectroscopy study,
Macromolecules 50 (2017) 5574–5581, />macromol.7b00953.
[17] W. Volksen, T. Frot, T. Magbitang, S. Gates, M. Oliver, R. Dauskardt, G. Dubois,
Future of PECVD and spin-on ultra low-k materials, in: 2011 IEEE Int. Interconnect
Technol. Conf. 2011 Mater. Adv. Met. IITC/MAM 2011, 2011, />10.1109/IITC.2011.5940287.
[18] S. Mann, G.A. Ozin, Synthesis of inorganic materials with complex form, Nature
382 (1996) 313–318, />[19] F. Schüth, Endo- and exotemplating to create high-surface-area inorganic
materials, Angew. Chem. Int. Ed. 42 (2003) 3604–3622, />anie.200300593.
[20] P. Lazzeri, L. Vanzetti, M. Anderle, M. Bersani, J.J. Park, Z. Lin, R.M. Briber, G.
W. Rubloff, H.C. Kim, R.D. Miller, Thin-film transformations and volatile products
in the formation of nanoporous low- k polymethylsilsesquioxane-based dielectric,
J. Vac. Sci. Technol. B Microelectron. Nanom. Struct. 23 (2005) 908–917, https://
doi.org/10.1116/1.1900734.
[21] A.M. Padovani, L. Rhodes, L. Riester, G. Lohman, B. Tsuie, J. Conner, S.A.B. Allen,
P.A. Kohl, Porous methylsilsesquioxane for low-k dielectric applications,
Electrochem. Solid State Lett. 4 (2001) F25, />[22] E.A. Smirnov, K. Vanstreels, P. Verdonck, I. Ciofi, D. Shamiryan, M.R. Baklanov,
M. Phillips, Evaluation of a new advanced low-k material, Jpn. J. Appl. Phys. 50
(2011), 05EB03.
[23] H.-J. Lee, C.L. Soles, D.-W. Liu, B.J. Bauer, W.-L. Wu, Pore size distributions in lowk dielectric thin films from X-ray porosimetry, J. Polym. Sci., Part B: Polym. Phys.
40 (2002) 2170–2177, />[24] M.R. Baklanov, K.P. Mogilnikov, V.G. Polovinkin, F.N. Dultsev, Determination of
pore size distribution in thin films by ellipsometric porosimetry, J. Vac. Sci.
Technol. B Microelectron. Nanom. Struct. 18 (2000) 1385–1391, />10.1116/1.591390.
[25] J.-N. Sun, Y. Hu, W.E. Frieze, W. Chen, D.W. Gidley, How pore size and surface
roughness affect diffusion barrier continuity on porous low-k films, J. Electrochem.
Soc. 150 (2003) F97, />[26] M.P. Petkov, M.H. Weber, K.G. Lynn, K.P. Rodbell, Probing capped and uncapped
mesoporous low-dielectric constant films using positron annihilation lifetime
spectroscopy, Appl. Phys. Lett. 77 (2000) 2470–2472, />1.1318238.
[27] S. Intel, S.B.A.M. Several, S.B.A. Materials, C.T.O. Mark, B. Polymer, T. Inorganic,
Low-k dielectric family introduced by SBA Materials. />nymous?id=GALE%7CA252003239&sid=googleScholar&v=2.1&it=r&linkacce
ss=fulltext&issn=0038111X&p=AONE&sw=w, 2010 (accessed April 23, 2020), 79.
[28] H.E. W, Francis Arthur Jenkins, Fundamentals of optics - francis arthur jenkins,
harvey elliott white - google books (n.d.), />undamentals_of_Optics.html?id=dCdRAAAAMAAJ&source=kp_cover&redir_esc=y
(accessed April 23, 2020).
[29] A.E. Ruark, Positronium [2], Phys. Rev. 68 (1945) 278, />PhysRev.68.278.
[30] R.E. Bell, R.L. Graham, Time distribution of positron annihilation in liquids and
solids, Phys. Rev. 90 (1953) 644–654, />[31] A.T.G. Ferguson, G.M. Lewis, CXLI. On the annihilation of positrons in solids,
London, Edinburgh, Dublin Philos. Mag. J. Sci. 44 (1953) 1339–1347, https://doi.
org/10.1080/14786441208520403.
[32] S.J. Tao, The formation of positronium in molecular substances, Appl. Phys. 10
(1976) 67–79, />[33] M. Eldrup, D. Lightbody, J.N. Sherwood, The temperature dependence of positron
lifetimes in solid pivalic acid, Chem. Phys. 63 (1981) 51–58, />10.1016/0301-0104(81)80307-2.
[34] T.L. Dull, W.E. Frieze, D.W. Gidley, J.N. Sun, A.F. Yee, Determination of pore size
in mesoporous thin films from the annihilation lifetime of positronium, J. Phys.
Chem. B 105 (2001) 4657–4662, />
[35] A. Uedono, Z.Q. Chen, R. Suzuki, T. Ohdaira, T. Mikado, S. Fukui, A. Shiota, S.
I. Kimura, Nanoporous structure of methyl-silsesquioxane films using
monoenergetic positron beams, J. Appl. Phys. 90 (2001) 24982503, https://doi.
org/10.1063/1.1388858.
[36] P. Hautojă
arvi, A. Vehanen, Introduction to Positron Annihilation, Springer, Berlin,
Heidelberg, 1979, pp. 1–23, />[37] A. Uedono, R. Suzuki, T. Ohdaira, T. Mikado, S. Tanigawa, M. Ban, M. Kyoto,
T. Uozumi, Open spaces and relaxation processes in the subsurface region of
polypropylene probed by monoenergetic positron beams, J. Polym. Sci., Part B:
Polym. Phys. 38 (2000) 101–107, />(20000101)38:1<101::AID-POLB13>3.0.CO;2-X.
[38] R.S. Brusa, M. Spagolla, G.P. Karwasz, A. Zecca, G. Ottaviani, F. Corni,
M. Bacchetta, E. Carollo, Porosity in low dielectric constant SiOCH films depth
profiled by positron annihilation spectroscopy, J. Appl. Phys. 95 (2004)
2348–2354, />[39] A. Wagner, W. Anwand, A.G. Attallah, G. Dornberg, M. Elsayed, D. Enke, A.E.
M. Hussein, R. Krause-Rehberg, M.O. Liedke, K. Potzger, T.T. Trinh, Positron
annihilation lifetime spectroscopy at a superconducting electron accelerator, in:
14th Int. Work. Slow Positron Beam Tech. Appl., 2017, />1742-6596/791/1/012004.
[40] J.V. Olsen, P. Kirkegaard, N.J. Pedersen, M. Eldrup, PALSfit: a new program for the
evaluation of positron lifetime spectra, in: Phys. Status Solidi Curr. Top. Solid State
Phys, Wiley-VCH Verlag, 2007, pp. 4004–4006, />pssc.200675868.
[41] A. Shukla, M. Peter, L. Hoffmann, Analysis of positron lifetime spectra using
quantified maximum entropy and a general linear filter, Nucl. Instrum. Methods
Phys. Res. A. 335 (1993) 310–317, />90286-Q.
[42] R. Zaleski, J. Wawryszczuk, T. Goworek, Pick-off models in the studies of
mesoporous silica MCM-41. Comparison of various methods of the PAL spectra
analysis, Radiat. Phys. Chem. 76 (2007) 243–247, />radphyschem.2006.03.044.
[43] M.O. Liedke, W. Anwand, R. Bali, S. Cornelius, M. Butterling, T.T. Trinh,
A. Wagner, S. Salamon, D. Walecki, A. Smekhova, H. Wende, K. Potzger, Open
volume defects and magnetic phase transition in Fe60Al40 transition metal
aluminide, J. Appl. Phys. 117 (2015) 163908, />1.4919014.
[44] W. Anwand, G. Brauer, M. Butterling, H.R. Kissener, A. Wagner, Design and
construction of a slow positron beam for solid and surface investigations, Defect
Diffusion Forum 331 (2012) 25–40, />DDF.331.25.
[45] A. Grill, D.A. Neumayer, Structure of low dielectric constant to extreme low
dielectric constant SiCOH films: Fourier transform infrared spectroscopy
characterization, J. Appl. Phys. 94 (2003) 6697–6707, />1.1618358.
[46] A. Zenasni, B. Remiat, C. Waldfried, C. Le Cornec, V. Jousseaume, G. Passemard,
Thermal furnace and Ultraviolet assisted curing impact on SiOCH spin-on ultra low
dielectric constant materials, Thin Solid Films 516 (2008) 1097–1103, https://doi.
org/10.1016/j.tsf.2007.05.010.
[47] A. Zenasni, F. Ciaramella, V. Jousseaume, C. Le Cornec, G. Passemard,
Investigation of porogen behavior during the curing process of ultralow-k spin-on
materials, J. Electrochem. Soc. 154 (2007) G6, />1.2353784.
[48] V. Jousseaume, L. Favennec, A. Zenasni, O. Gourhant, Porous ultra low k deposited
by PECVD: from deposition to material properties, Surf. Coating. Technol. 201
(2007) 9248–9251, />[49] S. Yang, P.A. Mirau, C.S. Pai, O. Nalamasu, E. Reichmanis, J.C. Pai, Y.S. Obeng,
J. Seputro, E.K. Lin, H.J. Lee, J. Sun, D.W. Gidley, Nanoporous ultralow dielectric
constant organosilicates templated by triblock copolymers, Chem. Mater. 14
(2002) 369–374, />[50] A. Zenasni, F. Ciaramella, V. Jousseaume, C. Le Cornec, G. Passemard,
Investigation of porogen behavior during the curing process of ultralow-k spin-on
materials, J. Electrochem. Soc. 154 (2007) G6, />1.2353784.
[51] C. Liu, Q. Qi, D.S. Seregin, A.S. Vishnevskiy, Y. Wang, S. Wei, J. Zhang, K.
A. Vorotilov, F.N. Dultsev, M.R. Baklanov, Effect of terminal methyl groups
concentration on properties of organosilicate glass low dielectric constant films,
Jpn. J. Appl. Phys. 57 (2018), />07MC01.
[52] D. Seregin, A. Vishnevskiy, G. Orlov, V. Storonkin, I. Ovchinnikov, K. Vorotilov,
M. Baklanov, Temperature evolution of sol-gel PMO low-k films with different
organic bridges, in: Advanced Metallization Conference 2019, 29th Asian Session,
Oct, Tokyo, Japan, 2019, pp. 10–11, p. 84-84.
[53] O. Gourhant, G. Gerbaud, A. Zenasni, L. Favennec, P. Gonon, V. Jousseaume,
Crosslinking of porous SiOCH films involving Si-O-C bonds: impact of deposition
and curing, J. Appl. Phys. 108 (2010) 124105, />1.3518512.
[54] R.S. Vallery, M. Liu, D.W. Gidley, J.H. Yim, From single molecules to micelles - an
in situ study of porogen aggregation and nanopore formation mechanisms in
porous thin films, Microporous Mesoporous Mater. 143 (2011) 419–425, https://
doi.org/10.1016/j.micromeso.2011.03.031.
[55] Y. Sun, M. Krishtab, H. Struyf, P. Verdonck, S. De Feyter, M.R. Baklanov, S. Armini,
Impact of Plasma Pretreatment and Pore Size on the Sealing of Ultra-low-k
Dielectrics by Self-Assembled Monolayers, vol. 30, 2014, p. 3844, />10.1021/la404165n.
9
A.G. Attallah et al.
Microporous and Mesoporous Materials 308 (2020) 110457
[56] C.M. Whelan, Q.T. Le, F. Cecchet, A. Satta, J.J. Pireaux, P. Rudolf, K. Maex, Sealing
of porous low-k dielectrics ellipsometric porosimetry study of UV-O3 oxidized
SiOxCy films, Electrochem. Solid State Lett. 7 (2004), />1.1633512.
[57] R. Zaleski, Principles of positron porosimetry, Nukleonika 60 (2015) 795–800,
/>[58] D.W. Gidley, H.-G. Peng, R.S. Vallery, Positron annihilation as a method to
characterize porous materials, Annu. Rev. Mater. Res. 36 (2006) 49–79, https://
doi.org/10.1146/annurev.matsci.36.111904.135144.
[59] K.G. Lynn, J.R. MacDonald, R.A. Boie, L.C. Feldman, J.D. Gabbe, M.F. Robbins,
E. Bonderup, J. Golovchenko, Positron-annihilation momentum profiles in
aluminum: core contribution and the independent-particle model, Phys. Rev. Lett.
38 (1977) 241–244, />[60] M.P. Petkov, C.L. Wang, M.H. Weber, K.G. Lynn, K.P. Rodbell, Positron
annihilation techniques suited for porosity characterization of thin films. https://
doi.org/10.1021/jp013947b, 2003.
[61] S. Mariazzi, P. Bettotti, S. Larcheri, L. Toniutti, R.S. Brusa, High positronium yield
and emission into the vacuum from oxidized tunable nanochannels in silicon. htt
ps://doi.org/10.1103/PhysRevB.81.235418, 2010.
10