Local quantification of mesoporous silica microspheres using multiscale electron tomography and lattice Boltzmann simulations
Bạn đang xem bản rút gọn của tài liệu. Xem và tải ngay bản đầy đủ của tài liệu tại đây (1.33 MB, 7 trang )
Microporous and Mesoporous Materials 302 (2020) 110243
Contents lists available at ScienceDirect
Microporous and Mesoporous Materials
journal homepage: />
Local quantification of mesoporous silica microspheres using multiscale
electron tomography and lattice Boltzmann simulations
Andreas J. Fijneman a, b, Maurits Goudzwaard a, Arthur D.A. Keizer a, Paul H.H. Bomans a,
€ck c, Magnus Palmlo
€f b, Michael Persson b, Joakim Ho
€gblom b, Gijsbertus de With a,
Tobias Geba
Heiner Friedrich a, d, *
a
Laboratory of Physical Chemistry, and Center for Multiscale Electron Microscopy, Department of Chemical Engineering and Chemistry, Eindhoven University of
Technology, Groene Loper 5, 5612 AE, Eindhoven, the Netherlands
Nouryon Pulp and Performance Chemicals AB, F€
arjev€
agen 1, SE-455 80, Bohus, Sweden
c
SuMo Biomaterials VINN Excellence Centre, and Department of Mathematical Sciences, Chalmers University of Technology and Gothenburg University, Chalmers
Tv€
argata 3, SE-412 96, G€
oteborg, Sweden
d
Institute for Complex Molecular Systems, Eindhoven University of Technology, Groene Loper 5, 5612 AE, Eindhoven, the Netherlands
b
A R T I C L E I N F O
A B S T R A C T
Keywords:
Quantitative electron tomography
Mesoporous silica
Intraparticle diffusivity
Scanning transmission electron microscopy
Lattice Boltzmann simulations
The multiscale pore structure of mesoporous silica microspheres plays an important role for tuning mass transfer
kinetics in technological applications such as liquid chromatography. While local analysis of a pore network in
such materials has been previously achieved, multiscale quantification of microspheres down to the nanometer
scale pore level is still lacking. Here we demonstrate for the first time, by combining low convergence angle
scanning transmission electron microscopy tomography (LC-STEM tomography) with image analysis and lattice
Boltzmann simulations, that the multiscale pore network of commercial mesoporous silica microspheres can be
quantified. This includes comparing the local tortuosity and intraparticle diffusion coefficients between different
regions within the same microsphere. The results, spanning more than two orders of magnitude between
nanostructures and entire object, are in good agreement with bulk characterization techniques such as nitrogen
gas physisorption and add valuable local information for tuning mass transfer behavior (in liquid chromatog
raphy or catalysis) on the single microsphere level.
1. Introduction
Electron tomography is a powerful technique to image the threedimensional (3D) structure of an object with nanometer resolution
using a series of two-dimensional (2D) electron micrographs. It is
frequently used in the biological, chemical and physical sciences to
study the 3D morphology of materials [1–7]. Nanoporous materials in
particular have received a great deal of attention over the past years,
mainly because of their (potential) application in catalysis or separation
processes [8–13]. One example is provided by mesoporous silica mi
crospheres that are used as packing material in high performance liquid
chromatography (HPLC) [14]. These particles play an important role in
the separation and analysis of a large variety of molecules based on
differences in mass transfer properties [15,16]. They are often highly
porous and have complex pore networks that extend over multiple
length scales, making them difficult to study by (Scanning) Transmission
Electron Microscopy ((S)TEM) based 3D imaging approaches. This is on
account that particles are often in the micrometer range (2–25 μm),
which necessitates cutting of the particles with, e.g., focused-ion beam
microscopy or an ultramicrotome, thus not yielding information on the
single particle level [17]. Non-destructive characterization of
micrometer-sized particles has been done with x-ray microcomputed
tomography, but this technique does not have the required resolution to
resolve pores which are mostly nanometer-sized [18,19]. A recent
approach utilizing low convergence angle (LC) STEM tomography has
shown great promise for imaging micrometer thick samples with
nanometer resolution [20–23].
When imaging micrometer thick samples by (S)TEM tomography,
artifacts may occur as image intensity does not scale linearly with
respect to the thickness of the sample [24,25]. This nonlinearity will
* Corresponding author. Laboratory of Physical Chemistry, and Center for Multiscale Electron Microscopy, Department of Chemical Engineering and Chemistry,
Eindhoven University of Technology, Groene Loper 5, 5612 AE, Eindhoven, the Netherlands.
E-mail address: (H. Friedrich).
/>Received 27 January 2020; Received in revised form 9 March 2020; Accepted 6 April 2020
Available online 16 April 2020
1387-1811/© 2020 The Authors.
Published by Elsevier Inc.
This is an
( />
open
access
article
under
the
CC
BY-NC-ND
license
A.J. Fijneman et al.
Microporous and Mesoporous Materials 302 (2020) 110243
cause gradients in image intensity in the tomographic reconstruction
because standard reconstruction algorithms are based on linear models
(Fig. S2) [26]. Corrections for this nonlinearity are possible for objects
consisting of different chemical composition [25,27] or by correlative
approaches [28]. As the mesoporous silica particles consist only of one
phase (silicon dioxide) and due to limited capability of correlative ap
proaches, we correct instead for the nonlinearity using the near perfect
sphericity of the particles.
Relating the 3D imaging results directly to material performance and
material properties on the sub particle scale can provide valuable insight
on the relationship between structure and performance and can lead to
better models to simulate e.g. mass transfer behavior. A good way to
quantify mass transfer is by computing the intraparticle diffusivity of the
material using computer simulations. There are several ways of doing so
but the approach chosen here is to solve the diffusion equation via the
lattice Boltzmann method [29]. This method is frequently used to
simulate flow in complex structures but can also be used for diffusion
simulations under various boundary conditions [30–32].
Here we present an imaging and analysis workflow for the quanti
tative multiscale characterization of a 2-μm sized porous silica micro
sphere with 10 nm pores via LC-STEM tomography. The obtained 3D
data is used to investigate local variations in pore size distribution,
porosity as well as the intraparticle diffusivity and tortuosity of the
microsphere via lattice Boltzmann simulations. The results are
compared to standard bulk characterization techniques such as nitrogen
physisorption and show an excellent match between properties on bulk
and single particle level. With this multiscale imaging and quantification
workflow at hand, materials that expose hierarchical ordering or a
graded porosity can now be investigated.
additives are added to guide or otherwise alter the pore structure.
2.2. STEM tilt-series acquisition
LC-STEM micrographs were recorded at the TU/e FEI CryoTitan
electron microscope operating at 300 kV in microprobe STEM mode at
spot size 9 with an image sampling of 4096 � 4096 pixels. Image
magnification was set at 38000� (pixel size 0.716 nm∙pxÀ 1), such that
only one particle was located in the field of view. The convergence semiangle was set at 2 mrad and the camera length of the annular dark-field
detector (a Fischione HAADF STEM detector) was set to 240 mm. The
convergence angle and camera length were experimentally optimized to
get a large depth of field as well as to capture as many high-angle
scattered electrons as possible, while retaining a high enough spatial
resolution to resolve the individual pores. A tilt-series was recorded from
a tilt angle of 68 to ỵ68 , every 1 with a total frame time of 20s.
A representative image of the analyzed particles is shown in Fig. S2a.
It can clearly be seen that the particle is nearly perfectly spherical.
2.3. Image processing
Most image processing steps were done in MATLAB R2016b using inhouse developed code and the DIPlib scientific image processing library
V2.8.1. The workflow is shown in Scheme 1 and is further described in
the main text. Detailed information regarding each step can be found in
the Supplementary Information section 2 and in Figs. S3–S11.
The tomography reconstruction was constructed in IMOD 4.9 using a
weighted back projection algorithm with a linear density scaling of 1
and a low-pass radial filter (0.2 pxÀ 1 cut off with 0.05 pxÀ 1 fall off) [37].
A median filter (5 � 5 � 5) was applied to remove shot noise. Both filters
set the resolution cut-off at 5 pixels.
3D visualization of the reconstruction was done in Avizo 8.1.
2. Experimental methods
2.1. Materials
2.4. Lattice Boltzmann simulations
Mesoporous silica microspheres were provided by Nouryon Pulp and
Performance Chemicals (Bohus, Sweden) and are commercially avail
able under the brand name Kromasil® Classic - 100 Å SIL 1.8 μm. The
material was characterized using nitrogen physisorption (Micromeritics
TriStar 3000). The results are shown in Fig. S1. The sample displays
IUPAC type IVa behavior, which is characteristic for adsorption
behavior inside mesoporous solids. The hysteresis loop indicates a
disordered mesostructure. The particles have an average particle size of
2 μm, a BET specific surface area of 317 m2 gÀ 1, a total pore volume of
0.86 cm3 gÀ 1, and an average pore diameter of 10.9 nm. The average
porosity of the particles was calculated from the total pore volume of the
particles and the density of amorphous silicon dioxide [33]:
ẳ
1
Vpore
ẳ 0:65
ỵ Vpore
In order to transform the tomographic reconstruction into a 3D
surface suitable for diffusion simulations, the segmented reconstruction
was converted into a triangulated isosurface using VoxSurface 1.2
(VINN Excellence SuMo Biomaterials Center). Lattice Boltzmann simu
lations were then performed using Gesualdo 1.4 (VINN Excellence SuMo
Biomaterials Center). The lattice Boltzmann method was used to solve
the diffusion equation using zero flux boundary conditions on the ma
terial surface [30]. After the diffusion equation was solved to steady
state, the effective diffusion coefficient was computed from the average
flux in the direction of the concentration gradient. Additional informa
tion can be found in the Supplementary Information section 3.
(1)
3. Results and discussion
ρSiO2
3.1. Multiscale electron tomography
where Vpore is the total pore volume of the particles and ρSiO2 is the
density of amorphous SiO2, which we assume as 2.2 g cmÀ 3 [34].
The mesoporous silica microspheres were synthesized according to a
method described in detail elsewhere [35]. In brief, the starting material
is a basic aqueous silica sol, with a particle size corresponding to an area
within the range of from about 50 to about 500 m2/g. The sol is emul
sified in a polar, organic solvent that has a limited miscibility or solu
bility with water, such as e.g. benzyl alcohol. The emulsification is
carried out in the presence of a non-ionic emulsifier, such as cellulose
ether. Water from the emulsion droplets is subsequently removed by
distillation under an elevated temperature and reduced pressure,
causing the silica nanoparticles inside the emulsion droplets to form a
gel network. After washing with ethanol and water the silica micro
spheres are calcined at 600 � C to ensure no organic material is left inside
the material. The pore dimensions are governed only by the size of the
silica sol nanoparticles and reaction conditions [36]. No templating
To image the 3D pore structure of the mesoporous silica microsphere,
Scheme 1. Workflow for the quantitative electron tomography of a commercial
mesoporous silica particle (steps explained in the main text).
2
A.J. Fijneman et al.
Microporous and Mesoporous Materials 302 (2020) 110243
a data processing workflow was implemented that is summarized in
Scheme 1. The workflow consists of several steps that will be briefly
introduced below. For detailed information of each specific step we refer
to the Supplementary Information section 2 and supporting Figs. S2–S8.
The first important step towards quantification of an electron
tomogram is the alignment of the tilt-series of 2D STEM images (step 1 in
Schemes 1 and SI section 2.2.1). Tilt-series alignment is conventionally
performed by manual or automatic tracking of the position of several
gold fiducial markers on the sample or the support film over each pro
jection angle [37]. However, since the investigated silica particle was
close to a perfect sphere, the center of mass of the sphere could be used
for tilt-series alignment instead. By tracking the position of the center of
mass, the corresponding xy-shifts between images during tilting are
obtained. These xy-shifts were subsequently used to align the tilt-series
automatically and without the need for any gold fiducial markers.
The intensity of the background with tilt was then corrected (step 2
in Schemes 1 and SI section 2.2.2), followed by the local charging of the
particle (step 3 in Schemes 1 and SI section 2.2.3). The silica particle is
not interacting uniformly with the electron beam, which causes local
charging [38]. Due to this there are two different thickness-intensity
relations present in the particle: one for the charged side (left side)
and one for the uncharged side (right side) (Fig. 1a). To correct for
charging, a mean experimental projection image of the microsphere was
calculated. This image was obtained by averaging over all 137 STEM
projections using the center 90% percentiles of each pixel. Then, a radial
symmetric image of the particle was computed that is based only on the
thickness-intensity relation of the non-charged side. By dividing this
radial symmetric image by the mean projection image, a correction
factor image for the charging effect is obtained. Since the correction
factor image is based on the mean projection image, local variations in
the porosity of the particle are preserved. After applying the charge
correction to the tilt-series, the maximum intensity is observed (as ex
pected for a sphere) in the center of the particle throughout the
tilt-series.
To correct for nonlinearity between image intensity and projected
thickness (step 4 in Schemes 1 and SI section 2.4.4), a projection of a
perfect sphere was created with the same dimensions as the investigated
particle. By dividing the projection of a perfect sphere by the mean
experimental projection image, a correction factor image for nonline
arity was obtained. Multiplying this correction factor image with the
charged corrected images of the tilt-series finally provides an intensity
linearized tilt-series of the particle with preserved local variations in
porosity (Fig. 1b).
The intensity linearized tilt-series was then reconstructed (step 5 and
6 in Schemes 1 and SI section 2.4.5) by a standard weighted back
projection algorithm with linear density scaling [39], a low-pass
weighting filter (0.2 pxÀ 1 cut off with 0.05 pxÀ 1 fall off) and followed
by an edge preserving median filter (5 � 5 � 5) for further denoising
[40]. The reconstruction has a total size of 1601 � 1601 x 1601 voxels
and a final pixel size of 1.432 nm∙pxÀ 1. After reconstruction, the 3D
data inside a spherical mask corresponding to the particle (step 7 in
Schemes 1 and SI section 2.2.6), was segmented using a global intensity
threshold (step 8 in Schemes 1 and SI section 2.2.7). This threshold
corresponds to a particle porosity of 65%, as determined by N2 phys
isorption for the bulk material. Segmentation assigns all pixels with
intensities below the threshold to a value of 0 which is considered a
pore, while every pixel value above the threshold is set to 1 and
considered to be silica. An example of a numerical cross section through
the 3D reconstruction is shown in Fig. 1c.
3.2. Quantification of porosity, strut and pore size distributions
Quantification of the segmented reconstruction enables us to calcu
late globally and locally the porosity, strut and pore size distribution
(PSD), which cannot be done by any other means. The segmentation
approach that was used to calculate the size distributions is reasonable,
because the assumption of a segmentation threshold based on global
porosity and the analysis of the local PSDs are not directly related
properties.
To quantify the data locally the particle is divided into 13 subvolumes of 250 � 250 x 250 voxels in size each, which are divided
along the x-axis from left to right (in red), along the y-axis from back to
front (in green) and along the z-axis from top to bottom (in blue),
respectively (Fig. 2a). Size distributions of the pores and struts of
respectively the whole particle and of each of the sub-volumes were
calculated using the following procedure (Fig. S10). First, a Euclidean
distance transform is calculated from the segmented data (inverse
logical for pores) to obtain a distance map which, for each point making
up the pores, gives the shortest distance between this point to the pore
boundary, i.e., the nearest silica surface [41]. Next, the centerlines of the
pore network are obtained by skeletonization [42]. By multiplying the
distance map with the skeleton of the pore network only values along
the centerlines of the pore network are selected and considered for
calculation of the pore diameter distribution. Since the values given in
the distance map effectively represent the locally observed pore radius,
multiplying them by two times the pixel size gives the pore diameter.
Due to resolution constraints (reconstruction, noise removal, etc.) values
larger than 5 pixels (7.2 nm) are considered reliable. All remaining
values are sorted in a histogram with a bin size of 1 pixel (1.4 nm) and
normalized with respect to the total pore volume. The same is done for
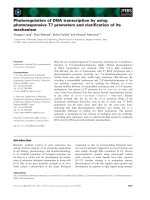
Fig. 1. (a) STEM micrograph at 0� tilt rendered in false color for better visibility of nonlinear thickness and residual charging artifacts. (b) STEM micrograph at 0� tilt
after correcting for the background, charge and nonlinearity. The intensity now scales linearly with the thickness. (c) Central numerical cross section after seg
mentation. The vaguely visible horizontal line through the center is an artefact of the rotation axis. (For interpretation of the references to color in this figure legend,
the reader is referred to the Web version of this article.)
3
A.J. Fijneman et al.
Microporous and Mesoporous Materials 302 (2020) 110243
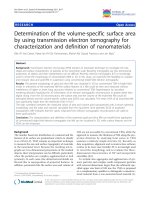
Fig. 2. (a) Schematic representation of the segmented reconstruction in which 13 sub-volumes of 250 � 250 x 250 voxels are highlighted along the x-axis (in red), yaxis (in green), and z-axis (in blue), respectively. (b) Comparison of the PSD of the whole particle as determined via tomography vs the PSD determined via N2 gas
physisorption. The close match indicates an extraordinary particle-to-particle homogeneity. (c–e) Local variations in the mean pore diameter and mean strut diameter
along the x-axis, y-axis, and z-axis, respectively. (For interpretation of the references to color in this figure legend, the reader is referred to the Web version of
this article.)
the silica strut network using the original binarized data without logical
inversion.
Globally, the PSD obtained from the tomography of the whole par
ticle match excellently with the PSD obtained from nitrogen phys
isorption data on the bulk (Fig. 2b). This indicates an extraordinary
homogeneity of the product (from particle to particle). There is a slight
difference between the PSD obtained from the adsorption isotherm
compared to the desorption isotherm because there is a physical dif
ference in the way the pores are filled (capillary condensation) and
emptied (capillary evaporation) [43].
Locally, the PSDs in the middle of the particle are slightly narrower
than the PSD over the whole particle and the PSDs on the edge of the
particle are slightly broader (Fig. S11). Along the x-axis the pores are
somewhat smaller at the center (9.6 � 1.3 nm) than at the edge of the
particle (11.6 � 2.5 nm), whereas the size of the silica struts network
remains constant throughout the particle (8.9 � 0.9 nm) (Fig. 2c). A
similar trend can be seen along the z-axis, except here the size of the
silica struts is also slightly larger at the edge of the particle (9.6 � 1.4
nm) than at the center (Fig. 2d). The sub-volumes along the y-axis show
a different trend. Here, the pores are slightly larger at one edge of the
particle (10.7 � 2.0 nm) than at the other edge of the particle (10.0 �
1.5 nm) (Fig. 2e).
The local porosity, defined as the number of pore pixels times the
pixel size and divided over the total size of the sub-volume, also varies
slightly throughout the particle. Along the x-axis the porosity is clearly
higher at the edge of the particle (φ ¼ 0.74) compared to the center (φ ¼
0.62), whereas it remains relatively constant (φ ¼ 0.62 � 0.02) along the
y-axis and z-axis, respectively (Fig. 3a–c). The trend in porosity follows
the average pore and strut size variations along the major axis.
Since the pore network of the investigated particle is governed only
by the size of the silica sol nanoparticles, and the size of the silica struts
network remains constant throughout the particle, the observed in
homogeneity in porosity and pore size must be a result of the formation
mechanism. We hypothesize that, due to evaporation of water, the
emulsion droplet initially decreases in diameter accompanied by an
increase in solid concentration near the droplet interface. This results in
gelation starting from the droplet surface with further water evaporation
being then somewhat hindered, which could explain a slight difference
in particle volume fraction throughout the particle. Similar effects have
been observed in, e.g., spray drying of droplets containing solid nano
particles [44].
These local intraparticle differences indicate subtle but unmistaken
local inhomogeneity throughout the particle, which could have a pro
found impact on the mass transport behavior throughout the particle
[45]. This is important because the particle is used in chromatography
applications where mass transport plays an important role in the sepa
ration efficiency. Insight in the behavior of mass transport through
multiscale porous structures can ultimately lead to better computer
models and the design of more efficient particles [46].
3.3. Lattice Boltzmann diffusion simulations
The segmented 3D tomography data can also be used to simulate
locally the effective diffusion throughout the particle. To do so, the
lattice Boltzmann method was used to solve the diffusion equation in
side the reconstructed data (SI section 3.1) [31]. This gives a value for
the effective intraparticle diffusion coefficient Deff over the free diffusion
constant D0, which depend on the geometry of the structure (porosity
and tortuosity) but not on the length scale of the pores (Fig. 3a–c) [47,
48]:
4
A.J. Fijneman et al.
Microporous and Mesoporous Materials 302 (2020) 110243
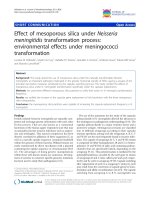
Fig. 3. (a–c) Local variations in the porosity and intraparticle diffusion coefficient along the x-axis, y-axis, and z-axis, respectively. (d–f) Local variations in the
intraparticle tortuosity coefficient along the x-axis, y-axis, and z-axis, respectively.
Deff ¼ k* D0
tortuosity, defined as the length of the traveled distance through the
medium to the straight-line length across the medium, has significant
implications for mass transfer behavior through porous media and has
been the subject of many studies over the past decades [50–54]. Bar
rande et al. [52] derived the following equation for the intraparticle
tortuosity from particle conductivity experiments on spherical glass
beads:
(2)
where Deff is the effect diffusion coefficient in the pore network, D0 is the
free diffusion coefficient (2.3 � 10À 9 m2 sÀ 1) and k* is a dimensionless
proportionality factor called the ‘geometry factor’.
The results in Fig. 3a–c show that the diffusion constant is almost
proportional to the local particle porosity for each of the three major
axis. The higher the local porosity, the higher the local diffusion con
stant. The diffusion constant was computed in three directions for each
individual sub-volume. Although the diffusion coefficient should be
more or less constant in each direction because there is no obvious
distinct anisotropy in the particle, there is a clear distinction between
the diffusion values in the x-,y-, and z-direction in each individual subvolume (Fig. S12). This is unrelated to the particle structure but is rather
a result of the so called ‘missing wedge of data’ from the tomography
due to the limited amount of projection angles [49]. To account for the
anisotropic resolution, tomography data was simulated from a perfectly
isotropic cube with the same dimensions and porosity as the investigated
particle (SI section 3.2). Projections were computed over the experi
mental angular range (�68� ) as well as over the full angular range
(�90� ). Simulated reconstructions were then calculated with and
without the same processing steps that were applied to the experimental
tomogram of the investigated particle (Table S1).
The results show that there is no difference in the values for Deff/D0
with or without processing, indicating that the processing steps that
were applied do not shift the location of the pore boundaries. In addi
tion, there is no variation for Deff/D0 in the x-, y-, and z-direction in each
sub-volume when projections were computed over the full angular
range. This indicates that anisotropy in the direction of the missing
wedge artefact (z-direction) is a limitation of the imaging approach and
is unrelated to the observed local inhomogeneity of the investigated
particle.
τ ¼ 1 À 0:49 ln φ
(3)
where τ is the intraparticle tortuosity and φ is the intraparticle porosity.
Barrande et al. state that tortuosity is a topological characteristic of
the material and therefore depends only on porosity for a random system
of spheres. As a consequence, they argue that the equation is also valid
for any particle that itself is made of a random distribution of dense
spheres if the porosity is homogeneously distributed through the parti
cles. Applying Equation (3) on our data and averaging over each of the
15 sub-volumes yields an intraparticle tortuosity of 1.21 � 0.03
(Fig. 3d–f), which is in good agreement with results reported in litera
ture [52,55]. An intraparticle tortuosity close to 1 indicates that there is
little to no hindrance to diffusion, which is important in separation
applications [51].
The tortuosity can also be derived from the lattice Boltzmann
diffusion simulations [56]:
φ
Deff ¼ D0
τ
(4)
where φ is the intraparticle porosity and τ is the tortuosity of the
structure, Deff is the effective diffusion constant and D0 is the free
diffusion constant.
Applying Equation (4) on our data and averaging over each of the 15
sub-volumes yields an intraparticle tortuosity of 1.26 � 0.05 (Fig. 3d–f),
which is in very good agreement with the intraparticle tortuosity
derived from Equation (3). This indicates that Equation (3) is a simple
yet surprisingly accurate way to get an indication for the intraparticle
tortuosity for these kinds of materials.
The diffusion simulations and tortuosity calculations confirm that
3.4. Intraparticle tortuosity
The relationship between the intraparticle porosity and intraparticle
5
A.J. Fijneman et al.
Microporous and Mesoporous Materials 302 (2020) 110243
there are local intraparticle differences that will have an impact on the
diffusion path across the particle. With these new insights into the
intraparticle morphology, steps can be taken towards elucidating the
mass transfer behavior inside the studied commercial mesoporous silica
microspheres or other materials in the future.
References
[1] M.W. Anderson, T. Ohsuna, Y. Sakamoto, Z. Liu, A. Carlsson, O. Terasaki, Modern
microscopy methods for the structural study of porous materials, Chem. Commun.
4 (2004) 907–916, />[2] B.F. McEwen, M. Marko, The emergence of electron tomography as an important
tool for investigating cellular ultrastructure, J. Histochem. Cytochem. 49 (2001)
553–564, />[3] C. Kübel, A. Voigt, R. Schoenmakers, M. Otten, D. Su, T.C. Lee, A. Carlsson,
J. Bradley, Recent advances in electron tomography: TEM and HAADF-STEM
tomography for materials science and semiconductor applications, Microsc.
Microanal. 11 (2005) 378–400, />[4] P.A. Midgley, E.P.W. Ward, A.B. Hungría, J.M. Thomas, Nanotomography in the
chemical, biological and materials sciences, Chem. Soc. Rev. 36 (2007) 1477–1494,
/>[5] K.J. Batenburg, S. Bals, J. Sijbers, C. Kübel, P.A. Midgley, J.C. Hernandez,
U. Kaiser, E.R. Encina, E.A. Coronado, G. van Tendeloo, 3D imaging of
nanomaterials by discrete tomography, Ultramicroscopy 109 (2009) 730–740,
/>[6] Z. Saghi, P.A. Midgley, Electron tomography in the (S)TEM: from nanoscale
morphological analysis to 3D atomic imaging, Annu. Rev. Mater. Res. 42 (2012)
59–79, />[7] J.E. Evans, H. Friedrich, Advanced tomography techniques for inorganic, organic,
and biological materials, MRS Bull. 41 (2016) 516–521, />mrs.2016.134.
[8] H. Friedrich, P.E. de Jongh, A.J. Verkleij, K.P. de Jong, Electron tomography for
heterogeneous catalysts and related nanostructured materials, Chem. Rev. 109
(2009) 1613–1629, />[9] E. Biermans, L. Molina, K.J. Batenburg, S. Bals, G. van Tendeloo, Measuring
porosity at the nanoscale by quantitative electron tomography, Nano Lett. 10
(2010) 5014–5019, />[10] Y. Yao, K.J. Czymmek, R. Pazhianur, A.M. Lenhoff, Three-dimensional pore
structure of chromatographic adsorbents from electron tomography, Langmuir 22
(2006) 11148–11157, />[11] J. Ze�cevi�c, K.P. de Jong, P.E. de Jongh, Progress in electron tomography to assess
the 3D nanostructure of catalysts, Curr. Opin. Solid State Mater. Sci. 17 (2013)
115–125, />[12] Y. Sakamoto, M. Kaneda, O. Terasaki, D.Y. Zhao, J.M. Kim, G. Stucky, H.J. Shin,
R. Ryoo, Direct imaging of the pores and cages of three-dimensional mesoporous
materials, Nature 408 (2000) 449–453, />[13] M. Kruk, M. Jaroniec, Y. Sakamoto, O. Terasaki, R. Ryoo, C.H. Ko, Determination
of pore size and pore wall structure of MCM-41 by using nitrogen adsorption,
transmission electron microscopy, and X-ray diffraction, J. Phys. Chem. B 104
(2000) 292–301, />[14] L.R. Snyder, J.J. Kirkland, J.W. Dolan, Introduction to Modern Liquid
Chromatography, John Wiley & Sons, Inc., Hoboken, NJ, USA, 2009, https://doi.
org/10.1002/9780470508183.
[15] F. Gritti, G. Guiochon, Importance of sample intraparticle diffusivity in
investigations of the mass transfer mechanism in liquid chromatography, AIChE J.
57 (2011) 346–358, />[16] F. Gritti, K. Horvath, G. Guiochon, How changing the particle structure can speed
up protein mass transfer kinetics in liquid chromatography, J. Chromatogr., A 1263
(2012) 84–98, />[17] J. Mayer, L.A. Giannuzzi, T. Kamino, J. Michael, TEM sample preparation and
damage, MRS Bull. 32 (2007) 400–407, />[18] T.F. Johnson, J.J. Bailey, F. Iacoviello, J.H. Welsh, P.R. Levison, P.R. Shearing, D.
G. Bracewell, Three dimensional characterisation of chromatography bead internal
structure using X-ray computed tomography and focused ion beam microscopy,
J. Chromatogr., A 1566 (2018) 79–88, />chroma.2018.06.054.
[19] E. Maire, J.Y. Buffi�
ere, L. Salvo, J.J. Blandin, W. Ludwig, J.M. L�
etang, On the
application of X-ray microtomography in the field of materials science, Adv. Eng.
Mater. 3 (2001) 539, />[20] J. Loos, E. Sourty, K. Lu, B. Freitag, D. Tang, D. Wall, Electron tomography on
micrometer-thick specimens with nanometer resolution, Nano Lett. 9 (2009)
1704–1708, />[21] J. Biskupek, J. Leschner, P. Walther, U. Kaiser, Optimization of STEM tomography
acquisition - a comparison of convergent beam and parallel beam STEM
tomography, Ultramicroscopy 110 (2010) 1231–1237, />ultramic.2010.05.008.
[22] T. Segal-Peretz, J. Winterstein, M. Doxastakis, A. Ramírez-Hern�
andez, M. Biswas,
J. Ren, H.S. Suh, S.B. Darling, J.A. Liddle, J.W. Elam, J.J. de Pablo, N.J. Zaluzec, P.
F. Nealey, Characterizing the three-dimensional structure of block copolymers via
sequential infiltration synthesis and scanning transmission electron tomography,
ACS Nano 9 (2015) 5333–5347, />[23] K. Gnanasekaran, R. Snel, G. de With, H. Friedrich, Quantitative nanoscopy:
tackling sampling limitations in (S)TEM imaging of polymers and composites,
Ultramicroscopy 160 (2016) 130–139, />ultramic.2015.10.004.
[24] S. Bals, R. Kilaas, C. Kisielowski, Nonlinear imaging using annular dark field TEM,
Ultramicroscopy 104 (2005) 281–289, />ultramic.2005.05.004.
[25] W. van den Broek, A. Rosenauer, B. Goris, G.T. Martinez, S. Bals, S. van Aert,
D. van Dyck, Correction of non-linear thickness effects in HAADF STEM electron
4. Conclusions
We present a method to obtain quantitative local insight into pore
and strut size distributions of mesoporous silica spheres and, hence,
mass transport through multiscale porous structures using LC-STEM
tomography in combination with lattice Boltzmann simulations. We
show for the first-time on the example of commercially available mes
oporous silica an excellent match between the single microsphere level
and the bulk material. Furthermore, quantifying local differences in the
pore distribution as well as intraparticle diffusivity and tortuosity that
cannot be obtained otherwise highlight the benefits of using multiscale
electron tomography in combination with image analysis. Expanding
the technique to other materials can lead to new approaches to tune
particle porosity and/or graded porosity and to optimize mass transfer
kinetics on the single microsphere level.
Funding
This project has received funding from the European Union’s Hori
zon 2020 research and innovation programme under the Marie Skło
dowska-Curie grant agreement No 676045 and from a seed-grant from
SuMo Biomaterials, a VINN Excellence Center funded by Vinnova.
Declaration of competing interest
The authors declare that they have no known competing financial
interests or personal relationships that could have appeared to influence
the work reported in this paper.
CRediT authorship contribution statement
Andreas J. Fijneman: Investigation, Writing - original draft, Formal
analysis, Visualization. Maurits Goudzwaard: Software, Validation.
Arthur D.A. Keizer: Software, Validation. Paul H.H. Bomans: Inves
€ck: Software, Validation, Formal analysis, Writing
tigation. Tobias Geba
€ f: Conceptualization, Supervision.
- review & editing. Magnus Palmlo
€ gblom:
Michael Persson: Conceptualization, Supervision. Joakim Ho
Conceptualization, Supervision. Gijsbertus de With: Writing - review &
editing. Heiner Friedrich: Conceptualization, Supervision, Investiga
tion, Formal analysis, Visualization, Software, Validation, Writing - re
view & editing.
Acknowledgements
Electron microscopy was performed at the Center for Multiscale
Electron Microscopy, Eindhoven University of Technology. N2 phys
isorption experiments were performed at the chemical analysis lab of
Nouryon Pulp and Performance Chemicals AB. Lattice Boltzmann sim
ulations were performed at SuMo Biomaterials, VINN Excellence Center,
Chalmers University of Technology.
Appendix A. Supplementary data
Supplementary data to this article can be found online at https://doi.
org/10.1016/j.micromeso.2020.110243.
6
A.J. Fijneman et al.
[26]
[27]
[28]
[29]
[30]
[31]
[32]
[33]
[34]
[35]
[36]
[37]
[38]
[39]
[40]
Microporous and Mesoporous Materials 302 (2020) 110243
[41] P. Danielsson, Euclidean distance mapping, Comput. Graph. Image Process. 14
(1980) 227–248, />[42] G. Malandain, S. Fern�
andez-Vidal, Euclidean skeletons, image, Vis. Comput. 16
(1998) 317–327, />[43] M. Thommes, K. Kaneko, A.V. Neimark, J.P. Olivier, F. Rodriguez-Reinoso,
J. Rouquerol, K.S.W. Sing, Physisorption of gases, with special reference to the
evaluation of surface area and pore size distribution (IUPAC Technical Report),
Pure Appl. Chem. 87 (2015) 1051–1069, />[44] M. Mezhericher, A. Levy, I. Borde, Theoretical models of single droplet drying
kinetics: a review, Dry. Technol. 28 (2010) 278–293, />07373930903530337.
[45] F. Gritti, G. Guiochon, New insights on mass transfer kinetics in chromatography,
AIChE J. 57 (2011) 333–345, />[46] S.T. Sie, R. Krishna, Fundamentals and selection of advanced Fischer–Tropsch
reactors, Appl. Catal. A Gen. 186 (1999) 55–70, />[47] L. Shen, Z. Chen, Critical review of the impact of tortuosity on diffusion, Chem.
Eng. Sci. 62 (2007) 3748–3755, />[48] B. Ghanbarian, A.G. Hunt, R.P. Ewing, M. Sahimi, Tortuosity in porous media: a
critical review, Soil Sci. Soc. Am. J. 77 (2013) 1461–1477, />10.2136/sssaj2012.0435.
[49] I. Arslan, J.R. Tong, P.A. Midgley, Reducing the missing wedge: high-resolution
dual axis tomography of inorganic materials, Ultramicroscopy 106 (2006)
994–1000, />[50] J. Comiti, M. Renaud, A new model for determining mean structure parameters of
fixed beds from pressure drop measurements: application to beds packed with
parallelepipedal particles, Chem. Eng. Sci. 44 (1989) 1539–1545, />10.1016/0009-2509(89)80031-4.
[51] B.P. Boudreau, The diffusive tortuosity of fine-grained unlithified sediments,
Geochem. Cosmochim. Acta 60 (1996) 3139–3142, />[52] M. Barrande, R. Bouchet, R. Denoyel, Tortuosity of porous particles, Anal. Chem.
79 (2007) 9115–9121, />[53] M. Matyka, A. Khalili, Z. Koza, Tortuosity-porosity relation in porous media flow,
Phys. Rev. E. 78 (2008), 026306, />[54] Z. Sun, X. Tang, G. Cheng, Numerical simulation for tortuosity of porous media,
Microporous Mesoporous Mater. 173 (2013) 37–42, />micromeso.2013.01.035.
[55] F. Gritti, G. Guiochon, Effect ofthe surface coverage of C18-bonded silica particles
on the obstructive factor and intraparticle diffusion mechanism, Chem. Eng. Sci. 61
(2006) 7636–7650, />[56] H. Iwai, N. Shikazono, T. Matsui, H. Teshima, M. Kishimoto, R. Kishida,
D. Hayashi, K. Matsuzaki, D. Kanno, M. Saito, H. Muroyama, K. Eguchi, N. Kasagi,
H. Yoshida, Quantification of SOFC anode microstructure based on dual beam FIBSEM technique, J. Power Sources 195 (2010) 955–961, />jpowsour.2009.09.005.
tomography, Ultramicroscopy 116 (2012) 8–12, />ultramic.2012.03.005.
R. Gordon, R. Bender, G.T. Herman, Algebraic Reconstruction Techniques (ART)
for three-dimensional electron microscopy and X-ray photography, J. Theor. Biol.
29 (1970) 471–481, />Z. Zhong, R. Aveyard, B. Rieger, S. Bals, W.J. Palenstijn, K.J. Batenburg, Automatic
correction of nonlinear damping effects in HAADF–STEM tomography for
nanomaterials of discrete compositions, Ultramicroscopy 184 (2018) 57–65,
/>D. Wolf, R. Hübner, T. Niermann, S. Sturm, P. Prete, N. Lovergine, B. Büchner,
A. Lubk, Three-dimensional composition and electric potential mapping of III-V
core-multishell nanowires by correlative STEM and holographic tomography, Nano
Lett. 18 (2018) 4777–4784, />T. Krüger, H. Kusumaatmaja, A. Kuzmin, O. Shardt, G. Silva, E.M. Viggen, The
Lattice Boltzmann Method, Springer International Publishing, Cham, 2017,
/>I. Ginzburg, Equilibrium-type and link-type lattice Boltzmann models for generic
advection and anisotropic-dispersion equation, Adv. Water Resour. 28 (2005)
1171–1195, />T. Geb€
ack, M. Marucci, C. Boissier, J. Arnehed, A. Heintz, Investigation of the effect
of the tortuous pore structure on water diffusion through a polymer film using
lattice Boltzmann simulations, J. Phys. Chem. B 119 (2015) 5220–5227, https://
doi.org/10.1021/acs.jpcb.5b01953.
T. Geb€
ack, A. Heintz, A lattice Boltzmann method for the advection-diffusion
equation with neumann boundary conditions, Commun. Comput. Phys. 15 (2014)
487–505, />S. Lowell, J.E. Shields, M.A. Thomas, M. Thommes, Other surface area methods.
Charact. Porous Solids Powders Surf. Area, Pore Size Density, sixteenth ed.,
Springer, Dordrecht, 2004, pp. 82–93, />R.K. Iler, The Chemistry of Silica, John Wiley & Sons, Inc., New York, 1979.
M. Nystr€
om, W. Herrmann, B. Larsson, Method for Preparation of Silica Particles,
US Patent 5.256.386, 1993.
H. Gustafsson, K. Holmberg, Emulsion-based synthesis of porous silica, Adv.
Colloid Interface Sci. 247 (2017) 426–434, />cis.2017.03.002.
J.R. Kremer, D.N. Mastronarde, J.R. McIntosh, Computer visualization of threedimensional image data using IMOD, J. Struct. Biol. 116 (1996) 71–76, https://doi.
org/10.1006/jsbi.1996.0013.
R.F. Egerton, Radiation damage to organic and inorganic specimens in the TEM,
Micron 119 (2019) 72–87, />M. Weyland, P. Midgley, Electron tomography, in: Transm. Electron Microsc,
Springer, Cham, 2016, pp. 343–376, />12.
P. van der Heide, X.P. Xu, B.J. Marsh, D. Hanein, N. Volkmann, Efficient automatic
noise reduction of electron tomographic reconstructions based on iterative median
filtering, J. Struct. Biol. 158 (2007) 196–204, />jsb.2006.10.030.
7